| Issue |
A&A
Volume 696, April 2025
|
|
|---|---|---|
| Article Number | A44 | |
| Number of page(s) | 15 | |
| Section | Planets, planetary systems, and small bodies | |
| DOI | https://doi.org/10.1051/0004-6361/202453508 | |
| Published online | 02 April 2025 | |
TOI-6508 b: A massive transiting brown dwarf orbiting a low-mass star
1
Astrobiology Research Unit, Université de Liège,
Allée du 6 Août 19C,
4000
Liège,
Belgium
2
Department of Earth, Atmospheric and Planetary Science, Massachusetts Institute of Technology,
77 Massachusetts Avenue,
Cambridge,
MA
02139, USA
3
Instituto de Astrofísica de Canarias (IAC),
Calle Vía Láctea s/n,
38200
La Laguna, Tenerife,
Spain
4
School of Physics & Astronomy, University of Birmingham,
Edgbaston, Birmingham
B15 2TT, UK
5
Department of Physics and Kavli Institute for Astrophysics and Space Research, Massachusetts Institute of Technology,
Cambridge,
MA
02139, USA
6
Department of Astronomy & Astrophysics, UC San Diego,
9500 Gilman Drive,
La Jolla,
CA
92093, USA
7
Institute for Astronomy, University of Hawai‘i,
2680 Woodlawn Drive,
Honolulu,
HI
96822, USA
8
Instituto de Alta Investigación, Universidad de Tarapacá,
Casilla 7D,
Arica,
Chile
9
Kotizarovci Observatory,
Sarsoni 90,
51216
Viskovo, Croatia
10
Oukaimeden Observatory, High Energy Physics and Astrophysics Laboratory, Faculty of sciences Semlalia, Cadi Ayyad University,
Marrakech,
Morocco
11
Komaba Institute for Science, The University of Tokyo,
3-8-1 Komaba,
Meguro, Tokyo
153-8902, Japan
12
Space Sciences, Technologies and Astrophysics Research (STAR) Institute, Université de Liège,
Allée du 6 Août 19C,
B-4000
Liège, Belgium
13
NASA Exoplanet Science Institute, IPAC, California Institute of Technology,
Pasadena,
CA
91125, USA
14
Center for Astrophysics | Harvard & Smithsonian,
60 Garden Street,
Cambridge,
MA
02138, USA
15
Center for Space and Habitability, University of Bern,
Gesellschaftsstrasse 6,
3012
Bern, Switzerland
16
Paris Region Fellow, Marie Sklodowska-Curie Action,
France
17
AIM, CEA, CNRS, Université Paris-Saclay, Université de Paris,
91191
Gif-sur-Yvette, France
18
Institut Trottier de recherche sur les exoplanètes, Département de Physique, Université de Montréal,
Montréal, Québec,
Canada
19
Department of Astronomy, Tsinghua University,
Beijing
100084, PR China
20
Universidad Nacional Autónoma de México, Instituto de Astronomía,
AP 70-264,
Ciudad de México
04510,
Mexico
21
Cavendish Laboratory,
JJ Thomson Avenue,
Cambridge
CB3 0HE, UK
22
Bay Area Environmental Research Institute,
Moffett Field,
CA
94035, USA
23
NASA Ames Research Center,
Moffett Field,
CA
94035, USA
24
Departamento de Astrofísica, Universidad de La Laguna (ULL),
38206
La Laguna, Tenerife,
Spain
25
Institute for Particle Physics and Astrophysics , ETH Zürich,
Wolfgang-Pauli-Strasse 2,
8093
Zürich, Switzerland
26
Instituto de Astrofísica de Andalucía (IAA-CSIC),
Glorieta de la Astronomía s/n,
18008
Granada,
Spain
27
Department of Physics and Kavli Institute for Astrophysics and Space Research, Massachusetts Institute of Technology,
Cambridge,
MA
02139, USA
28
Department of Aeronautics and Astronautics, MIT,
77 Massachusetts Avenue,
Cambridge,
MA
02139, USA
29
Hazelwood Observatory,
Australia
30
Department of Astrophysical Sciences, Princeton University,
Princeton,
NJ
08544, USA
★ Corresponding author; This email address is being protected from spambots. You need JavaScript enabled to view it.
Received:
18
December
2024
Accepted:
26
February
2025
Abstract
We report the discovery of a transiting brown dwarf orbiting a low-mass star, TOI-6508 b. Today, only ∼50 transiting brown dwarfs have been discovered. TOI-6508 b was first detected with data from the Transiting Exoplanet Survey Satellite (TESS) in Sectors 10, 37 and 63. Ground-based follow-up photometric data were collected with the SPECULOOS-South (Search for habitable Planets EClipsing ULtra-cOOl Stars) and LCOGT-1m telescopes, and RV measurements were obtained with the Near InfraRed Planet Searcher (NIRPS) spectrograph. We find that TOI-6508 b has a mass of Mp = 72.5−5.1+7.6 MJup and a radius of Rp = 1.03 ± 0.03 RJup. Our modeling shows that the data are consistent with an eccentric orbit of 19 day and an eccentricity of e = 0.28−0.08+0.09. TOI-6508 b has a mass ratio of MBD/M★ = 0.40, makes it the second highest mass ratio brown dwarf that transits a low-mass star. The host has a mass of M★ = 0.174 ± 0.004 M⊙, a radius of R★ = 0.205 ± 0.006 R⊙, an effective temperature of Teff = 2930 ± 70 K, and a metallicity of [Fe/H] = −0.22 ± 0.08. This makes TOI-6508 b an interesting discovery that has come to light in a region still sparsely populated.
Key words: brown dwarfs / stars: individual: TOI-6508
© The Authors 2025
 Open Access article, published by EDP Sciences, under the terms of the Creative Commons Attribution License (https://creativecommons.org/licenses/by/4.0), which permits unrestricted use, distribution, and reproduction in any medium, provided the original work is properly cited.
This article is published in open access under the Subscribe to Open model. This email address is being protected from spambots. You need JavaScript enabled to view it. to support open access publication.
1 Introduction
Brown dwarfs (BDs) are traditionally defined as objects between giant planets (~13 MJup) and stars (~80 MJup), with radii ranging from 0.7 to 1.4 RJup. The lower limit that separates giant planets from BDs corresponds to the ignition of deuterium fusion in the core of the BD. This limit varies within the range of 11–16 MJup depending on the abundance of deuterium and the bulk metal-licity (Spiegel et al. 2011). The upper limit that separates the BDs and stars corresponds to hydrogen fusion, and varies within the 75–80 MJup range depending on the stellar initial formation conditions (Baraffe et al. 2002). Based on this mass definition, the cores of BDs are partially degenerate. To improve the characterization and classification of the BDs, the transit method is very useful as it provides additional information, specifically the radius. However, any candidate companion close in size to 1 RJ can be a brown dwarf, giant planet, or a low-mass star as it is not clear solely from the radius, making the measurement of the companion’s mass crucial for BD discovery.
Transiting BDs orbiting low-mass stars offer us valuable opportunities to measure the radius and mass (in combination with the radial-velocity technique) and orbital parameters of the system. The relatively small size of the star leads to a large transit signal on the order of ten percent. Furthermore, the relatively low mass results in a huge radial-velocity signal on the order of several kilometers per second. This makes high-precision measurements of a BD’s mass and radius possible. The mass and radius are key for exploring the physical properties of the BDs in order to improve our understanding of the mechanisms of formation and evolution of these mysterious sub-stellar objects. (Baraffe et al. 2002; Saumon & Marley 2008; Phillips et al. 2020; Chabrier et al. 2023).
Our current understanding of planetary formation predicts a low probability of the existence of Jupiter-like planets and BDs around low-mass stars with M✶ ≤ 0.4 M⊙, and their formation by core accretion becomes increasingly unlikely as M✶ > 0.4M⊙. (Kanodia et al. 2022; Palle et al. 2021; Burn et al. 2021). However, we have only discovered nine transiting BDs orbiting low-mass stars to date, with host masses ranging from 0.25– 0.65 M⊙ . Due to the small size of this sample, the occurrence rate of BDs around low-mass stars is still highly uncertain; more detections are necessary to compare observations to theoretical expectations.
In this paper, we present a new system orbiting a low-mass M dwarf (M✶ = 0.17 ± 0.02 M⊙) in a 19-day eccentric orbit ( ), TOI-6508. This system contains a transiting BD, TOI-6508 b with a mass of MBD = 72.5 MJup and a radius of RBD = 1.03 RJup around an M5 star.
The paper is organized as follows. We present TESS data and ground-based photometric and spectroscopic observations in Section 2. The stellar characterization of TOI-6508 (spectroscopic and spectral-energy-distribution analysis) is presented in Section 3. Section 4 describes the global modeling of photometric and radial-velocity data. Finally, a discussion and our conclusions are presented in Section 5.
TESS observations log for TOI-6508.
2 Observations and data reduction
2.1 TESS photometric observation
The host star TIC 142277868 (TOI-6508) was observed by the TESS mission (Ricker et al. 2015) in Sector 10, from March 26 to April 22 2019. The relevant data are available within the full-frame images (FFIs) with a cadence of 1800 seconds. The target was re-observed during the extended mission in Sectors 37 and 63, and FFI data are available with a cadence of 600 seconds and 200 seconds, respectively (see Table 1). We used the Pre-search Data Conditioning Simple Aperture Photometry flux (PDC-SAP; Stumpe et al. 2012; Smith et al. 2012; Stumpe et al. 2014), constructed by the TESS Science Processing Operations Center (SPOC; Jenkins et al. 2016) at the Ames Research Center, from the Mikulski Archive for Space Telescopes1. The PDC- SAP light curves were calibrated for any instrument systematics and crowding effects. The TOI-6508 light curves were normalized using the lightkurve (Lightkurve Collaboration 2018) Python package. Figure 1 shows the TOI-6508 field of view in the TESS data, as well as the photometric apertures that were used to construct the light curves. The locations of nea Gaia DR3 sources are also marked (Gaia Collaboration 2021). Figure 2 shows the TESS photometric data.
2.2 Ground-based photometric observation
We performed ground-based follow-up observations of TOI-6508 as part of the TESS follow-up observing program (TFOP) in order to confirm the transit event on the target star, rule out nearby eclipsing binaries (NEBs) as the source of the transit signal, measure the transit depth, and refine the transit ephemerides. To schedule time-series observations, we used the TESS transit finder tool (Jensen 2013), which is a customized version of the Tapir software package. The groundbased photometric observations are summarized in Table 2. The observed transit light curves are presented in Figures 3 and 4.
2.2.1 SPECULOOS-South
We used the SPECULOOS-South (Jehin et al. 2018; Delrez et al. 2018; Sebastian et al. 2021) facilities to observe the transits of TOI-6508 b simultaneously in the Sloan-r′ and -i′ filters on UTC March 29, 2024 with exposure times of 180 seconds and 105 seconds, respectively. Each 1.0 m telescope is equipped with a 2K×2K CCD camera with a pixel scale of 0.35″ and a total FOV of 12′×12′. Data reduction and aperture photometry were performed using the PROSE2 pipeline (Garcia et al. 2022).
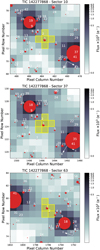 |
Fig. 1 TESS target pixel file images for TOI-6508 observed in Sectors 10 (top), 37 (middle) and 63 (bottom). The plots are made with the tpfplotter (Aller et al. 2020) package. The pixels highlighted in yellow show the TESS apertures. The red dots show the positions of Gaia DR3 sources, and their sizes correspond to their TESS magnitudes. |
2.2.2 LCOGT-1.0 m
We used the Las Cumbres Observatory Global Telescope (LCOGT; Brown et al. 2013) 1.0m facilities to simultaneously observe four full transits of TOI-6508 b in the Pan-STARRS-ɀs and V filters. Two transits were observed on UTC Feb. 21, 2024, and two others were observed on UTC March 11, 2024. An additional transit of TOI-6508 b was observed with LCO-Teid-1m0 at the Teide Observatory on UTC Jan. 10, 2025 in the Pan- STARRS-ɀs. The LCOGT telescopes are equipped with 4096 × 4096 SINISTRO camera with a pixel scale of 0.389″ per pixel and a total FOV of 26′× 26′.
TOI-6508 b was also observed during an occultation at the Southern African Astronomical Observatory (SAAO) in the Sloan-i′ filter. The first observation was carried out on UTC May 16, 2024 assuming a circular orbit. The Second observation was carried out on UTC February 8, 2025 assuming an eccentric orbit. Figure 5 shows the secondary-eclipse light curves.
The science data processing was performed using the standard LCOGT BANZAI pipeline (McCully et al. 2018), and aperture and differential photometrics were performed using AstroImageJ3 (Collins et al. 2017).
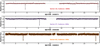 |
Fig. 2 TESS PDC-SAP flux of TOI-6508 extracted from full frame images (FFIs). The target was observed in Sectors 10 (top) at a 1800-second cadence, 37 (middle) at 600-second cadence, and 63 (bottom) at a 200-second cadence. The solid line is the best-fitting model of the transit. |
Observational log for TOI-6508 b: telescope, date of the observation, filter, exposure time(s), and FWHM of the point-spread function and photometric aperture are tabulated.
2.3 Spectroscopic observation for TOI-6508
2.3.1 NIRPS observation
TOI-6508 was observed with the Near-InfraRed Planet Searcher (NIRPS; Bouchy et al. 2017; Wildi et al. 2022) spectrograph installed on the ESO-3.6m telescope at La Silla observatory in Chile. NIRPS is fiber-fed, stabilized high-resolution (R ≈ 70 000) echelle spectrograph operating in the near-infrared covering the range from 950 nm to 1800 nm, under an adaptive optics system. The observations were carried out as a DDT program (ID:113.27QV, Cycle: 113, PI: K. Barkaoui). Over three individual nights, we collected two spectra of TOI-6508 per night with NIRPS with an exposure time of 900 s. The data were collected on June 1 and 9 and July 3, 2024 with an average signal-to-noise-ratio (S/R) of 12 at 1.6 µm.
The NIRPS data were reduced with the nominal pipeline for NIRPS data reduction for the ESO science archive through the VLT Data Flow System4. This pipeline is based on the publicly available ESPRESSO pipeline, which utilizes recipes adapted from software originally developed for the ESPRESSO instrument (Pepe et al. 2021) and specifically refined for near-infrared spectroscopy5 (Artigau et al. 2024).
Radial-velocities were extracted using a cross-correlation with the line-mask for M4-type stars, which is implemented in the NIRPS pipeline. Due to the relatively low S/R we only use orders between 1.4–1.87 µm. The RV measurements are presented in Table 3.
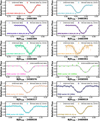 |
Fig. 3 Individual TESS (Sectors 10, 37 and 63) and ground-based (collected with SPECULOOS-S-1.0m and LCOGT-1.0m) light curves of TOI-6508 b. The colored data points show the relative flux measurements (unbinned and binned data). The black solid lines show the best-fitting transit model. |
2.3.2 Shane/Kast optical spectroscopy
We observed TOI-6508 with the Kast double spectrograph (Miller & Stone 1994) mounted on the Lick Observatory Shane 3-m Telescope on UTC April 2024. Conditions were clear and windy with 1.″8 at the southern declination of the source. We used the 2.″ 5 (6 pixel) aligned with the parallactic angle and the 600/7500 grating in the Kast red channel to acquire 5800–9000 Å spectra at a resolution of λ/∆λ ≈ 900. Two exposures of 1200 s each were acquired at an average airmass of 3.08, followed by the observation of the nearby G2 V star HD 113207 (V = 7.62) at a similar airmass. The flux standard Feige 34 (V = 7.6; Massey & Gronwall 1990; Oke 1990) was observed earlier in the night. HeNeAr arclamps, quartz flat-field lamps, and bias frames were obtained at the start of the night for wavelength and pixel-response calibration. Data were reduced using kastredux6 following standard procedures for optical spectroscopic data reduction (see Barkaoui et al. 2024). Our final spectrum has an S/N of 76 at λ ≈ 7500 Å.
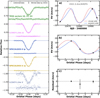 |
Fig. 4 Photometric and radial-velocity observations for TOI-6508. Left: TESS and ground-based, phase-folded light curves (unbinned and binned by 15-min data) of TOI-6508 b. The light curves are shifted along the y-axis for visibility. The residuals are also presented bellow each light curve. Right: radial-velocity measurements collected by the NIRPS spectrograph. RV observations versus time (a), phase-folded RV measurements (b) and RV residuals (O – C) (c). The red data points and solid red line show RV measurements and best fit assuming a circular orbit. The blue data points and solid blue line show RV measurements and best fit assuming an eccentric orbit. |
RV measurements for TOI-6508 obtained with the NIRPS spectrograph.
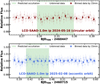 |
Fig. 5 Secondary eclipse observations of TOI-6508 b from LCO- SAAO-1.0m in the Sloan-i′. Top panel shows the data collected on UTC May 16, 2024 assuming a circular orbit and bottom panel shows the data collected on UTC Feb 8, 2025 assuming an eccentric orbit (e = 0.28 constrained from our global MCMC analysis). No significant secondary eclipse is observed. The green region shows the predicted secondary eclipse ingress and egress. |
2.3.3 IRTF/SpeX spectroscopy
We collected a medium-resolution near-infrared spectrum of TOI-6508 on 10 May 2024 (UT) using the SpeX spectrograph (Rayner et al. 2003) on the 3.2-m NASA Infrared Telescope Facility (IRTF) with clear conditions and 0′.′5 seeing. We used the short-wavelength cross-dispersed (SXD) mode and the 0′.′3 × 15″ slit aligned to the parallactic angle, yielding R≈2000 spectra covering 0.80–2.42 µm. We collected 12 integrations of 300 s on the target, nodding in an ABBA pattern. Afterwards, we gathered a set of standard SXD flat-field and arc-lamp calibrations and six 30-s integrations of the A0V standard HD 100330. We reduced the data with Spextool v4.1 (Cushing et al. 2004) following the standard approach (e.g., Delrez et al. 2022; Barkaoui et al. 2023, 2024). The reduced spectrum has a median S/N of 107 per pixel and 2.5 pixels per resolution element.
2.3.4 High-resolution imaging
As part of the validation and confirmation process for a transiting exoplanet observation, high-resolution imaging is one of the critical assets required. The presence of a close companion star, whether truly bound or a line-of-sight star, will provide “third- light” contamination of the observed transit, leading to derived properties for the exoplanet and host star that are incorrect (Ciardi et al. 2015; Furlan & Howell 2017; Furlan & Howell 2020). In addition, it has been shown that the presence of a close companion dilutes small planet transits (<1.2 R⊕) to the point of non-detection (Lester et al. 2021). Given that nearly one- half of FGK stars are in binary or multiple star systems (Matson et al. 2018) high-resolution imaging yields information crucial to our understanding of each discovered exoplanet as well as more global information on its formation, dynamics, and evolution.
TOI-6508 was observed on UTC 10 January 2025 using the Zorro speckle instrument on Gemini South (Scott et al. 2021). Zorro provides simultaneous speckle imaging in two bands (562 nm and 832 nm) with output data products including a reconstructed image and robust contrast limits on companion detections. Nine sets of 1000 60-ms frames were obtained for TOI-6508 simultaneously in each channel. The data waere reduced using our standard software pipeline (Howell et al. 2011). Figure 6 shows the five-sigma-magnitude contrast curves obtained and our 832-nm reconstructed speckle image. We find that TOI-6508 is a single star with no close companion brighter than about 5-6 magnitudes from the diffraction limit (0.02″) out to 1.2″. At the distance to TOI-6508 (d = 48.5 pc) TOI-700, these angular limits correspond to spatial limits of 0.97 to 58 au.
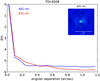 |
Fig. 6 High-resolution imaging for TOI-6508 with 5σ magnitude contrast curves in both filters as a function of the angular separation out to 1.2″ . The inset shows the reconstructed 832 nm image of TOI-6508 with a 1″ scale bar. TOI-6508 was found to have no close companions from the diffraction limit (0.02″) out to 1.2″ to within the contrast levels achieved. |
3 Stellar properties for TOI-6508
3.1 Shane/Kast
Figure 7 shows the Kast optical spectrum of TOI-6508. Characteristic spectral features for mid-to-late M dwarfs are present, including CaH, TiO, and VO molecular features and line absorption from Na I, K I, and Ca II. The spectrum is an excellent match to the M6 SDSS spectral template data from Bochanski et al. (2007), implying an optical classification of M6±1. Hα is seen in clear emission with an equivalent width of −2.95±0.18 Å, which corresponds to a relative emission luminosity of log10 LHα /Lbol = −4.36±0.10 using the χ-factor calibration of Douglas et al. (2014). The presence of magnetic emission is consistent with an activity age of ≲7 Gyr (West et al. 2008; Rebassa-Mansergas et al. 2023). The relative strength of TiO and CaH absorption in the 7000 Å region yields a ζ value of 0.85±0.02 (Lépine et al. 2013), near the boundary between dwarf and subdwarf classes, and the Mann et al. (2013) metallicity-ζ relation yields [Fe/H]= −0.17±0.20.
3.2 IRTF/SpeX
Figure 8 shows the SpeX SXD spectrum of TOI-6508. Following previous SpeX analyses (e.g., Triaud et al. 2023; Gillon et al. 2024; Timmermans et al. 2024), we used the SpeX Prism Library Analysis Toolkit (SPLAT, Burgasser & Splat Development Team 2017) to assign a spectral type and estimate a stellar metal- licity. We compared the spectrum to those of single-star spectral standards in the IRTF spectral library (Cushing et al. 2005; Rayner et al. 2009). Finding the best match to the M5 dwarf Wolf 47, we adopted an infrared spectral type of M5.0 ± 0.5, which is slightly earlier than but consistent with the optical classification. Using the H2O-K2 index (Rojas-Ayala et al. 2012) and Mann et al. (2014) relation, we estimated a sub-solar stellar iron abundance of [Fe/H] = −0.22 ± 0.08 for TOI-6508, which is consistent with the optical metallicity.
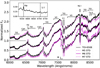 |
Fig. 7 Kast spectrum of TOI-6508 (black lines) compared to M5, M6, and M7 standards from Bochanski et al. (2007) (magenta lines). All spectra are normalized at 7500 Å and for clarity (zero points are indicated by dashed lines). Key atomic and molecular spectral features are labeled, as are regions of strong telluric absorption (⊕). The inset box highlights the 6520–6770 Å region containing the Hα emission (detected) and Li I absorption lines (absent). |
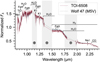 |
Fig. 8 SpeX SXD spectrum of TOI-6508 (red) alongside spectrum of M5 dwarf Wolf 47 (gray) for comparison. Atomic and molecular features of M dwarfs are annotated, and regions of strong telluric absorption are shaded. |
3.3 SED analysis
As an independent determination of the basic stellar parameters, we performed an analysis of the broadband spectral energy distribution (SED) of the star together with the Gaia DR3 parallax (with no systematic offset applied; see, e.g., Stassun & Torres 2021), as described in Stassun & Torres (2016); Stassun et al. (2017, 2018a). We used the 2MASS JHKS magnitudes, WISE W1-W3, and the Gaia GBPGRP magnitudes. Together, the available photometry spans the full stellar SED over the wavelength range 0.4–10 µm (see Figure 9).
We performed a fit using PHOENIX stellar atmosphere models (Husser et al. 2013), with the free parameter being the effective temperature (Teff) and extinction AV which we limited to maximum line-of-sight value from the Galactic dust maps of Schlegel et al. (1998); we used the metallicity ([Fe/H]) value derived from spectroscopic observations (see Sections 3.1 and 3.2). The resulting fit (Figure 9) has a best-fit AV = 0.1 ± 0.1 and Teff = 2930 ± 70 K, with a reduced χ2 of 3.8. Integrating the (unreddened) model SED gives the bolometric flux at Earth, Fbol = 4.48 ± 0.21 × 10⁻¹¹ erg s−1 cm−2. Taking the Fbol and Gaia parallax gives the stellar bolometric luminosity, Lbol = 0.00327 ± 0.00015 L⊙, directly. The stellar radius follows from the Stefan-Boltzmann relation, giving R★ = 0.222 ± 0.013 R⊙. In addition, we estimated the stellar mass from the empirical MK relations of Mann et al. (2019), giving M★ = 0.20 ± 0.01 M⊙. Finally, we used the measured chromospheric activity log Hα/ log Lbol with the empirical relations from Stassun et al. (2012) to predict the degree of radius inflation, which in this case is predicted to be ≈7%, roughly consistent with the apparent inflation of ~10%.
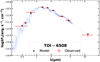 |
Fig. 9 SED fit of TOI-6508. The red symbols with error bars are the observed fluxes, and black dots are the PHOENIX model fluxes. The best-fitting NextGen atmosphere model is presented in blue. |
3.4 Archival imaging for TOI-6508
We used the archival images of TOI-6508 to exclude the possibility that there are background stars blended with the target at its current position. TOI-6508 has a high proper motion of 414 mas/yr. We used the POSS-I/red data taken in 1958, and the LCO-SAAO-1.0m/Sloan-i′ data taken in 2024, spanning 72 years with our new observations. The target has been shifted by 27′.′40 from 1958 to 2024. There is no bright background source in the current day position of the target (see Figure 10).
3.5 Stellar rotation
We searched for photometric modulation in TESS observations using the TESS-SIP (Hedges et al. 2020) package. TESS-SIP returns two outputs simulteneousely, which are a Lomb--Scargle periodogram (Lomb 1976; Scargle 1982) and detrend systematics. In our case, we used the available TESS photometric data from Sectors 10, 37 and 63. We limited our search to a rotation period range of 1–50 days. Our results showed no indications of stellar modulation in the TESS data of TOI-6508 (see Figure 11). This implies that the rotational periods of the target star are probably longer than the TESS observation window for a single sector.
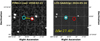 |
Fig. 10 Evolution of TOI-6508’s position over time. Left panel shows archival image of TOI-6508 taken using a photographic plate on the Palomar Schmidt Telescope in the red filter. Right panel shows the Sloan-i0 image from LCO-SAAO-1.0m taken in 2024. |
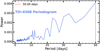 |
Fig. 11 TESS systematics-insensitive periodogram (TESS-SIP) of TOI-6508 using the TESS data from Sectors 10, 37 and 63 (blue line). |
4 Photometric and RV analysis
We performed a global modeling of transit light curves obtained from the TESS mission (described Section 2.1) and the SPECULOOS-South-1.0m and LCO-SAAO-1.0m telescopes (described in Section 2.2), together with the radial velocity measurements collected by the ESO-3.6m/NIRPS spectrograph (described in Section 2.3.1), using the Metropolis-Hastings (Metropolis et al. 1953; Hastings 1970) method implemented in TRAFIT, a revised version of the Markov chain Monte Carlo (MCMC) code described in Gillon et al. (2010, 2012, 2014). We followed the same strategy as described in Barkaoui et al. (2023, 2024). The photometric data were modeled using the Mandel & Agol (2002) quadratic limb-darkening model, multiplied by a transit baseline, in order to correct for external systematic effects related to the time and FWHM of the PSF as well as the airmass, and background light level. The radial-velocity data were modeled with the two-body Keplerian model (Murray & Correia 2010).
The baseline model for each transit was selected by minimizing the Bayesian information criterion (BIC; Schwarz (1978)). The error bars of the TOI-6508 radial-velocity measurements were quadratically rescaled using the “jitter” noise, while the photometric error bars were rescaled using the correction factor CF = βw × βr, where βr is the red noise and βw is the white noise (Gillon et al. 2012).
For the joint fit, the global free parameters for transit modeling are the mid-transit time at a reference epoch (T0), the orbital period (P), the transit depth (dF), the impact parameter (b), the stellar density ρ★ , and the total transit duration (W). We applied a Gaussian prior distribution to the stellar quadratic limb-darkening coefficients (u1 and u2), stellar mass M★, radius R★, and effective temperature Teff (computed from SED analysis), as well as the stellar atmospheric parameters computed from a spectroscopic analysis (metallicity Teff and surface gravity log g★). The quadratic limb-darkening coefficients u1 and u2 for the TESS, Pan-STARRS-zs , Sloan-i′ , Sloan-r′ , and Johnson-V filters were computed using the stellar parameters (Teff, [Fe/H] and log g★) and tables from Claret et al. (2012) and Claret (2018). During our analysis, we converted the quadratic limb-darkening coefficients u1 and u2 into the combination q1 = (u1 + u2)2 and q2 = 0.5u1(u1 + u2)−1 proposed by Kipping 2013.
We performed two MCMC fits. The first fit assumed an eccentric-orbit (i.e. free eccentricity) and the second assumed a perfectly circular orbit (i.e., e = 0). Our results favored an eccentric orbit solution based on the Bayes factor BC = exp (−ΔBIC/2) > 1000. For each transit, a preliminary analysis was performed composed of one Markov chain with 5 × 10⁵ steps to compute the CF (correction factor; Gillon et al. 2012). Then, we performed a final MCMC fit composed of five Markov chains with one million steps to infer the physical properties of the system. The convergence for each Markov chain was checked based on the Gelman & Rubin (1992) statistical test. Our final results for the eccentric orbit solution are presented in Table 5.
5 Discussion and conclusion
Transiting BDs around M dwarf stars are rare, and they are helpful for understanding the formation and evolution of such systems. Only ~10 M dwarf and BD systems are known, and more detections are required to probe the formation and evolution paths.
In this paper, we present a BD orbiting a low-mass star, TOI-6508 b. The target was observed with the TESS mission during Sectors 10, 37 and 73 with long cadences of 1800 s, 600 s and 200 s, respectively (Section 2.1). The candidate was first identified by TESS. Ground-based photometric follow-up observations were performed with the SPECULOOS-South- 1.0m and LCOGT-McD-1.0m telescopes (Section 2.2). Radialvelocity measurements were collected using the NIRPS spectrograph as described in Section 2.3.1. The host star was characterized by combining optical spectra collected by the IRTF/SpeX and Shane/Kast instruments, the spectral energy distribution (SED), and stellar evolutionary models (Section 3). TOI-6508 is a Kmag = 11.5 M5.5 sub-solar star with metallicity of [Fe/H] = −0.22 ± 0.08, a mass of M★ = 0.174 ± 0.004 M⊙, a radius of R★ = 0.205 ± 0.006 R⊙ and an effective temperature of Teff = 2930 ± 70 K.
We performed a global analysis of the TESS observations together with ground-based photometric and radial-velocity observations in order to derive the physical parameters of the system (Section 4). Table 4 shows the stellar physical characteristics of the host star TOI-6508. The derived physical parameters of the system are presented in Table 5. The posterior distribution parameters of TOI-6508 b are presented in Figure B.1. We find that TOI-6508 b is a massive brown dwarf with a mass of  MJup and a radius of
  RJup . It is the second-highest-mass-ratio BD transiting a low-mass star.
During our modeling, we performed two MCMC fits: the first assuming a circular orbit and the second assuming an eccentric orbit. The best solution is compatible with an eccentric orbit based on the Bayes factor BC. TOI-6508 b orbits its host star with an orbital period of  days and an eccentricity of
  . Figure 12 shows the posterior probability distribution of the orbital eccentricity and the mass of TOI-6508 b, including the evolutionary models from Baraffe et al. (2003). Additional observations of radial velocity are required to improve the orbital eccentricity and mass measurements of TOI-6508 b (see Figure 13). Figure 14 presents the mass ratio MBD/M★ as a function of the BD mass. TOI-6508 b has the second highest mass ratio among all known transiting BDs.
The surface gravity of the transiting BDs, gBD , can be derived directly from the transit observations and radial-velocity measurements, and is given by
 (1)
(1)
where, the semi-amplitude KRV and the orbital eccentricity e are derived from the radial-velocity fit. The orbital period P, the scaled BD radius rBD = a/RBD , and the orbital inclination i are derived from the fit of transit light curves. The BD’s surface gravity is directly related to the observable parameters independent of those of the host star.
Figure 15 presents the radius-mass diagram for all known transiting objects with masses ranging between 10 and 120 MJup. Figure 16 presents the surface gravity as a function of the mass of known transiting objects. Table A.1 shows the updated list of transiting BDs from Carmichael (2022) and Henderson et al. (2024). Some new objects have been included from Vowell et al. (2025). As a preliminary comparison, TOI-6508 b is well placed within the edge of the brown-dwarf regime (Baraffe et al. 2002). We also present the tabulated isochrone models for sub-stellar objects derived by Baraffe et al. (2003) (colored solid lines), and different ages of 0.1, 0.5, 1, 5, and 10 Gyr7.
TOI-6508 b shows a deeper primary eclipse of 250 ppt (parts per thousand), but no detectable secondary eclipse. This implies that the secondary component has a lower surface brightness than the primary component. Phase-folded TESS observations are shown in Figure 17. The absence of a detectable secondary eclipse in the data suggested that the companion is a brown dwarf. Based on TESS data, we might rule out a secondary eclipse of δoccult ≈ 10 ppt. We observed two full occultations of TOI-6508 b from LCO-SAAO-1m0 in the Sloan-i′ on UTC May 16, 2024 (assuming a circular orbit) and UTC Feb 8. 2025 (assuming an eccentric orbit of e = 0.28 constrained from our global MCMC analysis). Based on these observations, we might rule out a secondary eclipse of δoccult ≈ 3 ppt (see Figure 5). Moreover, the effective temperature TBD for the companion can be computed by combining the companion and the stellar-radius ratio RBD /R★ with the Planck function for blackbody via the following formula:
 (2)
(2)
where BBD(λ, TBD) and B★(λ, Teff) are the Planck distribution functions for the companion and host star, respectively. This resulted in an effective temperature of the companion of TBD < 1800 K, which is indicative of a brown dwarf. Since the luminosity of a BD is mainly emitted at infrared wavelengths, the secondary eclipse should be deeper when observed at infrared wavelengths. Moreover, a new observation in the infrared is required to confirm or rule out the secondary eclipse of the companion. If a secondary eclipse is present, this will allow an independent determination of the effective temperature of the brown dwarf TOI-6508 b. Moreover, the combination of the low mass and low luminosity of the host star and the low incidental flux of the companion, make TOI-6508 b a favorable target for upcoming secondary-eclipse observations with the JWST in order to measure its luminosity, its Albedo, and its effective temperature.
Astrometry, photometry, and spectroscopy stellar properties of TOI-6508.
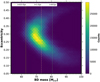 |
Fig. 12 Posterior probability distribution of eccentricity and mass of TOI-6508 b. Vertical colored lines show the evolutionary models from Baraffe et al. (2003). |
Derived physical parameters of the TOI-6508 b system with 1-σ for the eccentric orbit solution.
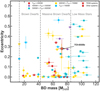 |
Fig. 13 Eccentricity as function of the mass of transiting BDs from Table A.1. The color of each point indicates the effective temperature of the host star. TESS BD systems are highlighted by the stars, and other systems are shown by dots. TOI-6508 b is highlighted by the black circle. |
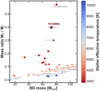 |
Fig. 14 Comparison of TOI-6508 b to other transiting BD systems from Table A.1. TOI-6508 b has the second highest mass ratio transiting BD after ZTF J2020+5033 (El-Badry et al. 2023). Dots are colored according to the stellar effective temperature. |
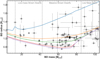 |
Fig. 15 Radius against mass of transiting BDs from Table A.1. The solid colored lines indicate the evolutionary models from Baraffe et al. (2003) with different ages from 0.1 to 10 Gyr. TOI-6508 b is highlighted by the black dot with error bars. |
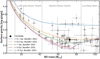 |
Fig. 16 Surface gravity measurements log gBD as function of mass of transiting BDs from Table A.1. The solid colored lines indicate the evolutionary models from Baraffe et al. (2003) with different ages from 0.1 to 10 Gyr. TOI-6508 b is highlighted by the black dot with error bars. |
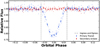 |
Fig. 17 TESS PDC-SAP flux of TOI-6508 extracted from the full frame images (FFIs). The blue data points show the TESS folded-phased transit light curves of TOI-650b b. While, the red data points show the TESS folded-phased secondary eclipse light curves assuming an eccentricity of e = 0.28 (constrained from our global MCMC analysis). Based on the TESS data, we might rule out a secondary eclipse of δoccult ≈ 10 ppt. |
Acknowledgements
The postdoctoral fellowship of KB is funded by F.R.S.- FNRS grant T.0109.20 and by the Francqui Foundation. This publication benefits from the support of the French Community of Belgium in the context of the FRIA Doctoral Grant awarded to MT. MG is F.R.S.-FNRS Research Director. Author F.J.P acknowledges financial support from the Severo Ochoa grant CEX2021-001131-S funded by MCIN/AEI/10.13039/501100011033 and Ministe- rio de Ciencia e Innovación through the project PID2022-137241NB-C43. This material is based upon work supported by the National Aeronautics and Space Administration under Agreement No. 80NSSC21K0593 for the program “Alien Earths”. The results reported herein benefited from collaborations and/or information exchange within NASA’s Nexus for Exoplanet System Science (NExSS) research coordination network sponsored by NASA’s Science Mission Directorate. Based on observations collected at the European Southern Observatory under ESO programme 113.27QV.001. Visiting Astronomer at the Infrared Telescope Facility, which is operated by the University of Hawaii under contract 80HQTR24DA010 with the National Aeronautics and Space Administration. Funding for the TESS mission is provided by NASA’s Science Mission Directorate. KAC acknowledges support from the TESS mission via subaward s3449 from MIT. This paper made use of data collected by the TESS mission, obtained from the Mikulski Archive for Space Telescopes MAST data archive at the Space Telescope Science Institute (STScI). Funding for the TESS mission is provided by the NASA Explorer Program. STScI is operated by the Association of Universities for Research in Astronomy, Inc., under NASA contract NAS 5–26555. We acknowledge the use of public TESS data from pipelines at the TESS Science Office and at the TESS Science Processing Operations Center. Resources supporting this work were provided by the NASA High-End Computing (HEC) Program through the NASA Advanced Supercomputing (NAS) Division at Ames Research Center for the production of the SPOC data products. This research has made use of the Exoplanet Follow-up Observation Program (ExoFOP; DOI: 10.26134/ExoFOP5) website, which is operated by the California Institute of Technology, under contract with the National Aeronautics and Space Administration under the Exoplanet Exploration Program. Based on data collected by the SPECULOOS-South Observatory at the ESO Paranal Observatory in Chile. The ULiege’s contribution to SPECULOOS has received funding from the European Research Council under the European Union’s Seventh Framework Programme (FP/2007-2013) (grant Agreement n° 336480/SPECULOOS), from the Balzan Prize and Francqui Foundations, from the Belgian Scientific Research Foundation (F.R.S.-FNRS; grant n° T.0109.20), from the University of Liege, and from the ARC grant for Concerted Research Actions financed by the Wallonia-Brussels Federation. The Birmingham contribution is in part funded by the European Union’s Horizon 2020 research and innovation programme (grant’s agreement n° 803193/BEBOP), and from the Science and Technology Facilities Council (STFC; grant nos. ST/S00193X/1, ST/W000385/1 and ST/Y001710/1). The Cambridge contribution is supported by a grant from the Simons Foundation (PI Queloz, grant number 327127). This work makes use of observations from the LCOGT network. Part of the LCOGT telescope time was granted by NOIRLab through the Mid-Scale Innovations Program (MSIP). MSIP is funded by NSF. Some of the observations in this paper made use of the High-Resolution Imaging instrument Zorro and were obtained under Gemini LLP Proposal Number: GN/S-2021A-LP-105. Zorro was funded by the NASA Exoplanet Exploration Program and built at the NASA Ames Research Center by Steve B. Howell, Nic Scott, Elliott P. Horch, and Emmett Quigley. Zorro was mounted on the Gemini South telescope of the international Gemini Observatory, a program of NSF’s OIR Lab, which is managed by the Association of Universities for Research in Astronomy (AURA) under a cooperative agreement with the National Science Foundation. on behalf of the Gemini partnership: the National Science Foundation (United States), National Research Council (Canada), Agencia Nacional de Investigación y Desarrollo (Chile), Ministerio de Ciencia, Tecnología e Innovación (Argentina), Ministério da Ciência, Tec- nologia, Inovações e Comunicações (Brazil), and Korea Astronomy and Space Science Institute (Republic of Korea).
Appendix A List of published transiting BDs
List of published transiting BDs adapted and updated from Carmichael (2022) and Henderson et al. (2024). Some new objects have been included from Vowell et al. (2025).
Appendix B Posterior probability distribution for the system TOI-6508.
 |
Fig. B.1 Posterior probability distribution for the TOI-6508 system parameters derived from our global MCMC analysis. The median value for each parameter is represented by the vertical dashed lines. |
References
- Acton, J. S., Goad, M. R., Burleigh, M. R., et al. 2021, MNRAS, 505, 2741 [NASA ADS] [CrossRef] [Google Scholar]
- Aller, A., Lillo-Box, J., Jones, D., Miranda, L. F., & Barceló Forteza, S. 2020, A&A, 635, A128 [NASA ADS] [CrossRef] [EDP Sciences] [Google Scholar]
- Artigau, É., Hébrard, G., Cadieux, C., et al. 2021, AJ, 162, 144 [NASA ADS] [CrossRef] [Google Scholar]
- Artigau, É., Bouchy, F., Doyon, R., et al. 2024, in Ground-based and Airborne Instrumentation for Astronomy X, 13096, eds. J. J. Bryant, K. Motohara, & J. R. D. Vernet, International Society for Optics and Photonics (SPIE), 130960C [Google Scholar]
- Baraffe, I., Chabrier, G., Allard, F., & Hauschildt, P. H. 2002, A&A, 382, 563 [CrossRef] [EDP Sciences] [Google Scholar]
- Baraffe, I., Chabrier, G., Barman, T. S., Allard, F., & Hauschildt, P. H. 2003, A&A, 402, 701 [NASA ADS] [CrossRef] [EDP Sciences] [Google Scholar]
- Barkaoui, K., Timmermans, M., Soubkiou, A., et al. 2023, A&A, 677, A38 [NASA ADS] [CrossRef] [EDP Sciences] [Google Scholar]
- Barkaoui, K., Schwarz, R. P., Narita, N., et al. 2024, A&A, 687, A264 [NASA ADS] [CrossRef] [EDP Sciences] [Google Scholar]
- Bayliss, D., Hojjatpanah, S., Santerne, A., et al. 2017, AJ, 153, 15 [Google Scholar]
- Benni, P., Burdanov, A. Y., Krushinsky, V. V., et al. 2021, MNRAS, 505, 4956 [Google Scholar]
- Bochanski, J. J., West, A. A., Hawley, S. L., & Covey, K. R. 2007, AJ, 133, 531 [NASA ADS] [CrossRef] [Google Scholar]
- Bonomo, A. S., Sozzetti, A., Santerne, A., et al. 2015, A&A, 575, A85 [NASA ADS] [CrossRef] [EDP Sciences] [Google Scholar]
- Bouchy, F., Deleuil, M., Guillot, T., et al. 2011, A&A, 525, A68 [NASA ADS] [CrossRef] [EDP Sciences] [Google Scholar]
- Bouchy, F., Doyon, R., Artigau, É., et al. 2017, The Messenger, 169, 21 [NASA ADS] [Google Scholar]
- Brown, T. M., Baliber, N., Bianco, F. B., et al. 2013, PASP, 125, 1031 [Google Scholar]
- Burgasser, A. J., & Splat Development Team 2017, in Astronomical Society of India Conference Series, 14, 7 [NASA ADS] [Google Scholar]
- Burn, R., Schlecker, M., Mordasini, C., et al. 2021, A&A, 656, A72 [NASA ADS] [CrossRef] [EDP Sciences] [Google Scholar]
- Cañas, C. I., Bender, C. F., Mahadevan, S., et al. 2018, ApJ, 861, L4 [Google Scholar]
- Carmichael, T. W. 2022, MNRAS, 519, 5177 [NASA ADS] [Google Scholar]
- Carmichael, T. W., Latham, D. W., & Vanderburg, A. M. 2019, AJ, 158, 38 [NASA ADS] [CrossRef] [Google Scholar]
- Carmichael, T. W., Quinn, S. N., Mustill, A. J., et al. 2020, AJ, 160, 53 [Google Scholar]
- Carmichael, T. W., Quinn, S. N., Zhou, G., et al. 2021, AJ, 161, 97 [Google Scholar]
- Carmichael, T. W., Irwin, J. M., Murgas, F., et al. 2022, MNRAS, 514, 4944 [NASA ADS] [Google Scholar]
- Chabrier, G., Baraffe, I., Phillips, M., & Debras, F. 2023, A&A, 671, A119 [NASA ADS] [CrossRef] [EDP Sciences] [Google Scholar]
- Chaturvedi, P., Chakraborty, A., Anandarao, B. G., Roy, A., & Mahadevan, S. 2016, MNRAS, 462, 554 [Google Scholar]
- Ciardi, D. R., Beichman, C. A., Horch, E. P., & Howell, S. B. 2015, ApJ, 805, 16 [NASA ADS] [CrossRef] [Google Scholar]
- Claret, A. 2018, A&A, 618, A20 [NASA ADS] [CrossRef] [EDP Sciences] [Google Scholar]
- Claret, A., Hauschildt, P. H., & Witte, S. 2012, A&A, 546, A14 [NASA ADS] [CrossRef] [EDP Sciences] [Google Scholar]
- Collins, K. A., Kielkopf, J. F., Stassun, K. G., & Hessman, F. V. 2017, AJ, 153, 77 [Google Scholar]
- Csizmadia, S. 2016, in The CoRoT Legacy Book (EDP Sciences), 143 [Google Scholar]
- Csizmadia, S., Hatzes, A., Gandolfi, D., et al. 2015, A&A, 584, A13 [NASA ADS] [CrossRef] [EDP Sciences] [Google Scholar]
- Cushing, M. C., Vacca, W. D., & Rayner, J. T. 2004, PASP, 116, 362 [NASA ADS] [CrossRef] [Google Scholar]
- Cushing, M. C., Rayner, J. T., & Vacca, W. D. 2005, ApJ, 623, 1115 [Google Scholar]
- Cutri, R. M., Wright, E. L., Conrow, T., et al. 2021, VizieR Online Data Catalog: II/328 [Google Scholar]
- David, T. J., Hillenbrand, L. A., Gillen, E., et al. 2019, ApJ, 872, 161 [Google Scholar]
- Deleuil, M., Deeg, H. J., Alonso, R., et al. 2008, A&A, 491, 889 [CrossRef] [EDP Sciences] [Google Scholar]
- Delrez, L., Gillon, M., Queloz, D., et al. 2018, SPIE Conf. Ser., 10700, 107001I [Google Scholar]
- Delrez, L., Murray, C. A., Pozuelos, F. J., et al. 2022, A&A, 667, A59 [NASA ADS] [CrossRef] [EDP Sciences] [Google Scholar]
- Díaz, R. F., Damiani, C., Deleuil, M., et al. 2013, A&A, 551, L9 [CrossRef] [EDP Sciences] [Google Scholar]
- Díaz, R. F., Montagnier, G., Leconte, J., et al. 2014, A&A, 572, A109 [NASA ADS] [CrossRef] [EDP Sciences] [Google Scholar]
- Douglas, S. T., Agüeros, M. A., Covey, K. R., et al. 2014, ApJ, 795, 161 [NASA ADS] [CrossRef] [Google Scholar]
- El-Badry, K., Burdge, K. B., van Roestel, J., & Rodriguez, A. C. 2023, Open J. Astrophys., 6, 33 [NASA ADS] [Google Scholar]
- Ferreira dos Santos, T., Rice, M., Wang, X.-Y., & Wang, S. 2024, AJ, 168, 145 [Google Scholar]
- Furlan, E., & Howell, S. B. 2017, AJ, 154, 66 [NASA ADS] [CrossRef] [Google Scholar]
- Furlan, E., & Howell, S. B. 2020, ApJ, 898, 47 [NASA ADS] [CrossRef] [Google Scholar]
- Gaia Collaboration (Brown, A. G. A., et al.) 2021, A&A, 650, C3 [EDP Sciences] [Google Scholar]
- Garcia, L. J., Timmermans, M., Pozuelos, F. J., et al. 2022, MNRAS, 509, 4817 [Google Scholar]
- Gelman, A., & Rubin, D. B. 1992, Statist. Sci., 7, 457 [NASA ADS] [Google Scholar]
- Gill, S., Ulmer-Moll, S., Wheatley, P. J., et al. 2022, MNRAS, 513, 1785 [NASA ADS] [CrossRef] [Google Scholar]
- Gillen, E., Hillenbrand, L. A., David, T. J., et al. 2017, ApJ, 849, 11 [Google Scholar]
- Gillon, M., Deming, D., Demory, B. O., et al. 2010, A&A, 518, A25 [Google Scholar]
- Gillon, M., Triaud, A. H. M. J., Fortney, J. J., et al. 2012, A&A, 542, A4 [NASA ADS] [CrossRef] [EDP Sciences] [Google Scholar]
- Gillon, M., Demory, B. O., Madhusudhan, N., et al. 2014, A&A, 563, A21 [NASA ADS] [CrossRef] [EDP Sciences] [Google Scholar]
- Gillon, M., Pedersen, P. P., Rackham, B. V., et al. 2024, Nat. Astron., 8, 865 [Google Scholar]
- Grieves, N., Bouchy, F., Lendl, M., et al. 2021, A&A, 652, A127 [NASA ADS] [CrossRef] [EDP Sciences] [Google Scholar]
- Hastings, W. K. 1970, Biometrika, 57, 97 [Google Scholar]
- Hedges, C., Angus, R., Barentsen, G., et al. 2020, RNAAS, 4, 220 [Google Scholar]
- Henderson, B. A., Casewell, S. L., Goad, M. R., et al. 2024, MNRAS, 530, 318 [NASA ADS] [Google Scholar]
- Hodžić, V., Triaud, A. H. M. J., Anderson, D. R., et al. 2018, MNRAS, 481, 5091 [Google Scholar]
- Howell, S. B., Everett, M. E., Sherry, W., Horch, E., & Ciardi, D. R. 2011, AJ, 142, 19 [Google Scholar]
- Husser, T. O., Wende-von Berg, S., Dreizler, S., et al. 2013, A&A, 553, A6 [NASA ADS] [CrossRef] [EDP Sciences] [Google Scholar]
- Irwin, J. M., Charbonneau, D., Esquerdo, G. A., et al. 2018, AJ, 156, 140 [Google Scholar]
- Jackman, J. A. G., Wheatley, P. J., Bayliss, D., et al. 2019, MNRAS, 489, 5146 [Google Scholar]
- Jehin, E., Gillon, M., Queloz, D., et al. 2018, The Messenger, 174, 2 [NASA ADS] [Google Scholar]
- Jenkins, J. M., Twicken, J. D., McCauliff, S., et al. 2016, SPIE Conf. Ser.,. 9913, 99133E [Google Scholar]
- Jensen, E. 2013, Tapir: A web interface for transit/eclipse observability, Astrophysics Source Code Library [record ascl:1306.007] [Google Scholar]
- Johnson, J. A., Apps, K., Gazak, J. Z., et al. 2011, ApJ, 730, 79 [Google Scholar]
- Kanodia, S., Libby-Roberts, J., Cañas, C. I., et al. 2022, AJ, 164, 81 [NASA ADS] [CrossRef] [Google Scholar]
- Khandelwal, A., Sharma, Ri., Chakraborty, A., et al. 2023, A&A, 672, L7 [NASA ADS] [CrossRef] [EDP Sciences] [Google Scholar]
- Kipping, D. M. 2013, MNRAS, 435, 2152 [Google Scholar]
- Lépine, S., Hilton, E. J., Mann, A. W., et al. 2013, AJ, 145, 102 [Google Scholar]
- Lester, K. V., Matson, R. A., Howell, S. B., et al. 2021, AJ, 162, 75 [NASA ADS] [CrossRef] [Google Scholar]
- Lightkurve Collaboration (Cardoso, J. V. D. M., et al.) 2018, Lightkurve: Kepler and TESS time series analysis in Python, Astrophysics Source Code Library [record ascl:1812.013] [Google Scholar]
- Lin, Z., Gan, T., Wang, S. X., et al. 2023, MNRAS, 523, 6162 [NASA ADS] [CrossRef] [Google Scholar]
- Lomb, N. R. 1976, Ap&SS, 39, 447 [Google Scholar]
- Mandel, K., & Agol, E. 2002, ApJ, 580, L171 [Google Scholar]
- Mann, A. W., Brewer, J. M., Gaidos, E., Lépine, S., & Hilton, E. J. 2013, AJ, 145, 52 [Google Scholar]
- Mann, A. W., Deacon, N. R., Gaidos, E., et al. 2014, AJ, 147, 160 [CrossRef] [Google Scholar]
- Mann, A. W., Feiden, G. A., Gaidos, E., Boyajian, T., & von Braun, K. 2015, ApJ, 804, 64 [Google Scholar]
- Mann, A. W., Dupuy, T., Kraus, A. L., et al. 2019, ApJ, 871, 63 [Google Scholar]
- Massey, P., & Gronwall, C. 1990, ApJ, 358, 344 [NASA ADS] [CrossRef] [Google Scholar]
- Matson, R. A., Howell, S. B., Horch, E. P., & Everett, M. E. 2018, AJ, 156, 31 [NASA ADS] [CrossRef] [Google Scholar]
- McCully, C., Volgenau, N. H., Harbeck, D.-R., et al. 2018, SPIE Conf. Ser.,. 10707, 107070K [Google Scholar]
- Metropolis, N., Rosenbluth, A. W., Rosenbluth, M. N., Teller, A. H., & Teller, E. 1953, J. Chem. Phys., 21, 1087 [Google Scholar]
- Miller, J. S., & Stone, R. P. S. 1994, The Kast Double Spectrograph, Tech. Rep. 66, University of California Lick Observatory Technical Reports [Google Scholar]
- Mireles, I., Shporer, A., Grieves, N., et al. 2020, AJ, 160, 133 [Google Scholar]
- Moutou, C., Bonomo, A. S., Bruno, G., et al. 2013, A&A, 558, L6 [NASA ADS] [CrossRef] [EDP Sciences] [Google Scholar]
- Murray, C. D., & Correia, A. C. M. 2010, in Exoplanets, ed. S. Seager (University of Arizona Press), 15 [Google Scholar]
- Nowak, G., Palle, E., Gandolfi, D., et al. 2017, AJ, 153, 131 [Google Scholar]
- Oke, J. B. 1990, AJ, 99, 1621 [Google Scholar]
- Palle, E., Luque, R., Zapatero Osorio, M. R., et al. 2021, A&A, 650, A55 [EDP Sciences] [Google Scholar]
- Parviainen, H., Palle, E., Zapatero-Osorio, M. R., et al. 2020, A&A, 633, A28 [NASA ADS] [CrossRef] [EDP Sciences] [Google Scholar]
- Pepe, F., Cristiani, S., Rebolo, R., et al. 2021, A&A, 645, A96 [NASA ADS] [CrossRef] [EDP Sciences] [Google Scholar]
- Persson, C. M., Csizmadia, S., Mustill, A. J., et al. 2019, A&A, 628, A64 [NASA ADS] [CrossRef] [EDP Sciences] [Google Scholar]
- Phillips, M. W., Tremblin, P., Baraffe, I., et al. 2020, A&A, 637, A38 [NASA ADS] [CrossRef] [EDP Sciences] [Google Scholar]
- Pont, F., Melo, C. H. F., Bouchy, F., et al. 2005, A&A, 433, L21 [NASA ADS] [CrossRef] [EDP Sciences] [Google Scholar]
- Pont, F., Moutou, C., Bouchy, F., et al. 2006, A&A, 447, 1035 [NASA ADS] [CrossRef] [EDP Sciences] [Google Scholar]
- Psaridi, A., Bouchy, F., Lendl, M., et al. 2022, A&A, 664, A94 [NASA ADS] [CrossRef] [EDP Sciences] [Google Scholar]
- Rayner, J. T., Toomey, D. W., Onaka, P. M., et al. 2003, PASP, 115, 362 [NASA ADS] [CrossRef] [Google Scholar]
- Rayner, J. T., Cushing, M. C., & Vacca, W. D. 2009, ApJS, 185, 289 [Google Scholar]
- Rebassa-Mansergas, A., Maldonado, J., Raddi, R., et al. 2023, MNRAS, 526, 4787 [NASA ADS] [CrossRef] [Google Scholar]
- Ricker, G. R., Winn, J. N., Vanderspek, R., et al. 2015, J. Astron. Telesc. Instrum. Syst., 1, 014003 [Google Scholar]
- Rojas-Ayala, B., Covey, K. R., Muirhead, P. S., & Lloyd, J. P. 2012, ApJ, 748, 93 [Google Scholar]
- Saumon, D., & Marley, M. S. 2008, ApJ, 689, 1327 [Google Scholar]
- Scargle, J. D. 1982, ApJ, 263, 835 [Google Scholar]
- Schlegel, D. J., Finkbeiner, D. P., & Davis, M. 1998, ApJ, 500, 525 [Google Scholar]
- Schmidt, S. P., Schlaufman, K. C., Ding, K., et al. 2023, AJ, 166, 225 [NASA ADS] [Google Scholar]
- Schwarz, G. 1978, Ann. Statist., 6, 461 [Google Scholar]
- Scott, N. J., Howell, S. B., Gnilka, C. L., et al. 2021, Front. Astron. Space Sci., 8, 138 [NASA ADS] [CrossRef] [Google Scholar]
- Sebastian, D., Gillon, M., Ducrot, E., et al. 2021, A&A, 645, A100 [EDP Sciences] [Google Scholar]
- Sebastian, D., Guenther, E. W., Deleuil, M., et al. 2022, MNRAS, 516, 636 [NASA ADS] [CrossRef] [Google Scholar]
- Shporer, A., Zhou, G., Vanderburg, A., et al. 2017, ApJ, 847, L18 [Google Scholar]
- Siverd, R. J., Beatty, T. G., Pepper, J., et al. 2012, ApJ, 761, 123 [Google Scholar]
- Skrutskie, M. F., Cutri, R. M., Stiening, R., et al. 2006, AJ, 131, 1163 [NASA ADS] [CrossRef] [Google Scholar]
- Smith, J. C., Stumpe, M. C., Van Cleve, J. E., et al. 2012, PASP, 124, 1000 [Google Scholar]
- Spiegel, D. S., Burrows, A., & Milsom, J. A. 2011, ApJ, 727, 57 [Google Scholar]
- Stassun, K. G., & Torres, G. 2016, AJ, 152, 180 [Google Scholar]
- Stassun, K. G., & Torres, G. 2021, ApJ, 907, L33 [NASA ADS] [CrossRef] [Google Scholar]
- Stassun, K. G., Kratter, K. M., Scholz, A., & Dupuy, T. J. 2012, ApJ, 756, 47 [NASA ADS] [Google Scholar]
- Stassun, K. G., Collins, K. A., & Gaudi, B. S. 2017, AJ, 153, 136 [Google Scholar]
- Stassun, K. G., Corsaro, E., Pepper, J. A., & Gaudi, B. S. 2018a, AJ, 155, 22 [Google Scholar]
- Stassun, K. G., Oelkers, R. J., Pepper, J., et al. 2018b, AJ, 156, 102 [Google Scholar]
- Stumpe, M. C., Smith, J. C., Van Cleve, J. E., et al. 2012, PASP, 124, 985 [Google Scholar]
- Stumpe, M. C., Smith, J. C., Catanzarite, J. H., et al. 2014, PASP, 126, 100 [Google Scholar]
- Šubjak, J., Sharma, R., Carmichael, T. W., et al. 2020, AJ, 159, 151 [Google Scholar]
- Tal-Or, L., Mazeh, T., Alonso, R., et al. 2013, A&A, 553, A30 [NASA ADS] [CrossRef] [EDP Sciences] [Google Scholar]
- Timmermans, M., Dransfield, G., Gillon, M., et al. 2024, A&A, 687, A48 [NASA ADS] [CrossRef] [EDP Sciences] [Google Scholar]
- Triaud, A. H. M. J., Hebb, L., Anderson, D. R., et al. 2013, A&A, 549, A18 [NASA ADS] [CrossRef] [EDP Sciences] [Google Scholar]
- Triaud, A. H. M. J., Dransfield, G., Kagetani, T., et al. 2023, MNRAS, 525, L98 [Google Scholar]
- von Boetticher, A., Triaud, A. H. M. J., Queloz, D., et al. 2017, A&A, 604, L6 [NASA ADS] [CrossRef] [EDP Sciences] [Google Scholar]
- von Boetticher, A., Triaud, A. H. M. J., Queloz, D., et al. 2019, A&A, 625, A150 [NASA ADS] [CrossRef] [EDP Sciences] [Google Scholar]
- Vowell, N., Rodriguez, J. E., Quinn, S. N., et al. 2023, AJ, 165, 268 [NASA ADS] [CrossRef] [Google Scholar]
- Vowell, N., Rodriguez, J. E., Latham, D. W., et al. 2025, arXiv e-prints [arXiv:2501.09795] [Google Scholar]
- West, A. A., Hawley, S. L., Bochanski, J. J., et al. 2008, AJ, 135, 785 [Google Scholar]
- Wildi, F., Bouchy, F., Doyon, R., et al. 2022, SPIE Conf. Ser., 12184, 121841H [NASA ADS] [Google Scholar]
- Zacharias, N., Finch, C. T., Girard, T. M., et al. 2012, VizieR Online Data Catalog: I/322A [Google Scholar]
- Zhou, G., Bakos, G. Á., Bayliss, D., et al. 2019, AJ, 157, 31 [Google Scholar]
AstroImageJ: https://www.astro.louisville.edu/software/astroimagej/
Nirps pipeline: https://www.eso.org/sci/software/pipelines/nirps/nirps-pipe-recipes.html
kastredux: https://github.com/aburgasser/kastredux
Isochrone models: http://perso.ens-lyon.fr/isabelle.baraffe/
All Tables
Observational log for TOI-6508 b: telescope, date of the observation, filter, exposure time(s), and FWHM of the point-spread function and photometric aperture are tabulated.
Derived physical parameters of the TOI-6508 b system with 1-σ for the eccentric orbit solution.
List of published transiting BDs adapted and updated from Carmichael (2022) and Henderson et al. (2024). Some new objects have been included from Vowell et al. (2025).
All Figures
|
Fig. 1 TESS target pixel file images for TOI-6508 observed in Sectors 10 (top), 37 (middle) and 63 (bottom). The plots are made with the tpfplotter (Aller et al. 2020) package. The pixels highlighted in yellow show the TESS apertures. The red dots show the positions of Gaia DR3 sources, and their sizes correspond to their TESS magnitudes. |
| In the text | |
|
Fig. 2 TESS PDC-SAP flux of TOI-6508 extracted from full frame images (FFIs). The target was observed in Sectors 10 (top) at a 1800-second cadence, 37 (middle) at 600-second cadence, and 63 (bottom) at a 200-second cadence. The solid line is the best-fitting model of the transit. |
| In the text | |
|
Fig. 3 Individual TESS (Sectors 10, 37 and 63) and ground-based (collected with SPECULOOS-S-1.0m and LCOGT-1.0m) light curves of TOI-6508 b. The colored data points show the relative flux measurements (unbinned and binned data). The black solid lines show the best-fitting transit model. |
| In the text | |
|
Fig. 4 Photometric and radial-velocity observations for TOI-6508. Left: TESS and ground-based, phase-folded light curves (unbinned and binned by 15-min data) of TOI-6508 b. The light curves are shifted along the y-axis for visibility. The residuals are also presented bellow each light curve. Right: radial-velocity measurements collected by the NIRPS spectrograph. RV observations versus time (a), phase-folded RV measurements (b) and RV residuals (O – C) (c). The red data points and solid red line show RV measurements and best fit assuming a circular orbit. The blue data points and solid blue line show RV measurements and best fit assuming an eccentric orbit. |
| In the text | |
|
Fig. 5 Secondary eclipse observations of TOI-6508 b from LCO- SAAO-1.0m in the Sloan-i′. Top panel shows the data collected on UTC May 16, 2024 assuming a circular orbit and bottom panel shows the data collected on UTC Feb 8, 2025 assuming an eccentric orbit (e = 0.28 constrained from our global MCMC analysis). No significant secondary eclipse is observed. The green region shows the predicted secondary eclipse ingress and egress. |
| In the text | |
|
Fig. 6 High-resolution imaging for TOI-6508 with 5σ magnitude contrast curves in both filters as a function of the angular separation out to 1.2″ . The inset shows the reconstructed 832 nm image of TOI-6508 with a 1″ scale bar. TOI-6508 was found to have no close companions from the diffraction limit (0.02″) out to 1.2″ to within the contrast levels achieved. |
| In the text | |
|
Fig. 7 Kast spectrum of TOI-6508 (black lines) compared to M5, M6, and M7 standards from Bochanski et al. (2007) (magenta lines). All spectra are normalized at 7500 Å and for clarity (zero points are indicated by dashed lines). Key atomic and molecular spectral features are labeled, as are regions of strong telluric absorption (⊕). The inset box highlights the 6520–6770 Å region containing the Hα emission (detected) and Li I absorption lines (absent). |
| In the text | |
|
Fig. 8 SpeX SXD spectrum of TOI-6508 (red) alongside spectrum of M5 dwarf Wolf 47 (gray) for comparison. Atomic and molecular features of M dwarfs are annotated, and regions of strong telluric absorption are shaded. |
| In the text | |
|
Fig. 9 SED fit of TOI-6508. The red symbols with error bars are the observed fluxes, and black dots are the PHOENIX model fluxes. The best-fitting NextGen atmosphere model is presented in blue. |
| In the text | |
|
Fig. 10 Evolution of TOI-6508’s position over time. Left panel shows archival image of TOI-6508 taken using a photographic plate on the Palomar Schmidt Telescope in the red filter. Right panel shows the Sloan-i0 image from LCO-SAAO-1.0m taken in 2024. |
| In the text | |
|
Fig. 11 TESS systematics-insensitive periodogram (TESS-SIP) of TOI-6508 using the TESS data from Sectors 10, 37 and 63 (blue line). |
| In the text | |
|
Fig. 12 Posterior probability distribution of eccentricity and mass of TOI-6508 b. Vertical colored lines show the evolutionary models from Baraffe et al. (2003). |
| In the text | |
|
Fig. 13 Eccentricity as function of the mass of transiting BDs from Table A.1. The color of each point indicates the effective temperature of the host star. TESS BD systems are highlighted by the stars, and other systems are shown by dots. TOI-6508 b is highlighted by the black circle. |
| In the text | |
|
Fig. 14 Comparison of TOI-6508 b to other transiting BD systems from Table A.1. TOI-6508 b has the second highest mass ratio transiting BD after ZTF J2020+5033 (El-Badry et al. 2023). Dots are colored according to the stellar effective temperature. |
| In the text | |
|
Fig. 15 Radius against mass of transiting BDs from Table A.1. The solid colored lines indicate the evolutionary models from Baraffe et al. (2003) with different ages from 0.1 to 10 Gyr. TOI-6508 b is highlighted by the black dot with error bars. |
| In the text | |
|
Fig. 16 Surface gravity measurements log gBD as function of mass of transiting BDs from Table A.1. The solid colored lines indicate the evolutionary models from Baraffe et al. (2003) with different ages from 0.1 to 10 Gyr. TOI-6508 b is highlighted by the black dot with error bars. |
| In the text | |
|
Fig. 17 TESS PDC-SAP flux of TOI-6508 extracted from the full frame images (FFIs). The blue data points show the TESS folded-phased transit light curves of TOI-650b b. While, the red data points show the TESS folded-phased secondary eclipse light curves assuming an eccentricity of e = 0.28 (constrained from our global MCMC analysis). Based on the TESS data, we might rule out a secondary eclipse of δoccult ≈ 10 ppt. |
| In the text | |
|
Fig. B.1 Posterior probability distribution for the TOI-6508 system parameters derived from our global MCMC analysis. The median value for each parameter is represented by the vertical dashed lines. |
| In the text | |
Current usage metrics show cumulative count of Article Views (full-text article views including HTML views, PDF and ePub downloads, according to the available data) and Abstracts Views on Vision4Press platform.
Data correspond to usage on the plateform after 2015. The current usage metrics is available 48-96 hours after online publication and is updated daily on week days.
Initial download of the metrics may take a while.