Fig. 1
Download original image
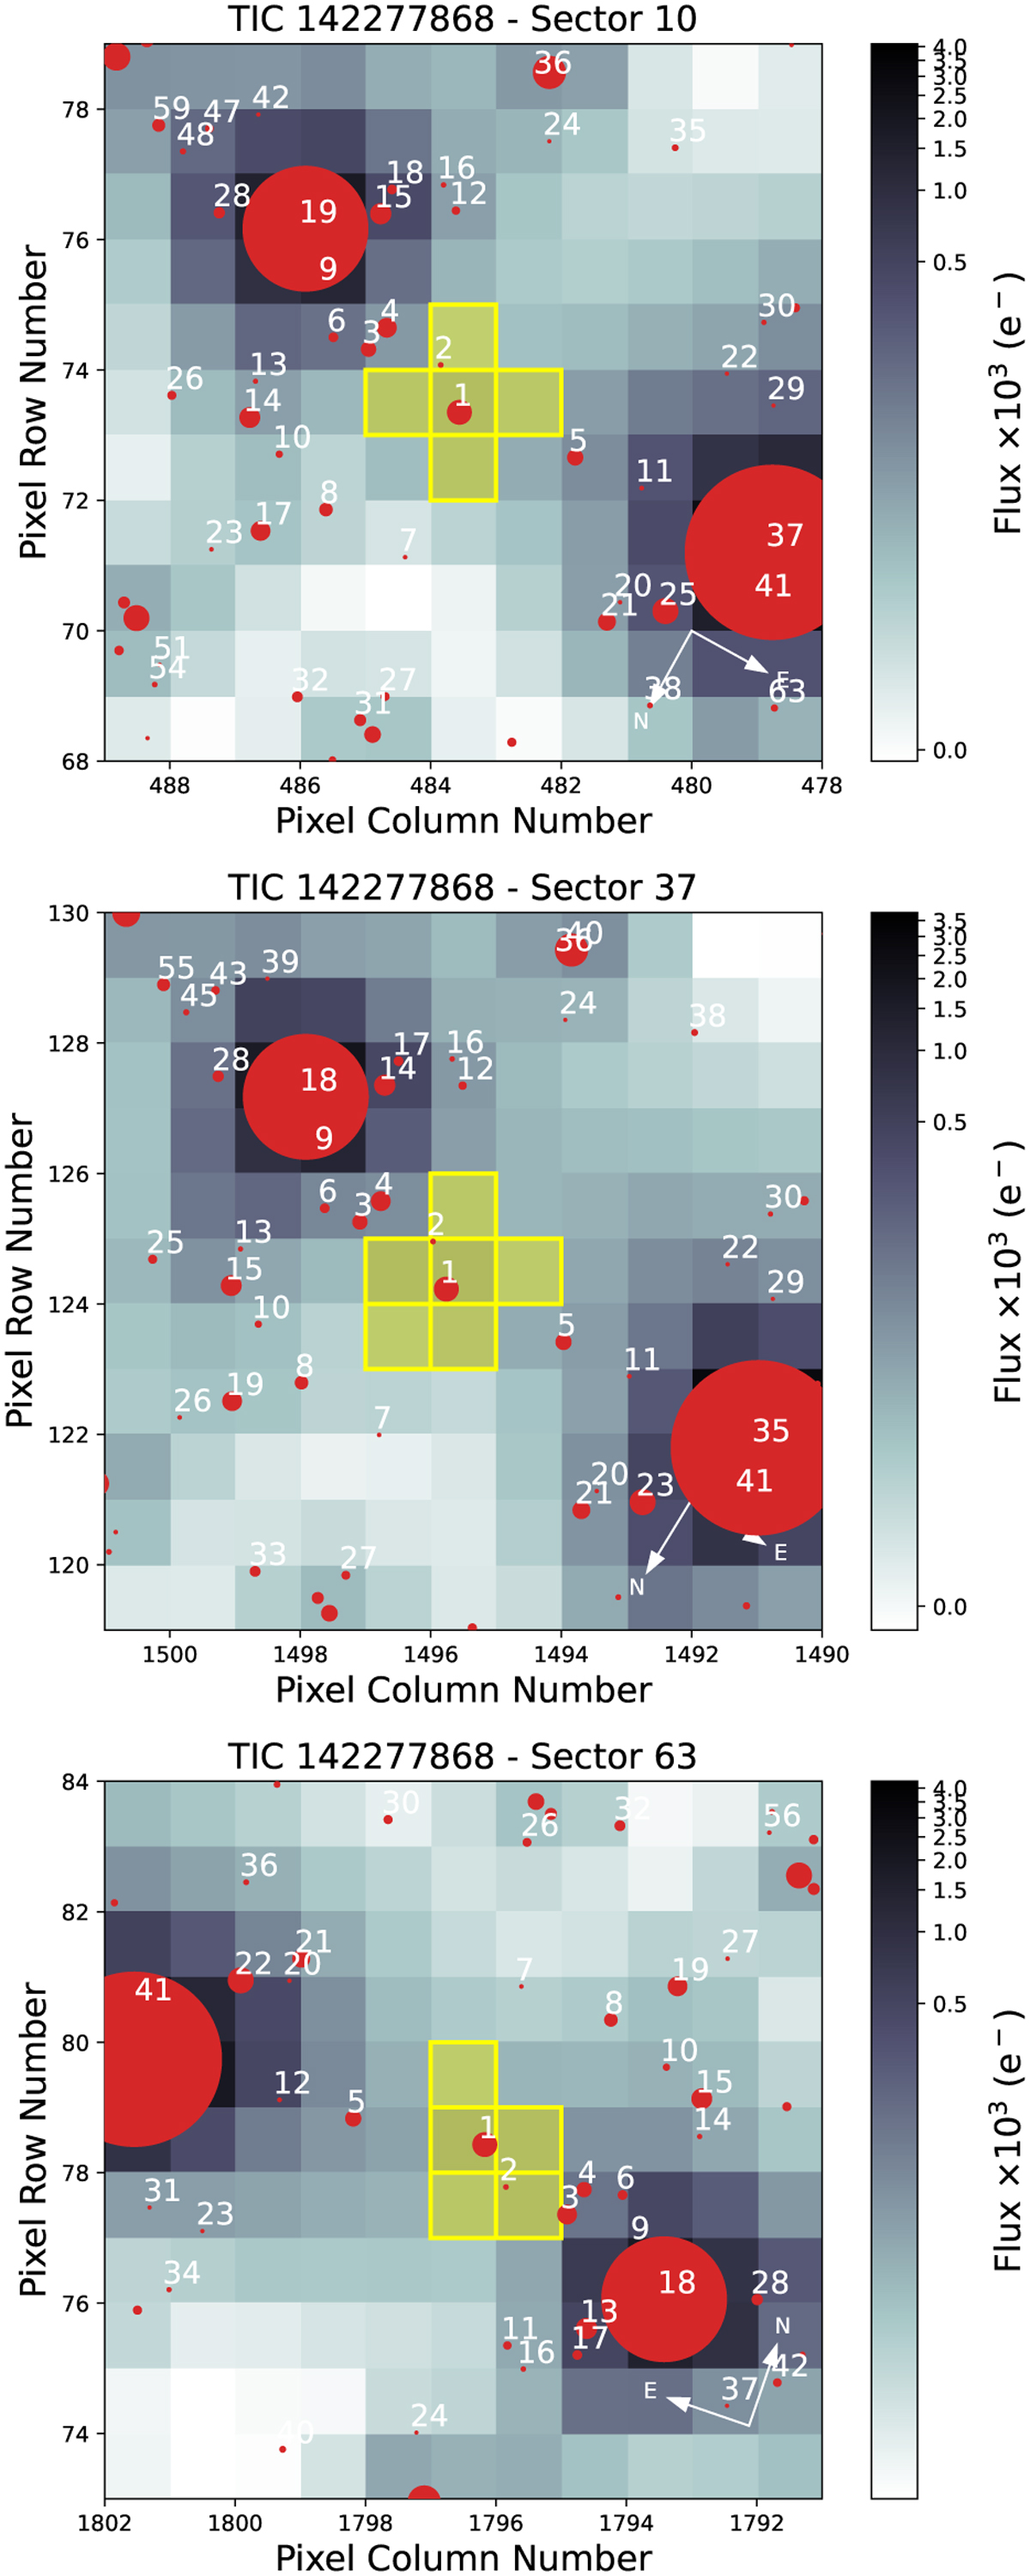
TESS target pixel file images for TOI-6508 observed in Sectors 10 (top), 37 (middle) and 63 (bottom). The plots are made with the tpfplotter (Aller et al. 2020) package. The pixels highlighted in yellow show the TESS apertures. The red dots show the positions of Gaia DR3 sources, and their sizes correspond to their TESS magnitudes.
Current usage metrics show cumulative count of Article Views (full-text article views including HTML views, PDF and ePub downloads, according to the available data) and Abstracts Views on Vision4Press platform.
Data correspond to usage on the plateform after 2015. The current usage metrics is available 48-96 hours after online publication and is updated daily on week days.
Initial download of the metrics may take a while.