| Issue |
A&A
Volume 677, September 2023
|
|
|---|---|---|
| Article Number | A38 | |
| Number of page(s) | 20 | |
| Section | Planets and planetary systems | |
| DOI | https://doi.org/10.1051/0004-6361/202346838 | |
| Published online | 30 August 2023 | |
TOI-2084 b and TOI-4184 b: Two new sub-Neptunes around M dwarf stars
1
Astrobiology Research Unit, Université de Liège,
Allée du 6 Août 19C,
4000
Liège, Belgium
e-mail: khalid.barkaoui@uliege.be
2
Department of Earth, Atmospheric and Planetary Science, Massachusetts Institute of Technology,
77 Massachusetts Avenue,
Cambridge, MA
02139, USA
3
Instituto de Astrofisica de Canarias (IAC),
Calle Vía Láctea s/n,
38200,
La Laguna, Tenerife, Spain
4
Oukaimeden Observatory, High Energy Physics and Astrophysics Laboratory, Faculty of sciences Semlalia, Cadi Ayyad University,
Marrakech, Morocco
5
Departamento de Fisica e Astronomia, Faculdade de Ciencias, Universidade do Porto,
Rua do Campo Alegre,
4169-007
Porto, Portugal
6
Instituto de Astrofisica e Ciencias do Espaco, Universidade do porto, CAUP,
Rua das Estrelas,
150-762
Porto, Portugal
7
Department of Physics and Kavli Institute for Astrophysics and Space Research, Massachusetts Institute of Technology,
Cambridge, MA
02139, USA
8
Center for Astrophysics and Space Sciences, UC San Diego,
UCSD Mail Code 0424, 9500 Gilman Drive,
La Jolla, CA
92093-0424, USA
9
Instituto de Astrofisica de Andalucia (IAA-CSIC),
Glorieta de la Astronomia s/n,
18008
Granada, Spain
10
Center for Astrophysics | Harvard & Smithsonian,
60 Garden St,
Cambridge, MA
02138, USA
11
NASA Ames Research Center,
Moffett Field, CA
94035, USA
12
Department of Physics & Astronomy, Vanderbilt University,
6301 Stevenson Center Ln.,
Nashville, TN
37235, USA
13
Instituto de Astronomia y Ciencias Planetarias de Atacama, Universidad de Atacama,
Copayapu 485,
Copiapo, Chile
14
Univ. Grenoble Alpes, CNRS, IPAG,
38000
Grenoble, France
15
Observatoire de Genève, Département d’Astronomie, Université de Genève,
Chemin Pegasi 51,
1290
Versoix, Switzerland
16
NASA Exoplanet Science Institute, Caltech/IPAC,
Mail Code 100-22, 1200 E. California Blvd.,
Pasadena, CA
91125, USA
17
Departamento de Astrofisica, Universidad de La Laguna (ULL),
38206
La Laguna, Tenerife, Spain
18
Institute for Astronomy, The University of Edinburgh, Royal Observatory,
Blackford Hill,
Edinburgh
EH9 3HJ, UK
19
Space Sciences, Technologies and Astrophysics Research (STAR) Institute, Université de Liège,
Allée du 6 Août 19C,
4000
Liège, Belgium
20
University of St Andrews, Centre for Exoplanet Science, SUPA School of Physics & Astronomy,
North Haugh,
St Andrews,
KY16 9SS, UK
21
Center for Space and Habitability, University of Bern,
Gesellschaftsstrasse 6,
3012,
Bern, Switzerland
22
School of Physics & Astronomy, University of Birmingham,
Edgbaston,
Birmingham
B15 2TT, UK
23
AIM, CEA, CNRS, Université Paris-Saclay, Université de Paris,
91191
Gif-sur-Yvette, France
24
Komaba Institute for Science, The University of Tokyo,
3-8-1 Komaba, Meguro,
Tokyo
153-8902, Japan
25
University of Southern Denmark, University Library,
Campusvej 55,
5230
Odense M, Denmark
26
Cavendish Laboratory,
JJ Thomson Avenue,
Cambridge
CB3 0HE, UK
27
Centre for ExoLife Sciences, Niels Bohr Institute, University of Copenhagen,
Øster Voldgade 5,
1350
Copenhagen, Denmark
28
Universidad Nacional Autonoma de México, Instituto de Astronomia,
AP 70-264,
Ciudad de México
04510, Mexico
29
European Space Agency (ESA), European Space Research and Technology Centre (ESTEC),
Keplerlaan 1,
2201 AZ
Noordwijk, The Netherlands
30
Department of Physics and Astronomy, Georgia State University,
Atlanta, GA
30302-4106, USA
31
RECONS Institute,
Chambersburg, PA
17201, USA
32
Department of Physics, University of Warwick,
Gibbet Hill Road,
Coventry
CV4 7AL, UK
33
Department of Astrophysical and Planetary Sciences, University of Colorado Boulder,
Boulder, CO
80309, USA
34
Astrobiology Center,
2-21-1 Osawa, Mitaka,
Tokyo
181-8588, Japan
35
Universidad Nacional Autonoma de México, Instituto de Astronomia,
AP 106,
Ensenada
22800,
BC, Mexico
36
Department of Physics, Isfahan University of Technology,
Isfahan
84156-83111, Iran
37
Department of Astronomy, University of Maryland,
College Park, MD
20742, USA
38
South African Astronomical Observatory,
PO Box 9,
Observatory,
Cape Town
7935, South Africa
39
Astrophysics Group, Keele University,
Staffordshire
ST5 5BG, UK
40
Kotizarovci Observatory,
Sarsoni 90,
51216
Viskovo, Croatia
41
Department of Astrophysical Sciences, Princeton University,
Princeton, NJ
08544, USA
Received:
8
May
2023
Accepted:
26
June
2023
We present the discovery and validation of two TESS exoplanets orbiting nearby M dwarfs: TOI-2084 b, and TOI-4184b. We characterized the host stars by combining spectra from Shane/Kast and Magellan/FIRE, spectral energy distribution analysis, and stellar evolutionary models. In addition, we used Gemini-South/Zorro & -North/Alopeke high-resolution imaging, archival science images, and statistical validation packages to support the planetary interpretation. We performed a global analysis of multi-colour photometric data from TESS and ground-based facilities in order to derive the stellar and planetary physical parameters for each system. We find that TOI-2084 band TOI-4184 bare sub-Neptune-sized planets with radii of Rp = 2.47 ± 0.13R⊕ and Rp = 2.43 ± 0.21 R⊕, respectively. TOI-2084 b completes an orbit around its host star every 6.08 days, has an equilibrium temperature of Teq = 527 ± 8 K and an irradiation of Sp = 12.8 ± 0.8 S⊕. Its host star is a dwarf of spectral M2.0 ± 0.5 at a distance of 114 pc with an effective temperature of Teff = 3550 ± 50 K, and has a wide, co-moving M8 companion at a projected separation of 1400 au. TOI-4184 b orbits around an M5.0 ± 0.5 type dwarf star (Kmag = 11.87) each 4.9 days, and has an equilibrium temperature of Teq = 412 ± 8 K and an irradiation of Sp = 4.8 ± 0.4 S⊕. TOI-4184 is a metal poor star ([Fe/H] = −0.27 ± 0.09 dex) at a distance of 69 pc with an effective temperature of Teff = 3225 ± 75 K. Both planets are located at the edge of the sub-Jovian desert in the radius-period plane. The combination of the small size and the large infrared brightness of their host stars make these new planets promising targets for future atmospheric exploration with JWST.
Key words: techniques: photometric / stars: low-mass
© The Authors 2023
 Open Access article, published by EDP Sciences, under the terms of the Creative Commons Attribution License (https://creativecommons.org/licenses/by/4.0), which permits unrestricted use, distribution, and reproduction in any medium, provided the original work is properly cited.
This article is published in open access under the Subscribe to Open model. Subscribe to A&A to support open access publication.
1 Introduction
M dwarfs are the most common stars in our galaxy (Henry et al. 1994; Kirkpatrick et al. 1999), and small planets occur around M dwarfs more frequently than Sun-like stars (Nutzman & Charbonneau 2008; Kaltenegger & Traub 2009; Winters et al. 2014). Therefore, M dwarfs are attractive and exciting targets for searching for small and temperate exoplanets using the transit technique, thanks to their small sizes, low masses, and luminosities. The transit signal is much deeper than that caused by similar planets orbiting Sun-like stars, which makes such planets easier to detect and characterize. Moreover, such planetary systems are suitable targets for atmospheric characterization through transmission spectroscopy, including JWST (Kempton et al. 2018). In addition, the radial-velocity semi-amplitudes of the stellar hosts are higher, thanks to the low stellar masses, which makes them suitable targets for planetary mass measurements. M dwarf systems will enable a better understanding of the so-called radius valley between the super-Earth- and sub-Neptune-sized planets (see, e.g., Owen & Wu 2013; Fulton & Petigura 2018; Van Eylen et al. 2018). Moreover, the discovery of additional sub-Neptune desert planets (Mazeh et al. 2016) allows us to further explore and understand the physical properties of such exoplanetary systems.
The Transiting Exoplanet Survey Satellite (TESS) mission (Ricker et al. 2015) was launched by NASA in 2018 to search for planets around bright nearby dwarfs, including M-type stars. To date, TESS has discovered more than 330 exoplanets orbiting FGKM stars, including 66 planets orbiting around M dwarfs1. Since 2018 NASA’s TESS mission has discovered several sub-Neptune-sized exoplanets around M dwarfs (e.g., TOI-1696b & TOI-2136b: Beard et al. 2022; TOI-1201b: Kossakowski et al. 2021; TOI-2081b & TOI-4479b: Esparza-Borges et al. 2022; TOI-122b & TOI-237b: Waalkes et al. 2021; TOI-269b: Cointepas et al. 2021; TOI-2406b: Wells et al. 2021; TOI-620b: Reefe et al. 2022; TOI-2136b: Gan et al. 2022; TOI-2257b: Schanche et al. 2022; and TOI-2096c: Pozuelos et al. 2023). In this paper, we present the discovery and validation of two new TESS exoplanets orbiting nearby M dwarfs, TOI-2084 b and TOI-4184 b. In Sect. 2, we present the TESS photometry, high-precision photometric follow-up observations using ground-based facilities, and high-resolution imaging from Gemini. In Sect. 3, we present an analysis of the host star properties derived from their spectral energy distributions (SEDs) and spectra. In Sect. 4, we validate the planetary nature of the transit signals. In Sect. 5, we present our global analysis of the photometric data sets of the planetary systems, allowing us to determine the physical parameters of the star and planet. In Sect. 6, we present planet searches and detection limits from the TESS photometry. Finally, we discuss our results and present our conclusions in Sect. 7.
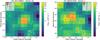 |
Fig. 1 TESS target pixel file images of TOI-2084 observed in Sector 16 (left panel) and TOI-4184 observed in Sector 1 (right panel), made by tpfplotter (Aller et al. 2020). Red dots show the location of Gaia DR3 sources, and the red shaded region shows the photometric apertures used to extract the photometric measurements. |
2 Observation and data reduction
2.1 TESS photometry
The host star TIC 394357918 (TOI-4184) was observed by TESS mission (Ricker et al. 2015) in Sectors 1, 28 and 39 for 27 days each on TESS CCD 3 Camera 3. The Sector 1 campaign started on UTC July 25 2018 and ended on UTC August 22 2018. The Sector 28 campaign started on UTC July 30 2020 and ended on UTC August 26 2020. The Sector 39 campaign started on UTC 2021 May 26 and ended on UTC 2021 June 26.
The star TIC 441738827 (TOI-2084) was observed by TESS in a 2 min cadence during Sectors 16 (UTC September 11 to October 07 2019), 19–23 (UTC November 27 2019 to April 16 2020), 25–26 (UTC May 13 to July 04 2020), and 48–60 (UTC January 31 2021 to January 18 2023). TOI-4184 and TOI-2084 were selected by Stassun et al. (2018) to be observed using the 2 min short-cadence mode. To perform TESS data modeling, we retrieved the Presearch Data Conditioning light curves (PDC-SAP; Stumpe et al. 2012, 2014; Smith et al. 2012) constructed by the TESS Science Processing Operations Center (SPOC; Jenkins et al. 2016) at Ames Research Center from the Mikulski Archive for Space Telescopes. PDC-SAP light curves have been corrected for instrument systematics and crowding effects. Figure 1 shows the TESS field of view for each target and photometric apertures used with the location of nearby Gaia DR3 sources around each target (Gaia Collaboration 2021). The TESS light curves for TOI-2084 and TOI-4184 are presented in Figs. 2 and 3.
2.2 Ground-based photometry
We used the TESS Transit Finder tool, which is a customized version of the Tapir software package (Jensen 2013) to schedule the photometric time-series follow-up observations. These are summarized in the following text with the resulting light curves presented in Fig. 4.
2.2.1 SPECULOOS-South
We used one of the SPECULOOS-South (Search for habitable Planets EClipsing ULtra-cOOl Stars; Jehin et al. 2018; Delrez et al. 2018; Sebastian et al. 2021) facilities to observe one full transit of TOI-4184.01 on UTC September 25 2021 in the Sloan-z′ filter with an exposure time of 42 s. Each 1.0-m robotic telescope is equipped with a 2K×2K CCD camera with a pixel scale of 0.35″ and a field of view of 12′×12′. We performed aperture photometry in an uncontaminated target aperture of 3.9″and a PSF full-width half-maximum (FWHM) of 1.7″. Data reduction and photometric measurements were performed using the PROSE2 pipeline (Garcia et al. 2022).
2.2.2 SPECULOOS-North
We used SPECULOOS-North/Artemis to observe two transits of TOI-2084.01. Artemis is a 1.0-m Ritchey-Chretien telescope equipped with a thermoelectrically cooled 2K×2K Andor iKon-L BEX2-DD CCD camera with a pixel scale of 0.35″, resulting in a field-of-view of 12′ × 12′ (Burdanov et al. 2022). It is a twin of the SPECULOOS-South (Sect. 2.2.1) and SAINT-EX (Sect. 2.2.3) telescopes. The first transit was observed on UTC 2020 August 13, and the second was observed on UTC June 25 2021. Both transits were observed in the I + z filter with an exposure time of 33 s and we performed aperture photometry in an uncontaminated target apertures of 2.8–3.2″ and a PSF FWHM of 1.4–1.6″. The data reduction (bias, dark, and flat correction) and photometric measurements were performed using the PROSE pipeline (Garcia et al. 2022).
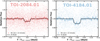 |
Fig. 2 Phase-folded TESS transit light curves of TOI-2081.01 (left) and TOI-4184.01 (right). The points with the error bar are data binned to 15 min. |
2.2.3 SAINT-EX
We used the SAINT-EX telescope to observe one full transit of TOI-2084.01 on UTC July 13 2021 in the r′ filter with an exposure time of 141 seconds. SAINT-EX (Search And characterIsatioN of Transiting EXoplanets; Demory et al. 2020) is a 1-m F/8 Ritchey-Chretien telescope located at the Sierra de San Pedro Mártir in Baja California, México. SAINT-EX is equipped with a thermoelectrically cooled 2K×2K Andor iKon-L CCD camera. The detector gives a field of view of 12′ × 12′ with a pixel scale of 0.35″ per pixel. We performed aperture photometry in an uncontaminated target aperture of 3.2″ and a PSF FWHM of 1.4″. The data reduction and photometric measurements were performed using the PROSE pipeline (Garcia et al. 2022).
2.2.4 TRAPPIST-North
We used the 60-cm TRAPPIST-North telescope to observe one partial transit and one full transit of TOI-2084.01. TRAPPIST-North (TRAnsiting Planets and PlanetesImals Small Telescope) is a 60-cm robotic telescope that has been installed at Oukaimeden Observatory in Morocco since 2016 (Barkaoui et al. 2019, and references therein). It is equipped with a thermoelectrically cooled 2K×2K Andor iKon-L BEX2-DD CCD camera with a pixel scale of 0.6″ and a field of view of 20′ × 20′. The first transit was observed on UTC January 30 2021 in the I + z, filter with an exposure time of 60 seconds. We took 154 science images and performed aperture photometry in an uncontaminated aperture of 7.6″ and a PSF FWHM of 3.1″. The second transit was observed on UTC June 25 2021 in the I + z filter with an exposure time of 65 seconds. We took 216 science images and performed aperture photometry in an uncontaminated aperture of 5.6″ and a PSF FWHM of 3.7″. During that second observation of TOI-2084, the telescope underwent a meridian flip at BJD 2459391.4829. Data reduction and photometric measurements were performed using the PROSE pipeline (Garcia et al. 2022).
2.2.5 TRAPPIST-South
Two full transits of TOI-4184.01 were observed with the TRAPPIST-South telescope. It is a 60-cm Ritchey-Chretien telescope located at ESO-La Silla Observatory in Chile, which is the twin of TRAPPIST-North (Sect. 2.2.4). It is equipped with a thermoelectrically cooled 2K×2K FLI Proline CCD camera with a field of view of 22′ × 22′ and pixel-scale of 0.65″ pixel−1 (Jehin et al. 2011; Gillon et al. 2011). The first transit was observed on UTC August 2 2021, and the second transit was observed on UTC September 25 2021. Both transits were observed in the I + z filter with an exposure time of 150 s, and we performed aperture photometry in an uncontaminated target apertures of 3.5–6.2″ and a PSF FWHM of 2.4–2.7″. During the second transit of TOI-4184.01, the telescope underwent a meridian flip at BJD = 2459478.8226. Data reduction and photometric measurements were performed using the PROSE pipeline (Garcia et al. 2022).
2.2.6 LCOGT-2.0 m MuSCAT3
We used the Las Cumbres Observatory Global Telescope (LCOGT; Brown et al. 2013) 2.0-m Faulkes Telescope North at Haleakala Observatory in Hawaii to observe two transits of TOI-2084.01 simultaneously in Sloan-g′, r′, i′ and Pan-STARRS z-short filters. The first (full) transit was observed on UTC May 19 2021, and the second (partial) transit was observed on UTC May 26 2021. We used uncontaminated 4″ target apertures to extract the stellar fluxes. The telescope is equipped with the MuSCAT3 multi-band imager (Narita et al. 2020). The raw data were calibrated using the standard LCOGT BANZAI pipeline (McCully et al. 2018), and photometric measurements were extracted using AstroImageJ3 (Collins et al. 2017).
2.2.7 Las Cumbres Observatory CTIO-1.0m and SAAO-1.0m
We used the Las Cumbres Observatory Global Telescope (LCOGT; Brown et al. 2013) 1.0-m network to observe four full transits of TOI-4184.01 in the Sloan-i′ and g′ filters. The telescopes are equipped with 4096 × 4096 SINISTRO Cameras, having an image scale of 0.389″ per pixel and a field of view of 26′ × 26′. The raw data were calibrated by the standard LCOGT BANZAI pipeline (McCully et al. 2018) and photometric measurements were extracted using AstroImageJ (Collins et al. 2017). Two transits were observed at Cerro Tololo Interamerican Observatory (CTIO) in Sloan-i′ on UTC July 28 2021 and September 20 2021, using uncontaminated 3.1″ and 4.3″ target apertures. Two others were observed simultaneously in the Sloan-g′ and i′ at South Africa Astronomical Observatory (SAAO) on UTC October 10 2021, using uncontaminated 3.9″ target apertures.
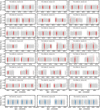 |
Fig. 3 TESS photometric data of TOI-2084.01 and TOI-4184.01. The gray points show the PDSAP fluxes obtained from the SPOC pipeline. The red and blue points correspond to the location of the transit for the candidates TOI-2084.01 and TOI-4184.01, respectively. |
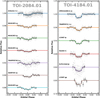 |
Fig. 4 Ground-based photometric light curves of TOI-2081.01 (left) and TOI-4184.01 (right). The gray points show the unbinned data and the black points are data binned at 10 min. The coloured lines are the best-fitting transit model. The light curves are shifted along the y-axis for visibility. |
2.2.8 Danish-1.54m
Three transits of TOI-4148.01 were observed on UTC September 15, 20 and 25 2021 by the MiNDSTEp consortium (Dominik et al. 2010) using the Danish 1.54 m telescope at ESO’s La Silla observatory in Chile. The instrument used was the DFOSC imager, operated with a Bessell I filter for two transits and a Bessell R filter for the third. In this setup, the CCD covers a field of view of 13.7′×13.7′ with a pixel scale of 0.39″ pixel−1. The images were unbinned and windowed for the first transit, resulting in a dead time between consecutive images of 10s. However, in an effort to improve the signal-to-noise ratio (S/N) of the target PSF, the remaining transits used 2 × 2 binning and no windowing (to obtain a greater selection of comparison stars), resulting in a dead time between consecutive images of 13 s. The exposure times were 60s for all images and transits. Due to the target being quite faint (V = 17th mag, I = 14th mag) and with the presence of close nearby sources (both point and extended), the telescope was marginally defocused and autoguiding was maintained through all observations. The amount of defocus applied caused the resulting PSFs to have a diameter of ≈10 pixels for all nights.
We reduced the Danish 1.54-m telescope data using the DEFOT pipeline (Southworth et al. 2009, 2014). Aperture photometry was performed with an IDL implementation of DAOPHOT (Stetson 1987), with the addition of image motion tracking by cross-correlation with a reference image to produce a differential magnitude light curve. The light curve was produced after simultaneously fitting a first-order polynomial to the out of transit data. The aperture sizes and number of suitable comparison stars were adjusted to obtain the lowest baseline scatter; this method affects the scatter in the transit data but does not significantly impact the light curve shape. The time stamps from the fits files were converted to the BJDTDB timescale using routines from Eastman et al. (2010).
2.2.9 ExTrA
The ExTrA facility (Bonfils et al. 2015), located at La Silla observatory, consists of a near-infrared (0.85-1.55 μm; NIR) multi-object spectrograph fed by three 60-cm telescopes. Five fiber positioners at the focal plane of each telescope pick up light from the target and four comparison stars. We observed one full transit of TOI-4184 b on UTC September 15 2021 with two telescopes using the 8″ aperture fibers. We used the spectrograph’s low resolution mode (R ~ 20) and 60-second exposures. We also observed 2MASS J02542961-7941578, 2MASS J03025970-7941390, 2MASS J03025068-7918174, and 2MASS J02581731-7913567, with J-magnitudes (Skrutskie et al. 2006) and effective temperatures (Gaia Collaboration 2018) similar to those of TOI-4184, for use as comparison stars. The resulting ExTrA data were analyzed using custom data reduction software.
2.3 Spectroscopy
2.3.1 Shane/Kast optical spectroscopy
We obtained an optical spectrum of TOI-2084 and its co-moving companion (see below) on UTC November 13 2021 using the Kast double spectrograph (Miller & Stone 1994) mounted on the 3-m Shane Telescope at Lick Observatory in clear conditions. Six exposures of 600 s each was obtained of both sources TOI-2084 simultaneously using the 600/7500 grism and 1.″/5-wide slit, providing 6000–9000 Å wavelength coverage at an average resolution of λ/Δλ = 1900. We also observed the flux calibrator Feige 110 later that night (Hamuy et al. 1992, 1994). Data were reduced using the kastredux package4, which included image reduction, boxcar extraction of the one-dimensional spectra, wavelength calibration, and flux calibration. No correction for telluric absorption was applied. The final spectra have median signals-to-noise of 125 (TOI-2084) and 12 (TOI-2084B) around 8400 Å, with a wavelength accuracy of 0.26 Å (12 km s−1).
2.3.2 Magellan/FIRB spectroscopy
We obtained a spectrum of TOI-4184 with the FIRE spectrograph (Simcoe et al. 2008) on the 6.5-m Magellan Baade Telescope on UTC September 23, 2021. We used the high-resolution echellette mode with the 0760 slit, providing a 0.82-2.51 μm spectrum with a resolving power of R ~ 6000. We collected a single ABBA nod sequence (4 exposures) with integration times of 95.1 s per exposure, giving a total exposure time of 380.4 s. After the science exposures, we collected a pair of 15-s exposures of the AO V star HD 45039 for flux and telluric calibrations followed by a pair of 10-s arc lamp exposures and a set of 10 1-s flat-field exposures. We reduced the data using the FIREHOSE pipeline5. The final spectrum (Fig. 5) has a median S/N of 77, with peaks in the J, H, and Κ bands of 120–140.
2.4 High-resolution imaging from Gemini-8m0
TOI-2084 was observed on UTC June 24 2021 using the Alopeke speckle instrument on the Gemini North 8-m telescope and TOI-4184 was observed on UTC December 23 2021 using the Zorro speckle instrument on the Gemini South 8-m telescope (see Scott et al. 2021). Alopeke and Zorro provide simultaneous speckle imaging in two bands (562 nm and 832 um) with output data products including a reconstructed image with robust contrast limits on companion detections (e.g., Howell et al. 2016). A total of 13/11 sets of 1000 × 0.06 sec exposures were collected for TOI-2084/TOI-4184 and subjected to Fourier analysis in our standard reduction pipeline (see Howell et al. 2011). Figure 6 shows our final 5σ contrast curves and the 832 nm reconstructed speckle images. We find that TOI-2084 and TOI-4184 are both single stars with no companion brighter than about 4–6 magnitudes below that of the target star from the diffraction limit (20 mas) out to 1.2″. At the distance of TOI-2084/TOI-4184 (d = 114/69 pc), these angular limits correspond to spatial limits of 2.3–137 au (TOI-2084) and 1.4–83 au (TOI-4184).
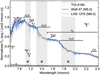 |
Fig. 5 Magellan/FIRE spectrum of TOI-4184. The SpeX Prism spectrum of the M5.0 standard Wolf 47 and M6.0 standard LHS 1375 (Kirkpatrick et al. 2010) are shown for comparison. Strong M dwarf spectral features are indicated, and high-telluric regions are shaded. Lines along the bottom of the plot give the uncertainties associated with the spectra. |
3 Stellar characterisation
3.1 SED analysis
To determine the basic stellar parameters, we performed an analysis of the broadband SED of TOI-2084 and TOI-4184 together with the Gaia EDR3 parallax (with no systematic offset applied; see, e.g., Stassun & Torres 2021), in order to determine an empirical measurement of the stellar radius, following the procedures described in Stassun & Torres (2016, 2018), and Stassun et al. (2017). We pulled the JHKS magnitudes from 2MASS, the W1–W3 magnitudes from WISE, the GBP and GRP magnitudes from Gaia, and the grizy magnitudes from Pan-STARRS. Altogether, the available photometry spans the full stellar SED over the wavelength range 0.4–10 μm (see Fig. 7). We also estimated the stellar mass according to the empirical MK based relations of Mann et al. (2019). Deduced stellar parameters of TOI-2084 and TOI-4184 are presented in Table 1.
3.2 Spectroscopic analysis
In addition to the SED analysis, we also compared the Shane/Kast optical spectrum of TOI-2084 to the SDSS M dwarf templates of Bochanski et al. (2007) and found the best match to the M2 template (Fig. 8). The spectral index classification relations of Lépine et al. (2003) confirm this classification. We see no evidence of Hα emission (equivalent width limit of <1.0 Å), indicating an age greater than ~1.2 Gyr (West et al. 2008). We also measured the ζ index from TiO and CaH features (Lépine et al. 2007; Mann et al. 2013), finding ζ = 0.893±0.005, consistent with a metallicity of [Fe/H] = −0.13±0.20 based on the calibration of Mann et al. (2013).
For TOI-4184, we also analyzed its Magellan/FIRE spectrum using the SpeX Prism Library Analysis Toolkit (SPLAT; Burgasser & Splat Development Team 2017). By comparing the spectrum to NIR spectral standards defined in Kirkpatrick et al. (2010), we find the closest match to the M5.0 standard, although the M6.0 standard provides only a marginally poorer match (Fig. 5). Thus, we adopt a spectral type of M5.5±0.5 for TOI-4184. We also estimated the metallicity of TOI-4184 from the Magellan/FIRE spectrum from the equivalent widths of K-band Na I and Ca I doublets and the H2O–K2 index (Rojas-Ayala et al. 2012), and used the empirical relation between these observables and stellar metallicity (Mann et al. 2014) to estimate [Fe/H]. Following Delrez et al. (2022), we calculated the uncertainty of our estimate using a Monte Carlo approach. Adding in quadrature the systematic uncertainty of the relation (0.07), we obtained our final estimate of [Fe/H] = −0.27 ± 0.09, indicating that TOI-4184 is a moderately metal-poor star.
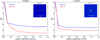 |
Fig. 6 High resolution imaging of TOI-2084 and TOI-4184 shows they are both single stars with no companion brighter than 4–6 magnitudes below that of the target star. Left panel: Gemini-North/Alopeke high resolution image of TOI-2084 observed on UTC June 24 2021. Right panel: Gemini-South/Zorro high-resolution image of TOI-4184 observed on UTC December 23 2021. |
 |
Fig. 7 SED fit of TOI-2084 (right) and TOI-4184 (left). The gray curves are the best-fitting NextGen atmosphere model, coloured symbols with error-bars are the observed fluxes, and black symbols are the model fluxes. |
3.3 The wide companion to TOI-2084
TOI-2084 has a wide stellar companion, 2MASS J17170042+7244364 (hereafter TOI-2084B; G = 20.7, J= 16.1), separated by 12.″2 (~1400 au) at position angle 191° east of north. Both sources are in Gaia DR3 and share a common parallax and proper motion. The Shane/Kast optical spectrum of TOI-2084B is shown in Fig. 8, and is an excellent match to the M8 dwarf template from Bochanski et al. (2007). This classification is confirmed by the spectral index classification relations of Lépine et al. (2003). We see no evidence of Hα emission from this companion, although the noise is considerable in the 6563 Å region. Similarly, we are unable to reliably measure a ζ index from these data, although the close match to the dwarf template suggests a near-solar metallicity similar to TOI-2084. There are several known planetary systems orbiting stars in low-mass multiples, including the M4+M4.5 binary TOI-1452 and TOI-1760 (Cadieux et al. 2022) as well as the early-M triple system LTT 1445 (Winters et al. 2019). TOI-2048 and TOI-2048B have an unusually wide separation among low-mass planet hosts in binary systems, although there are examples of such systems among more massive stellar binaries (Correa-Otto & Gil-Hutton 2017).
Astrometry, photometry, and spectroscopy stellar properties of TOI-2084 and TOI-4184.
4 Planet validation
4.1 TESS data validation
TOI-4184 (TIC 394357918) was observed in sectors 1, 28, and 39 of TESS with 2 min cadence. The Science Processing Operations Center (SPOC; Jenkins et al. 2016) extracted the photometry of sectors 1 and 28 and performed a transit search (Jenkins 2002; Jenkins et al. 2010), which yielded the candidate with a 4.902 day period at a S/N of 11. The SPOC Data Validation (DV) report Twicken et al. (2018); Li et al. (2019) was reviewed by the TESS Object of Interest (TOI) vetting team on May 27 2021 and TOI-4184 was released on July 8 2021 (Guerrero et al. 2021). A second data validation report was issued on the July 24 2021. The transit depth found was 10.7 ± 0.9 ppt, corresponding to a planet radius of 2.6 ± 0.4 R⊕, and with a period of 4.90199 ± 0.00001 days. The odd and even comparison of the depths agreed to 2.28σ. Given the large pixel scale of 21 arc-secs, two neighboring stars were fully or partially included in the TESS aperture, as seen in Fig. 1, although TOI-4184 was identified as the likely source of the events. The difference imaging centroid test performed for sectors 1 to 39 constrains the location of the target star’s catalog location to 5.5 ± 3.3 arcsec. All additional validation tests, including centroid offset, bootstrap, and ghost tests, were passed.
TOI-2084 (TIC 441738827) was observed in sectors 16, 19–23, 25–26, and 48–60 with 2 min cadence by TESS. The SPOC pipeline produced the first DV report on May 6 2020 using extracted photometry of sectors 16 and 19–23. Two candidates were identified: .01 has a period of 6.078 days and a depth of 2.760 ± 258 ppt at an S/N of 11.2, and .02 a period of 8.149 days and a depth of 3.313 ± 327 ppt at an S/N of 10.8. The report was reviewed by the TOI vetting team and the candidates were released on July 15 2020. A second DV report was issued on August 7, 2020 from the SPOC pipeline which included sectors up to 26 of 2-min cadence data. The first candidate was found to have a period of 6.07830 ± 0.00010 days, a transit depth of 2.8 ± 0.2 ppt with an S/N of 12.7, and a planetary radius of 2.6 ± 0.7 R⊕. Similarly, the second candidate was found to have a period of 8.14903 ± 0.00018 days, a transit depth of 2.8 ± 0.2 ppt with an S/N of 11.8, and a planetary radius of 2.6 ± 0.6 R⊕. The odd and even phase-folded transits were compared and agreed to 1.45σ and 0.96σ for the .01 and .02 candidates, respectively. As for TOI-4184, one nearby star is contaminating the aperture, but the event was limited to be on target for the .01 candidate and likely on target for .02. In addition, the DV report a difference an imaging centroid test result that places the catalog position of the target star to within 2.0+3.0 arcsec. The rest of the validation tests were passed. The TESS full-frames images were also processed by the Quick Look Pipeline (QLP; Huang et al. 2020), which extracted the photometry of TOI-2084 in sectors 15–16, 18–25, and 47–52, and confirmed the signal found in 2 min cadence data.
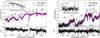 |
Fig. 8 Shane/Kast red optical spectra (black lines) of TOI-2084 (left) and its wide stellar companion TOI-2084B (right) compared to the best-fit M2 and M8 SDSS spectral templates from Bochanski et al. (2007, magenta lines). The lower panels display the difference between these spectra (black line) compared to the ±1σ measurement uncertainty (grey band). Key features are labeled, including the strong telluric O2 band at 7600 Å (⊕). Inset boxes show close-ups of the region around the 6563 Å Hα and 6708 Å Li I lines. |
4.2 Archival imaging
We obtained archival images of TOI-2084 and TOI-4184 in order to discard the case of a background unresolved companion producing the transit signals. Whether an eclipsing binary, a planetary candidate orbiting a background star, or simply an unaccounted background star, any of these scenarios would skew the stellar and planetary parameters obtained from our global analysis. TOI-2084 has a relatively low proper motion of 60.24 mas yr−1, which makes it challenging to assess the background of the star’s current position. We obtained images from POSS I/DSS (Minkowski & Abell 1963), POSS II/DSS (Lasker et al. 1996) and PanSTARRS 1 (Chambers et al. 2016) in the red, infrared and z bands, respectively, and spanning 68 yr, as shown in Fig. 9. TOI-2084 has moved by >4″ between the 1953 image and the 2021 image. Given the pixel scale of 1–1.7″, it is impossible to rule out a background star from this diagnostic alone, though it is unlikely since we ruled out any close companion star at a minimum angular separation of 0.1″ (see Sect. 2.4). We also compared images centered on TOI-4184 from POSS II/DSS in the blue, red and infrared bands taken in 1977, 1989, and 1990, respectively. Because of its high proper motion of 183.87 mas yr−1, TOI-4184 has moved by >8″ in the 44 yr spanning the observations. This allows us to confirm the lack of any background contaminant in the line of sight brighter than a limiting magnitude of ≥20.
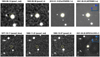 |
Fig. 9 Field images cropped on a 1′×1′ region around TOI-2084 (top row) and TOI-4184 (bottom row). The current position of the target stars is shown with the yellow circle. Top row: 1953 red image from POSS I/DSS, 1953 infrared image from POSS II/DSS2, 2012 z′ image from PanSTARRS 1, and 2021 I+z image from SPECULOOS-North (from left to right). Bottom row: 1977 blue image from POSS II/DSS2, 1989 red image from POSS II/DSS2, 1990 infrared image from POSS II/DSS2, and 2021 image z′ from SPECULOOS-South (from left to right). |
4.3 Follow-up photometric validation
The photometric follow-up using ground-based facilities was carried out on the basis of two objectives: identify the source of the transit event and assess if the transit depth is wavelength-dependent. The presence of contaminating stars in the TESS aperture was noted for both TOI-4184.01 and TOI-2084.01 in the TESS data validation reports. The closest neighboring stars are respectively TIC 650071720 at 11.5″ with a ΔTmag of 4.45, and TIC 441738830 at 12.4″ with a ΔTmag of 6.15. We reached aperture sizes of a few arcseconds using ground-based facilities, which allowed us to confirm the transit events are on the expected stars for TOI-4184.01 and TOI-2084.01. In the case of TOI-2084.02, at the expected transit times we detected a deep eclipse twice on the nearby star TIC 1271317080 (ΔT = 4.98) at 12.9 from the target, labeled T3 in Fig. 10. Thus, we ruled out TOI-2084.02 as a false positive and did not consider it further. We collected photometric data for TOI-2084.01 in various bands (I+z, zs, i′, r′, g′), spanning the 400–1100 nm wavelength ranges. We measured a matching transit depth within 1σ in all bands. Similarly, we obtained data for TOI-4184.01 in the I+z, zs, Ic, J J, g′ bands, covering a range between 400 and 1210 nm where the transits depths also agree within 1σ. The transit depths measured in different wavelengths for TOI-2084 b and TOI-4184 b are presented in Fig. 11, Tables 2 and 3.
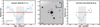 |
Fig. 10 TOI-2084 light curves obtained with ground-based facilities. Left panel: light curve obtained with SPECULOOS-North in the I+z Alter on UTC August 17 2020. Middle panel: TOI-2084 field-of-view with nearby stars. The wide co-moving companion TOI 2084B is directly south. Right panel: light curve obtained with LCO-McD in the Sloan-i′ filter on UTC August 26 2020. Red and blue data points show the target (T1) and nearby star (T3) light curves, respectively. During the expected transit of TOI-2084.02, we twice detected a deep eclipse (≈400 ppt) on the nearby star TIC 1271317080 (ΔT = 4.98) at 12.9″ from the target, labeled T3. |
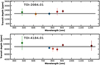 |
Fig. 11 Transit depths measured for multi-band photometric follow-up of TOI-2084.01 (top panel) and TOI-4184.01 (bottom panel). Solid horizontal lines correspond to the TESS measured transit depth. |
4.4 Statistical validation
To calculate the false positive probability (FPP) for TOI-2084.01 and TOI-4184.01, we used the Tool for Rating Interesting Candidate Exoplanets and Reliability Analysis of Transits Originating from Proximate Stars (TRICERATOPS; Giacalone et al. 2021). This Bayesian tool incorporates prior knowledge of the target star, planet occurrence rates, and stellar multiplicity to calculate the probability that a given transit signal is due to a transiting planet or another astrophysical source. The criteria for statistical validation of a planetary candidate are established as FPP6 < 0.01 and NFPP7 < 0.001, namely, the sum of probabilities for all false positive scenarios. We ran TRICERAT0PS on the TESS light curves including the contrast curve obtained with Gemini/Alopeke and Gemini/Zorro for both stars, TOI-2084 and TOI-4184. We found FPP = 0.0005 and FPP = 0.0001 for TOI-2084 b and TOI-4184 b, respectively. Because TRICERATOPS determines that no nearby stars are capable of being sources of astrophysical false positives, we find NFPP = 0 for both candidates (TOI-2084.01 and TOI-4184.01). Based on these results, we consider two planets to be validated. TOI-2084.02 was rejected as a nearby eclipsing binary (NEB) based on ground-based photometric follow-up (see Sect. 4.3).
5 Photometric data modelling
We performed a joint fit of all observed light curves by TESS and ground-based telescopes described in Sect. 2, using the Metropolis-Hastings (Metropolis et al. 1953; Hastings 1970) algorithm implemented in the updated version of MCMC (Markov chain Monte Carlo) code described in Gillon et al. (2012). The transit light curves were modeled using the quadratic limb-darkening model of Mandel & Agol (2002), multiplied by a baseline model in order to correct for several external effects related to systematic variations (time, airmass, background, full-width half-maximum, and position on the detector). The baseline model was selected based on minimizing the Bayesian information criterion (BIC) described in Schwarz (1978). Table 4 shows, for each transit light curve, the selected baseline model based on the BIC, and correction factor CF = ßw × ßr, used to rescale the photometric errors, where ßw and ßr are white and red noises, respectively (see Gillon et al. 2012 for more details). TRAPPIST-South and TRAPPIST-North telescopes are equipped with German equatorial mounts that have to rotate 180° when the meridian flip is reached. This movement results the stellar images in different position on the detector before and after the flip. The normalization offset is included as jump parameter in our global MCMC analysis. The transit light curve observed with TRAPPIST-South on UTC September 20 2021 contains a meridian flip at BJD = 2459478.8226 (see Table 5), which is accounted during the global analysis.
The jump parameters sampled by the MCMC for each system were: the transit timing, T0, the transit duration, W, the transit depth,  (where Rp is the planet radius and R* is the star radius), the orbital period of the planet, P, the impact parameter in case of the circular orbit, b = a cos(ip)/R* (where ip is the planetary orbital inclination and ap is the semi-major axis of the orbit), the combination q1 = (u1 + u2)2 and q2 = 0.5u1(u1 + u2)−1 (Kipping (2013), where u1 and u2 are the quadratic limb-darkening coefficients, which are calculated from Claret et al. (2012), and the stellar metallicity [Fe/H], the effective temperature Teff, log of the stellar density log(ρ*), and log of the stellar mass log(M*)), and
  , where ω is the argument of periastron and e is the orbital eccentricity.
For each star, we applied a Gaussian prior distribution on the stellar parameters obtained from SED and spectroscopy (which are R*, M*, [Fe/H], log ɡ* and Teff). For each system, we performed two MCMC analyses: the first assuming a circular orbit and the second assuming an eccentric orbit. The results are compatible with a circular orbit based on the Bayes factor BC = exp(−ΔBIC/2). The eccentric solutions give  for TOI-2084.01 and
  for TOI-4184.01.
For each transit light curve, a preliminary analysis composed of one Markov chain of 105 steps was performed in order to calculate the correction factor CF. Then a global MCMC analysis of three Markov chains of 105 steps was performed to derive the stellar and planetary physical parameters. The convergence of each Markov chain was checked using the statistical test of Gelman & Rubin (1992). The derived parameters of TOI-2084 and TOI-4184 are presented in Tables 1, 2, and 3.
TOI-2084 system parameters derived from our global MCMC analysis (medians and 1σ).
TOI-4184 system parameters derived from our global MCMC analysis (medians and 1σ).
6 Planet searches using the TESS photometry
In this section, we search for additional planetary candidates that might have remained unnoticed by SPOC and the QLP due to their detection thresholds. To this end we used our custom pipeline SHERLOCK8, originally presented by Pozuelos et al. (2020) and Demory et al. (2020) and used in several studies (see, e.g., Wells et al. 2021; Van Grootel et al. 2021; Schanche et al. 2022).
SHERLOCK allows the user to explore TESS data to recover known planets and alerted candidates and as well as to search for new periodic signals, which may hint at the existence of extra transiting planets. In short, the pipeline has six modules to (1) download and prepare the light curves from the MAST using the lightkurve (Lightkurve Collaboration 2018), (2) search for planetary candidates through the tls (Hippke & Heller 2019), (3) perform a semi-automatic vetting of the interesting signals, (4) compute a statistical validation using the TRICERATOPS (Giacalone et al. 2021), (5) model the signals to refine their ephemerides employing the allesfitter package (Günther & Daylan 2021), and (6) compute observational windows from ground-based observatories to trigger a follow-up campaign. We refer the reader to Delrez et al. (2022) and Pozuelos et al. (2023) for recent SHERLOCK applications and further details.
For TOI-4184, we searched for extra planets analyzing the three available sectors (1, 28, and 39) together, exploring orbital periods from 0.3 to 30 d. For TOI-2084.01, we conducted two independent searches: 1) corresponding to the nominal mission, that is, 8 sectors from 16 to 26, and 2) corresponding to the extended mission, that is, 13 sectors from 48 to 60 (see Fig. 3). In both searches, we explored the orbital periods from 0.3 to 50. The motivation to follow this strategy is twofold. On the one hand, the high computational cost of exploring at the same time 21 sectors, while adding many sectors might hint at the presence of very long orbital periods (>50 days), the transit probabilities rapidly decrease for such scenarios. On the other hand, this strategy allows us to compare any finding in the nominal mission with the extended mission, providing an extra vetting step for the credibility of the signals.
We successfully recovered the TOIs released by SPOC, the TOI-4184.01 with an orbital period of 4.90 days and TOI-2084.01 with an orbital period of 6.08 days. In the subsequent runs performed by SHERLOCK, we did not find any other signal that hinted at the existence of extra transiting planets. In addition to TOI-2084.01, we also recovered a signal corresponding to TOI-2084.02, which was already classified as a false positive using ground-based observations described Sect. 4.3 and displayed in Fig. 10. Surprisingly, we did not recover the signal with the orbital period issued by TESS, 8.14 days, but its first sub-harmonic, which corresponds to an orbital period of 4.07 days. Then, we used the two modules implemented in SHERLOCK for vetting and statistical validation of candidates with this signal. On the one hand, using the vetting module, we found that even and odd transits yielded different transit depths; ~2.3 and ~1.1 ppt for even and odd transits, respectively. This indicated that our detection algorithm was confusing the secondary eclipse as the primary and yielding half of the real orbital period, which confirmed that the real orbital period is 8.14 days. On the other hand, the validation module found that its FFP is ~0.26 and NFPP is ~0.1. According to Giacalone et al. (2021), these values place this candidate in the false positive area in the NFPP-FPP plane. Hence, these analyses agreed with the eclipsing binary nature of this signal.
MCMC analysis parameters.
Observational parameters: date of observation, filter used, telescope, exposure time(s), photometric aperture size, and FWHM of the point-spread function.
7 Results and discussion
We present the validation and discovery of TOI-2084 b and TOI-4184 b by the TESS mission (see phase-folded light curves in Fig. 2 and individual transits in Fig. 3), which were confirmed through follow-up photometric measurements collected by SPECULOOS-South/North, SAINT-EX, TRAPPIST-South/North, MuSCAT3, LCOGT, Danish and ExTrA telescopes (see phase-folded light curves in Fig. 4). The host stars were characterized by combining optical spectrum obtained by Shane/Kast and Magellan/FIRE, SED, and stellar evolutionary models. We performed a global analysis of space TESS and ground-based photometric data to derive the stellar and planetary physical parameters for each system. Table 1 shows the astrometry, photometry, and spectroscopy stellar properties of TOI-2084 and TOI-4184. Derived stellar and planetary physical parameters from our global analysis are shown in Tables 2 and 3. Figure 12 shows the periodogram for the system. Both planets are well detected in TESS data. Figures A.1 and A.2 show the parameters posterior distributions for each system.
7.1 TOI-2084 b and TOI-4184 b
TOI-2084 is a Kmag = 11.15 M2-type star with an effective temperature of Τ = 3553 ± 50K, a surface gravity of log ɡ* = 4.75 ± 0.05 dex, a mass of M* = 0.49 + 0.03 M⊙ and a radius R⊙ = 0.475 ± 0.016 R⊙ (derived from the SED analysis including Gaia EDR3 parallax) and a metallicity of [Fe/H] = −0.13 ± 0.20 (from the Shane/Kast spectrum). It has a wide (~ 1400 au) M8 co-moving companion, with a likely mass of 0.1 M⊙. TOI-2084b is a sub-Neptune-sized planet orbiting around the host primary star every 6.08 days, which has a radius of Rp = 2.47 ± 0.13 R⊕, an equilibrium temperature of Teq = 527 ± 8 K, an incident flux of Sp = 12.8 ± 0.8 times that of Earth. We find that TOI-2084 b has a predicted mass of  using the Chen & Kipping (2017) relationship.
TOI-4184 is a Kmag = 11.86 M5.5±0.5 metal-poor star with a metallicity of [Fe/H] = −0.27 ± 0.09 dex (from the Magellan/FIRE spectrum), an effective temperature of Teff = 3225 ± 75 K, a surface gravity of log ɡ* = 5.01 ± 0.04 dex, a mass of M* = 0.240 ± 0.012 M⊙ and a radius R⊙ = 0.242 ± 0.013 R⊙. TOI-4184b is a sub-Neptune-sized planet that completes its orbit around its host star in 4.9 days, has a radius of Rp = 2.43 ± 0.21 R⊙, an irradiation of Sp = 4.8 ± 0.4 Earth irradiation, and an equilibrium temperature of Teq = 412 ± 8 K. We used the Chen & Kipping (2017) relationship to predict the plausible mass of TOI-4184 b, which is  .
.
Figure 13 shows the boundaries of the sub-Neptune-desert region determined by Mazeh et al. (2016). TOI-2084 b and TOI-4184 b are placed at the edge of the sub-Jovian desert in the radius-period plane. Combining the infrared brightness of the host star and predicted semi-amplitude of the radial-velocity ( for TOI-2084 b and
  for TOI-4184b) using Chen & Kipping (2017)’s relationship, make TOI-2084b and TOI-4184 b good targets for radial velocity follow-up with high-resolution spectrographs (e.g., CARMENES, Quirrenbach et al. 2014; ESO-VLT-8.0m/ESPRESSO, Pepe et al. 2021; Gemini-North-8.0 m/MAROON-X, Seifahrt et al. 2020; and ESO-3.6 m/NIRPS, Bouchy 2021) to constrain the planetary masses, bulk densities and other orbital parameters.
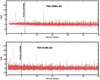 |
Fig. 12 Generalised Lomb-Scargle periodogram (GLS, Zechmeister & Kürster 2009) for TOI-2084.01 (top) and TOI-4184.01 (bottom) TESS data. |
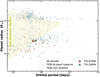 |
Fig. 13 Period-Radius diagram of known transiting exoplanets from NASA Archive of Exoplanets. The blue and orange data points correspond to the TESS FGK and M dwarf systems, respectively. The green and red stars show TOI-2084 b and TOI-4184 b, respectively. The yellow region shows the boundaries of the sub-Neptune-desert determined by Mazeh et al. (2016). |
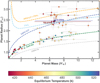 |
Fig. 14 Mass-radius diagram of exoplanets with mass-radius measurements better than 25% from TEPCat (Southworth 2011) and for our candidates, color-coded by their equilibrium temperature. Two-layer models from Zeng et al. (2016) are displayed with different lines and colors. Here, “Earth-like” refers to a composition of 30% Fe and 70% MgSiO3. The 2% H2 line represents a composition consisting of a 98% Earth-like rocky core and a 2% H2 envelope by mass, while the 49% H2O + 2% H2 line corresponds to a composition comprising a 49% Earth-like rocky core, a 49% H2O layer, and a 2% H2 envelope by mass. Earth and Venus are identified in this plot as pale blue and orange circles, respectively. |
7.2 Characterization prospects
Super-Earths and sub-Neptunes are among the most abundant types of exoplanets. Yet their formation, atmospheric composition, and interior structure are not well understood, as a variety of compositions can match the average density of these planets. TOI-2084b and TOI-4184 b are part of this mysterious population. The small size and proximity of the host stars as well as their brightness in the infrared make them amenable to further observations by most JWST modes for studying atmospheric compositions.
Given the measured properties, we made an initial exploratory guess of the planet’s composition. We compared their masses and radii with the models from Zeng et al. (2016), shown in Fig. 14. The models predict that TOI-2084 b and TOI-4184 b may have low-density volatiles, such as water, an H/He atmosphere, or a combination of both. Below, we further explore these plausible atmospheres and assess the potential for atmospheric characterization of both TOI-2084 b and TOI-4184 b planets.
As a first approximation of the suitability of both planets for atmospheric investigations, we calculated the transmission spectroscopic metric (TSM) from Kempton et al. (2018), which was developed based on simulations with NIRISS. We estimated the TSMs for TOI-2084b and TOI-4184b to be  and
and  , respectively. With 90 being the threshold for this category of planets, it is worth noting that this metric solely considers the predicted strength of an atmospheric detection when ranking the planets. Having TSM values below the threshold does not necessarily mean that detailed atmospheric studies are impossible or challenging with current facilities. In other words, these metrics do not serve as the sole criterion for determining the best targets for atmospheric studies. To further evaluate the feasibility of characterizing the atmosphere of both planets, we computed synthetic transit spectra from optical to infrared wavelengths (0.5–12 μm) at low spectral resolutions for different atmospheric scenarios (cloud-free H2- and cloudy H2- rich, water-rich). We used petitRADTRANS (Mollière et al. 2019) to compute the model transmission spectra, using the stellar parameters from Table 1 and the planetary parameters from Tables 2 and 3. Our test H2-rich models assume atmospheric chemical equilibrium computed using the FastChem code (Stock et al. 2018) with isothermal profiles at the equilibrium temperature, solar abundances, collisionally induced absorption (CIA) by H2-H2 and H2-He, and Rayleigh scattering. As absorbers, we included H2O, CO2, CO, CH4, NH3, C2H4, and C2H2. For the water-rich scenarios, we assume that the planets are enveloped in a clear, isothermal water-dominated atmosphere composed of 95% H2O and 5% CO2. The model includes the H2O and CO2 Rayleigh scattering cross-sections. We also compare it to a pure water planet (100% H2O) with H2O Rayleigh scattering. An example of the resulting spectra for TOI-4184b is shown in Fig. 15.
As predicted by earlier studies (e.g., Greene et al. 2016; Mollière 2017; Chouqar et al. 2020), the amplitude of the transmission spectra is highly dependent on the presence and altitude of the cloud layer, and on the average molecular weight of the atmosphere: the higher the average molecular weight of the atmosphere, the lower the scale height, and thus the lower the amplitude of the transit spectroscopy signal. The transmission spectra for the H-rich atmospheres show strong absorption features due to H2O, CH4, and NH3 over the wavelength range of 0.5–12 μm (see Fig. 15). The spectroscopic modulations of the cloud-free spectra are on the order of 50–350 ppm and 100-700 ppm for TOI-2084 b and TOI-4184 b, respectively. The cloudy models present smaller absorption features due to the suppression of contributions from deeper atmospheric layers. The features are essentially muted in the cases with 10−4 bar cloud top model for both planets (not shown here). For scenarios discussed above, the mean molecular weight varies from μ = 2 g mol−1 for an atmosphere dominated by molecular hydrogen to μ = 18 g mol−1 for atmospheres dominated by heavier molecules like H2O which explains the weak spectral features seen in the water-rich atmosphere. Additionally, an atmosphere with 95% H2O and 5% CO2 can be distinguished from an atmosphere with 100% H2O because the transit depth within the CO2 band at 4.5 μm would be higher relative to the transit depths in the H2O bands, as shown in Fig. 15. TOI-2084 and TOI-4184 are faint enough to be observable with all of JWST’s instruments. Using the JWST ETC PandExo (Batalha et al. 2017), we evaluated the detectability of the atmospheres of TOI-2084b and TOI-4184b with NIRISS-SOSS (0.6−2.8 μm), NIRSpec-G395M (2.88−5.20 μm) and MIRI-LRS (5−12 μm) instrumental modes for the clear and 10−2 bar cloudy H2-rich and water-rich atmospheric scenarios. Figure 16 shows an example result for a cloudy H2-rich atmosphere with a cloud top at 10−2 bar for TOI-4184b. We find that NIRSpec and NIRISS observations are the most promising for this range of simulated atmospheres. A single transit observation with NIRSpec-G395M mode would be sufficient for robust detection of the molecular features in the clear H2-rich scenarios for both planets, whereas NIRISS-SOSS would require two transits. Two to three transits with NIRSpec-G395M could indeed characterize the atmospheres of TOI-2084 and TOI-4184, respectively, if they have clouds at 10−2 bar. The spectral coverage of transit spectra could be extended to NIR wavelengths with NIRISS-SOSS observations, but this would require three to four times as many transits to give a similar S/N value as that of NIRSpec-G395M.
In summary, our simulations indicate that TOI-2084 b and TOI-4184 b will be great assets for exploring the nature of the atmospheres of sub-Neptunian exoplanets with JWST and the upcoming next generation of space telescopes.
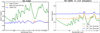 |
Fig. 15 Synthetic transmission spectra of TOI-4184b for different atmospheric compositions. Left panel: transmission spectra for cloud-free H2-rich, water-rich (95% H2O and 5% CO2), and pure water atmospheres. Right panel: transmission spectra for H2-rich cloudy atmosphere with cloud layers at different altitudes (10−2, 10−3, and cloud-free). |
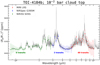 |
Fig. 16 Simulated transmission spectra of TOI-4184 b using NIRISS, NIRSpec, and MIRI instrument modes. This calculation assumes a cloudy H2-rich atmosphere with a cloud top at 10−2 bar. The initially modeled transmission spectrum is plotted in grey. The spectra were binned to a resolution of R = 15. |
Acknowledgements
This paper made use of data collected by the TESS mission and are publicly available from the Mikulski Archive for Space Telescopes (MAST) operated by the Space Telescope Science Institute (STScI). Funding for the TESS mission is provided by NASA’s Science Mission Directorate. We acknowledge the use of public TESS data from pipelines at the TESS Science Office and at the TESS Science Processing Operations Center. Resources supporting this work were provided by the NASA High-End Computing (HEC) Program through the NASA Advanced Supercomputing (NAS) Division at Ames Research Center for the production of the SPOC data products. Some of the observations in the paper made use of the High-Resolution Imaging instruments Alopeke and Zorro obtained under Gemini LLP Proposal Number: GN/S-2021A-LP-105. Alopeke and Zorro were funded by the NASA Exoplanet Exploration Program and built at the NASA Ames Research Center by Steve B. Howell, Nie Scott, Elliott P. Horch, and Emmett Quigley. Alopeke/Zorro was mounted on the Gemini North/South) telescope of the international Gemini Observatory, a program of NSF’s OIR Lab, which is managed by the Association of Universities for Research in Astronomy (AURA) under a cooperative agreement with the National Science Foundation, on behalf of the Gemini partnership: the National Science Foundation (United States), National Research Council (Canada), Agencia Nacional de Investigacion y Desarrollo (Chile), Mnisterio de Ciencia, Tecnologia e Innovacion (Argentina), Mnistério da Ciência, Tecnologia, Inovaçôes e Comunicaçôes (Brazil), and Korea Astronomy and Space Science Institute (Republic of Korea). The research leading to these results has received funding from the ARC grant for Concerted Research Actions, financed by the Wallonia-Brussels Federation. TRAPPIST is funded by the Belgian Fund for Scientific Research (Fond National de la Recherche Scientifique, FNRS) under the grant PDR T.0120.21. TRAPPIST-North is a project funded by the University of Liege (Belgium), in collaboration with Cadi Ayyad University of Marrakech (Morocco). M.G. is F.R.S.-FNRS Research Director and EJ. is F.R.S.-FNRS Senior Research Associate. L.D. is an F.R.S.-FNRS Postdoctoral Researcher. The postdoctoral fellowship of K.B. is funded by F.R.S.-FNRS grant T.0109.20 and by the Francqui Foundation. This publication benefits from the support of the French Community of Belgium in the context of the FRIA Doctoral Grant awarded to MT. This research is in part funded by the European Union’s Horizon 2020 research and innovation program (grants agreements n° 803193/BEBOP), and from the Science and Technology Facilities Council (STFC; grant n° ST/S00193X/1). This work is based upon observations carried out at the Observatorio Astronomico Nacional on the Sierra de San Pedro Mârtir (OAN-SPM), Baja California, Mexico. SAINT-EX observations and team were supported by the Swiss National Science Foundation (PP00P2-163967 and PP00P2-190080), the Centre for Space and Habitability (CSH) of the University of Bern, the National Centre for Competence in Research PlanetS, supported by the Swiss National Science Foundation (SNSF), and UNAM PAPIIT-IG101321. J.d.W. and M.I.T. gratefully acknowledge financial support from the Heising-Simons Foundation, Dr. and Mrs. Colin Masson and Dr. Peter A. Oilman for Artemis, the first telescope of the SPECULOOS network situated in Tenerife, Spain. CM. acknowledges support from the US National Science Foundation grant SPG-1826583. Research at Lick Observatory is partially supported by a generous gift from Google. B.V.R. thanks the Heising-Simons Foundation for support. F.J.P. acknowledges financial support from the grant CEX2021-001131-S funded by MCIN/AEI/ 10.13039/501100011033. T.C.H. received funding from the Europlanet 2024 Research Infrastructure (RI) programme under grant agreement no. 871149. The Europlanet 2024 RI provides free access to the world’s largest collection of planetary simulation and analysis facilities, data services and tools, a ground-based observational network and programme of community support activities. This work is partly supported by JSPS KAKENHI Grant Number JP18H05439 and JST CREST Grant Number JPMJCR1761. This paper is based on observations made with the MuSCAT3 instrument, developed by the Astrobi-ology Center and under financial supports by JSPS KAKENHI (JP18H05439) and JST PRESTO (JPMJPR1775), at Faulkes Telescope North on Maui, HI, operated by the Las Cumbres Observatory. U.G.J. gratefully acknowledges support from the Novo Nordisk Foundation Interdisciplinary Synergy Program grant no. NNF19OC0057374 and from the European Union H2020-MSCA-ITN-2019 under grant no. 860470 (CHAMELEON). This work makes use of observations from the LCOGT network. Part of the LCOGT telescope time was granted by NOIRLab through the Mid-Scale Innovations Program (MSIP). MSIP is funded by NSF. This research has made use of the Exoplanet Follow-up Observation Program (ExoFOP; DOI: 10.26134/ExoFOP5) website, which is operated by the California Institute of Technology, under contract with the National Aeronautics and Space Administration under the Exoplanet Exploration Program. K.A.C. acknowledges support from the TESS mission via subaward s3449 from MIT. We are grateful to the ESO/La Silla staff for their continuous support. We acknowledge funding from the European Research Council under the ERC Grant Agreement n. 337591-ExTrA. We thank the Swiss National Science Foundation (SNSF) and the Geneva University for their continuous support to our planet search programs. This work has been carried out within the framework of the National Centre of Competence in Research PlanetS supported by the Swiss National Science Foundation under grants 51NF40_182901 and 51NF40_205606. The authors acknowledge the financial support of the SNSF. Portions of this work were conducted at Lick Observatory, which was built on the unceded territory of the Ohlone (Costanoans), Tamyen and Muwekma Ohlone tribes, whose people continue to maintain their political sovereignty and cultural traditions as vital members of central and northern California communities.
Appendix A Posterior probability distribution for the TOI-2084 and TOI-4184 systems
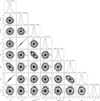 |
Fig. A.1 Posterior probability distribution for the TOI-2084 system stellar and planetary physical parameters fitted using our MCMC code as described in Methods. The vertical lines present the median value. The vertical dashed lines present the median value for each derived parameter. |
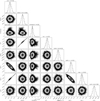 |
Fig. A.2 Posterior probability distribution for the TOI-4184 system stellar and planetary physical parameters fitted using our MCMC code as described in Methods. The vertical lines present the median value. The vertical dashed lines present the median value for each derived parameter. |
References
- Aller, A., Lillo-Box, J., Jones, D., Miranda, L. F., & Barceló Forteza, S. 2020, A&A, 635, A128 [NASA ADS] [CrossRef] [EDP Sciences] [Google Scholar]
- Barkaoui, K., Burdanov, A., Hellier, C., et al. 2019, AJ, 157, 43 [NASA ADS] [CrossRef] [Google Scholar]
- Batalha, N. E., Mandell, A., Pontoppidan, K., et al. 2017, PASP, 129, 064501 [Google Scholar]
- Beard, C., Robertson, P., Kanodia, S., et al. 2022, AJ, 163, 286 [NASA ADS] [CrossRef] [Google Scholar]
- Bochanski, J. J., West, A. A., Hawley, S. L., & Covey, K. R. 2007, AJ, 133, 531 [NASA ADS] [CrossRef] [Google Scholar]
- Bonfils, X., Almenara, J. M., Jocou, L., et al. 2015, SPIE Conf. Ser., 9605, 96051L [NASA ADS] [Google Scholar]
- Bouchy, F. 2021, https://zenodo.org/record/5635581 [Google Scholar]
- Brown, T. M., Baliber, N., Bianco, F. B., et al. 2013, PASP, 125, 1031 [Google Scholar]
- Burdanov, A. Y., de Wit, J., Gillon, M., et al. 2022, PASP, 134, 105001 [CrossRef] [Google Scholar]
- Burgasser, A. J., & Splat Development Team. 2017, ASP Conf. Ser., 14, 7 [NASA ADS] [Google Scholar]
- Cadieux, C., Doyon, R., Plotnykov, M., et al. 2022, AJ, 164, 96 [NASA ADS] [CrossRef] [Google Scholar]
- Chambers, K. C., Magnier, E. A., Metcalfe, N., et al. 2016, ArXiv e-prints [arXiv:1612.05560] [Google Scholar]
- Chen, J., & Kipping, D. 2017, ApJ, 834, 17 [Google Scholar]
- Chouqar, J., Benkhaldoun, Z., Jabiri, A., et al. 2020, MNRAS, 495, 962 [NASA ADS] [CrossRef] [Google Scholar]
- Claret, A., Hauschildt, P. H., & Witte, S. 2012, A&A, 546, A14 [NASA ADS] [CrossRef] [EDP Sciences] [Google Scholar]
- Cointepas, M., Almenara, J. M., Bonfils, X., et al. 2021, A&A, 650, A145 [NASA ADS] [CrossRef] [EDP Sciences] [Google Scholar]
- Collins, K. A., Kielkopf, J. F., Stassun, K. G., & Hessman, F. V. 2017, AJ, 153, 77 [Google Scholar]
- Correa-Otto, J. A., & Gil-Hutton, R. A. 2017, A&A, 608, A116 [NASA ADS] [CrossRef] [EDP Sciences] [Google Scholar]
- Cutri, R. M., Wright, E. L., Conrow, T., et al. 2021, VizieR Online Data Catalog: II/328 [Google Scholar]
- Delrez, L., Gillon, M., Queloz, D., et al. 2018, Proc. SPIE, 10700, 107001I [Google Scholar]
- Delrez, L., Murray, C. A., Pozuelos, F. J., et al. 2022, A&A, 667, A59 [NASA ADS] [CrossRef] [EDP Sciences] [Google Scholar]
- Demory, B. O., Pozuelos, F. J., Gómez Maqueo Chew, Y., et al. 2020, A&A, 642, A49 [NASA ADS] [CrossRef] [EDP Sciences] [Google Scholar]
- Dominik, M., Jørgensen, U. G., Rattenbury, N. J., et al. 2010, Astron. Nachr., 331, 671 [NASA ADS] [CrossRef] [Google Scholar]
- Eastman, J., Siverd, R., & Gaudi, B. S. 2010, PASP, 122, 935 [Google Scholar]
- Esparza-Borges, E., Parviainen, H., Murgas, F., et al. 2022, A&A, 666, A10 [NASA ADS] [CrossRef] [EDP Sciences] [Google Scholar]
- Fulton, B. J., & Petigura, E. A. 2018, AJ, 156, 264 [Google Scholar]
- Gaia Collaboration (Helmi, A., et al.) 2018, A&A, 616, A12 [NASA ADS] [CrossRef] [EDP Sciences] [Google Scholar]
- Gaia Collaboration (Brown, A. G. A., et al.) 2021, A&A, 650, C3 [EDP Sciences] [Google Scholar]
- Gan, T., Soubkiou, A., Wang, S. X., et al. 2022, MNRAS, 514, 4120 [CrossRef] [Google Scholar]
- Garcia, L. J., Timmermans, M., Pozuelos, F. J., et al. 2022, MNRAS, 509, 4817 [Google Scholar]
- Gelman, A., & Rubin, D. B. 1992, Stat. Sci., 7, 457 [Google Scholar]
- Giacalone, S., Dressing, C. D., Jensen, E. L. N., et al. 2021, AJ, 161, 24 [Google Scholar]
- Gillon, M., Jehin, E., Magain, P., et al. 2011, EPJ Web Conf., 11, 06002 [NASA ADS] [CrossRef] [EDP Sciences] [Google Scholar]
- Gillon, M., Triaud, A. H. M. J., Fortney, J. J., et al. 2012, A&A, 542, A4 [NASA ADS] [CrossRef] [EDP Sciences] [Google Scholar]
- Greene, T. P., Line, M. R., Montero, C., et al. 2016, ApJ, 817, 17 [NASA ADS] [CrossRef] [Google Scholar]
- Guerrero, N. M., Seager, S., Huang, C. X., et al. 2021, ApJS, 254, 39 [NASA ADS] [CrossRef] [Google Scholar]
- Günther, M.N.M., & Daylan, T. 2021, ApJS, 254, 13 [CrossRef] [Google Scholar]
- Hamuy, M., Walker, A. R., Suntzeff, N. B., et al. 1992, PASP, 104, 533 [NASA ADS] [CrossRef] [Google Scholar]
- Hamuy, M., Suntzeff, N. B., Heathcote, S. R., et al. 1994, PASP, 106, 566 [NASA ADS] [CrossRef] [Google Scholar]
- Hastings, W. K. 1970, Biometrika, 57, 97 [Google Scholar]
- Henry, T. J., Kirkpatrick, J. D., & Simons, D. A. 1994, AJ, 108, 1437 [NASA ADS] [CrossRef] [Google Scholar]
- Hippke, M., & Heller, R. 2019, A&A, 623, A39 [NASA ADS] [CrossRef] [EDP Sciences] [Google Scholar]
- Howell, S. B., Everett, M. E., Sherry, W., Horch, E., & Ciardi, D. R. 2011, AJ, 142, 19 [Google Scholar]
- Howell, S. B., Everett, M. E., Horch, E. P., et al. 2016, ApJ, 829, L2 [NASA ADS] [CrossRef] [Google Scholar]
- Huang, C. X., Vanderburg, A., Pál, A., et al. 2020, RNAAS, 4, 204 [Google Scholar]
- Jehin, E., Gillon, M., Queloz, D., et al. 2011, The Messenger, 145, 2 [NASA ADS] [Google Scholar]
- Jehin, E., Gillon, M., Queloz, D., et al. 2018, The Messenger, 174, 2 [NASA ADS] [Google Scholar]
- Jenkins, J. M. 2002, ApJ, 575, 493 [Google Scholar]
- Jenkins, J. M., Chandrasekaran, H., McCauliff, S. D., et al. 2010, SPIE Conf. Ser., 7740, 77400D [Google Scholar]
- Jenkins, J. M., Twicken, J. D., McCauliff, S., et al. 2016, SPIE Conf. Ser., 9913, 99133E [Google Scholar]
- Jensen, E. 2013, Astrophysics Source Code Library [record ascl:1306.007] [Google Scholar]
- Kaltenegger, L., & Traub, W. A. 2009, ApJ, 698, 519 [Google Scholar]
- Kempton, E. M. R., Bean, J. L., Louie, D. R., et al. 2018, PASP, 130, 114401 [Google Scholar]
- Kipping, D. M. 2013, MNRAS, 435, 2152 [Google Scholar]
- Kirkpatrick, J. D., Reid, I. N., Liebert, J., et al. 1999, ApJ, 519, 802 [NASA ADS] [CrossRef] [Google Scholar]
- Kirkpatrick, J. D., Looper, D. L., Burgasser, A. J., et al. 2010, ApJS, 190, 100 [Google Scholar]
- Kossakowski, D., Kemmer, J., Bluhm, P., et al. 2021, A&A, 656, A124 [NASA ADS] [CrossRef] [EDP Sciences] [Google Scholar]
- Lasker, B. M., Doggett, J., McLean, B., et al. 1996, ASP Conf. Ser., 101, 88 [NASA ADS] [Google Scholar]
- Lépine, S., Rich, R. M., & Shara, M. M. 2003, AJ, 125, 1598 [CrossRef] [Google Scholar]
- Lépine, S., Rich, R. M., & Shara, M. M. 2007, ApJ, 669, 1235 [CrossRef] [Google Scholar]
- Li, J., Tenenbaum, P., Twicken, J. D., et al. 2019, PASP, 131, 024506 [NASA ADS] [CrossRef] [Google Scholar]
- Lightkurve Collaboration (Cardoso, J. V. D. M., et al.) 2018, Astrophysics Source Code Library [record ascl:1812.013] [Google Scholar]
- Mandel, K., & Agol, E. 2002, ApJ, 580, L171 [Google Scholar]
- Mann, A. W., Brewer, J. M., Gaidos, E., Lépine, S., & Hilton, E. J. 2013, AJ, 145, 52 [Google Scholar]
- Mann, A. W., Deacon, N. R., Gaidos, E., et al. 2014, AJ, 147, 160 [CrossRef] [Google Scholar]
- Mann, A. W., Dupuy, T., Kraus, A. L., et al. 2019, ApJ, 871, 63 [Google Scholar]
- Mazeh, T., Holczer, T., & Faigler, S. 2016, A&A, 589, A75 [NASA ADS] [CrossRef] [EDP Sciences] [Google Scholar]
- McCully, C., Volgenau, N. H., Harbeck, D.-R., et al. 2018, SPIE Conf. Ser., 10707, 107070K [Google Scholar]
- Metropolis, N., Rosenbluth, A. W., Rosenbluth, M. N., Teller, A. H., & Teller, E. 1953, J. Chem. Phys., 21, 1087 [Google Scholar]
- Miller, J. S., & Stone, R. P. S. 1994, The Kast Double Spectrograph, Tech. Rep. 66, University of California Lick Observatory Technical Reports [Google Scholar]
- Minkowski, R. L., & Abell, G. O. 1963, Stars and Stellar Systems Vol. III, Basic Astronomical Data, ed. K. Aa. Strand (Chicago: The University of Chicago Press), 481 [Google Scholar]
- Mollière, P. M. 2017, PhD thesis, Ruprecht-Karls University of Heidelberg, Germany [Google Scholar]
- Mollière, P., Wardenier, J. P., van Boekel, R., et al. 2019, A&A, 627, A67 [Google Scholar]
- Narita, N., Fukui, A., Yamamuro, T., et al. 2020, SPIE Conf. Ser., 11447, 114475K [NASA ADS] [Google Scholar]
- Nutzman, P., & Charbonneau, D. 2008, PASP, 120, 317 [Google Scholar]
- Owen, J. E., & Wu, Y. 2013, ApJ, 775, 105 [Google Scholar]
- Pepe, F., Cristiani, S., Rebolo, R., et al. 2021, A&A, 645, A96 [NASA ADS] [CrossRef] [EDP Sciences] [Google Scholar]
- Pozuelos, F. J., Suárez, J. C., de Elía, G. C., et al. 2020, A&A, 641, A23 [NASA ADS] [CrossRef] [EDP Sciences] [Google Scholar]
- Pozuelos, F. J., Timmermans, M., Rackham, B. V., et al. 2023, A&A, 672, A70 [NASA ADS] [CrossRef] [EDP Sciences] [Google Scholar]
- Quirrenbach, A., Amado, P. J., Caballero, J. A., et al. 2014, IAU Symp., 293, 177 [NASA ADS] [Google Scholar]
- Reefe, M. A., Luque, R., Gaidos, E., et al. 2022, AJ, 163, 269 [NASA ADS] [CrossRef] [Google Scholar]
- Ricker, G. R., Winn, J. N., Vanderspek, R., et al. 2015, J. Astron. Telesc. Instrum. Syst., 1, 014003 [Google Scholar]
- Rojas-Ayala, B., Covey, K. R., Muirhead, P. S., & Lloyd, J. P. 2012, ApJ, 748, 93 [Google Scholar]
- Schanche, N., Pozuelos, F. J., Günther, M. N., et al. 2022, A&A, 657, A45 [NASA ADS] [CrossRef] [EDP Sciences] [Google Scholar]
- Schwarz, G. 1978, Ann. Statist., 6, 461 [Google Scholar]
- Scott, N. J., Howell, S. B., Gnilka, C. L., et al. 2021, Front. Astron. Space Sci., 8, 138 [NASA ADS] [CrossRef] [Google Scholar]
- Sebastian, D., Gillon, M., Ducrot, E., et al. 2021, A&A, 645, A100 [EDP Sciences] [Google Scholar]
- Seifahrt, A., Bean, J. L., Stürmer, J., et al. 2020, Proc. SPIE, 11447, 305 [Google Scholar]
- Simcoe, R. A., Burgasser, A. J., Bernstein, R. A., et al. 2008, SPIE Conf. Ser., 7014, 70140U [NASA ADS] [Google Scholar]
- Skrutskie, M. F., Cutri, R. M., Stiening, R., et al. 2006, AJ, 131, 1163 [NASA ADS] [CrossRef] [Google Scholar]
- Smith, J. C., Stumpe, M. C., Van Cleve, J. E., et al. 2012, PASP, 124, 1000 [Google Scholar]
- Southworth, J. 2011, MNRAS, 417, 2166 [Google Scholar]
- Southworth, J., Hinse, T. C., Jørgensen, U. G., et al. 2009, MNRAS, 396, 1023 [NASA ADS] [CrossRef] [Google Scholar]
- Southworth, J., Hinse, T. C., Burgdorf, M., et al. 2014, MNRAS, 444, 776 [CrossRef] [Google Scholar]
- Stassun, K. G., & Torres, G. 2016, AJ, 152, 180 [Google Scholar]
- Stassun, K. G., & Torres, G. 2018, ApJ, 862, 61 [Google Scholar]
- Stassun, K. G., & Torres, G. 2021, ApJ, 907, L33 [NASA ADS] [CrossRef] [Google Scholar]
- Stassun, K. G., Collins, K. A., & Gaudi, B. S. 2017, AJ, 153, 136 [Google Scholar]
- Stassun, K. G., Oelkers, R. J., Pepper, J., et al. 2018, AJ, 156, 102 [Google Scholar]
- Stetson, P. B. 1987, PASP, 99, 191 [Google Scholar]
- Stock, J. W., Kitzmann, D., Patzer, A. B. C., & Sedlmayr, E. 2018, MNRAS, 479, 865 [NASA ADS] [Google Scholar]
- Stumpe, M. C., Smith, J. C., Van Cleve, J. E., et al. 2012, PASP, 124, 985 [Google Scholar]
- Stumpe, M. C., Smith, J. C., Catanzarite, J. H., et al. 2014, PASP, 126, 100 [Google Scholar]
- Twicken, J. D., Catanzarite, J. H., Clarke, B. D., et al. 2018, PASP, 130, 064502 [Google Scholar]
- Van Eylen, V., Agentoft, C., Lundkvist, M. S., et al. 2018, MNRAS, 479, 4786 [Google Scholar]
- Van Grootel, V., Pozuelos, F. J., Thuillier, A., et al. 2021, A&A, 650, A205 [NASA ADS] [CrossRef] [EDP Sciences] [Google Scholar]
- Waalkes, W. C., Berta-Thompson, Z. K., Collins, K. A., et al. 2021, AJ, 161, 13 [NASA ADS] [CrossRef] [Google Scholar]
- Wells, R. D., Rackham, B. V., Schanche, N., et al. 2021, A&A, 653, A97 [NASA ADS] [CrossRef] [EDP Sciences] [Google Scholar]
- West, A. A., Hawley, S. L., Bochanski, J. J., et al. 2008, AJ, 135, 785 [Google Scholar]
- Winters, J. G., Henry, T. J., Lurie, J. C., et al. 2014, AJ, 149, 5 [NASA ADS] [CrossRef] [Google Scholar]
- Winters, J. G., Medina, A. A., Irwin, J. M., et al. 2019, AJ, 158, 152 [Google Scholar]
- Zacharias, N., Finch, C. T., Girard, T. M., et al. 2012, VizieR Online Data Catalog: I/322A [Google Scholar]
- Zechmeister, M., & Kürster, M. 2009, A&A, 496, 577 [CrossRef] [EDP Sciences] [Google Scholar]
- Zeng, L., Sasselov, D. D., & Jacobsen, S. B. 2016, ApJ, 819, 127 [Google Scholar]
NASA Archive of Exoplanets: https://exoplanetarchive.ipac.caltech.edu/
SHERLOCK (Searching for Hints of Exoplanets fRom Lightcurves Of spaCe-based seeKers) code is fully available on GitHub: https://github.com/franpoz/SHERLOCK
All Tables
Astrometry, photometry, and spectroscopy stellar properties of TOI-2084 and TOI-4184.
TOI-2084 system parameters derived from our global MCMC analysis (medians and 1σ).
TOI-4184 system parameters derived from our global MCMC analysis (medians and 1σ).
Observational parameters: date of observation, filter used, telescope, exposure time(s), photometric aperture size, and FWHM of the point-spread function.
All Figures
|
Fig. 1 TESS target pixel file images of TOI-2084 observed in Sector 16 (left panel) and TOI-4184 observed in Sector 1 (right panel), made by tpfplotter (Aller et al. 2020). Red dots show the location of Gaia DR3 sources, and the red shaded region shows the photometric apertures used to extract the photometric measurements. |
| In the text | |
|
Fig. 2 Phase-folded TESS transit light curves of TOI-2081.01 (left) and TOI-4184.01 (right). The points with the error bar are data binned to 15 min. |
| In the text | |
|
Fig. 3 TESS photometric data of TOI-2084.01 and TOI-4184.01. The gray points show the PDSAP fluxes obtained from the SPOC pipeline. The red and blue points correspond to the location of the transit for the candidates TOI-2084.01 and TOI-4184.01, respectively. |
| In the text | |
|
Fig. 4 Ground-based photometric light curves of TOI-2081.01 (left) and TOI-4184.01 (right). The gray points show the unbinned data and the black points are data binned at 10 min. The coloured lines are the best-fitting transit model. The light curves are shifted along the y-axis for visibility. |
| In the text | |
|
Fig. 5 Magellan/FIRE spectrum of TOI-4184. The SpeX Prism spectrum of the M5.0 standard Wolf 47 and M6.0 standard LHS 1375 (Kirkpatrick et al. 2010) are shown for comparison. Strong M dwarf spectral features are indicated, and high-telluric regions are shaded. Lines along the bottom of the plot give the uncertainties associated with the spectra. |
| In the text | |
|
Fig. 6 High resolution imaging of TOI-2084 and TOI-4184 shows they are both single stars with no companion brighter than 4–6 magnitudes below that of the target star. Left panel: Gemini-North/Alopeke high resolution image of TOI-2084 observed on UTC June 24 2021. Right panel: Gemini-South/Zorro high-resolution image of TOI-4184 observed on UTC December 23 2021. |
| In the text | |
|
Fig. 7 SED fit of TOI-2084 (right) and TOI-4184 (left). The gray curves are the best-fitting NextGen atmosphere model, coloured symbols with error-bars are the observed fluxes, and black symbols are the model fluxes. |
| In the text | |
|
Fig. 8 Shane/Kast red optical spectra (black lines) of TOI-2084 (left) and its wide stellar companion TOI-2084B (right) compared to the best-fit M2 and M8 SDSS spectral templates from Bochanski et al. (2007, magenta lines). The lower panels display the difference between these spectra (black line) compared to the ±1σ measurement uncertainty (grey band). Key features are labeled, including the strong telluric O2 band at 7600 Å (⊕). Inset boxes show close-ups of the region around the 6563 Å Hα and 6708 Å Li I lines. |
| In the text | |
|
Fig. 9 Field images cropped on a 1′×1′ region around TOI-2084 (top row) and TOI-4184 (bottom row). The current position of the target stars is shown with the yellow circle. Top row: 1953 red image from POSS I/DSS, 1953 infrared image from POSS II/DSS2, 2012 z′ image from PanSTARRS 1, and 2021 I+z image from SPECULOOS-North (from left to right). Bottom row: 1977 blue image from POSS II/DSS2, 1989 red image from POSS II/DSS2, 1990 infrared image from POSS II/DSS2, and 2021 image z′ from SPECULOOS-South (from left to right). |
| In the text | |
|
Fig. 10 TOI-2084 light curves obtained with ground-based facilities. Left panel: light curve obtained with SPECULOOS-North in the I+z Alter on UTC August 17 2020. Middle panel: TOI-2084 field-of-view with nearby stars. The wide co-moving companion TOI 2084B is directly south. Right panel: light curve obtained with LCO-McD in the Sloan-i′ filter on UTC August 26 2020. Red and blue data points show the target (T1) and nearby star (T3) light curves, respectively. During the expected transit of TOI-2084.02, we twice detected a deep eclipse (≈400 ppt) on the nearby star TIC 1271317080 (ΔT = 4.98) at 12.9″ from the target, labeled T3. |
| In the text | |
|
Fig. 11 Transit depths measured for multi-band photometric follow-up of TOI-2084.01 (top panel) and TOI-4184.01 (bottom panel). Solid horizontal lines correspond to the TESS measured transit depth. |
| In the text | |
|
Fig. 12 Generalised Lomb-Scargle periodogram (GLS, Zechmeister & Kürster 2009) for TOI-2084.01 (top) and TOI-4184.01 (bottom) TESS data. |
| In the text | |
|
Fig. 13 Period-Radius diagram of known transiting exoplanets from NASA Archive of Exoplanets. The blue and orange data points correspond to the TESS FGK and M dwarf systems, respectively. The green and red stars show TOI-2084 b and TOI-4184 b, respectively. The yellow region shows the boundaries of the sub-Neptune-desert determined by Mazeh et al. (2016). |
| In the text | |
|
Fig. 14 Mass-radius diagram of exoplanets with mass-radius measurements better than 25% from TEPCat (Southworth 2011) and for our candidates, color-coded by their equilibrium temperature. Two-layer models from Zeng et al. (2016) are displayed with different lines and colors. Here, “Earth-like” refers to a composition of 30% Fe and 70% MgSiO3. The 2% H2 line represents a composition consisting of a 98% Earth-like rocky core and a 2% H2 envelope by mass, while the 49% H2O + 2% H2 line corresponds to a composition comprising a 49% Earth-like rocky core, a 49% H2O layer, and a 2% H2 envelope by mass. Earth and Venus are identified in this plot as pale blue and orange circles, respectively. |
| In the text | |
|
Fig. 15 Synthetic transmission spectra of TOI-4184b for different atmospheric compositions. Left panel: transmission spectra for cloud-free H2-rich, water-rich (95% H2O and 5% CO2), and pure water atmospheres. Right panel: transmission spectra for H2-rich cloudy atmosphere with cloud layers at different altitudes (10−2, 10−3, and cloud-free). |
| In the text | |
|
Fig. 16 Simulated transmission spectra of TOI-4184 b using NIRISS, NIRSpec, and MIRI instrument modes. This calculation assumes a cloudy H2-rich atmosphere with a cloud top at 10−2 bar. The initially modeled transmission spectrum is plotted in grey. The spectra were binned to a resolution of R = 15. |
| In the text | |
|
Fig. A.1 Posterior probability distribution for the TOI-2084 system stellar and planetary physical parameters fitted using our MCMC code as described in Methods. The vertical lines present the median value. The vertical dashed lines present the median value for each derived parameter. |
| In the text | |
|
Fig. A.2 Posterior probability distribution for the TOI-4184 system stellar and planetary physical parameters fitted using our MCMC code as described in Methods. The vertical lines present the median value. The vertical dashed lines present the median value for each derived parameter. |
| In the text | |
Current usage metrics show cumulative count of Article Views (full-text article views including HTML views, PDF and ePub downloads, according to the available data) and Abstracts Views on Vision4Press platform.
Data correspond to usage on the plateform after 2015. The current usage metrics is available 48-96 hours after online publication and is updated daily on week days.
Initial download of the metrics may take a while.