Open Access
Fig. 4
Download original image
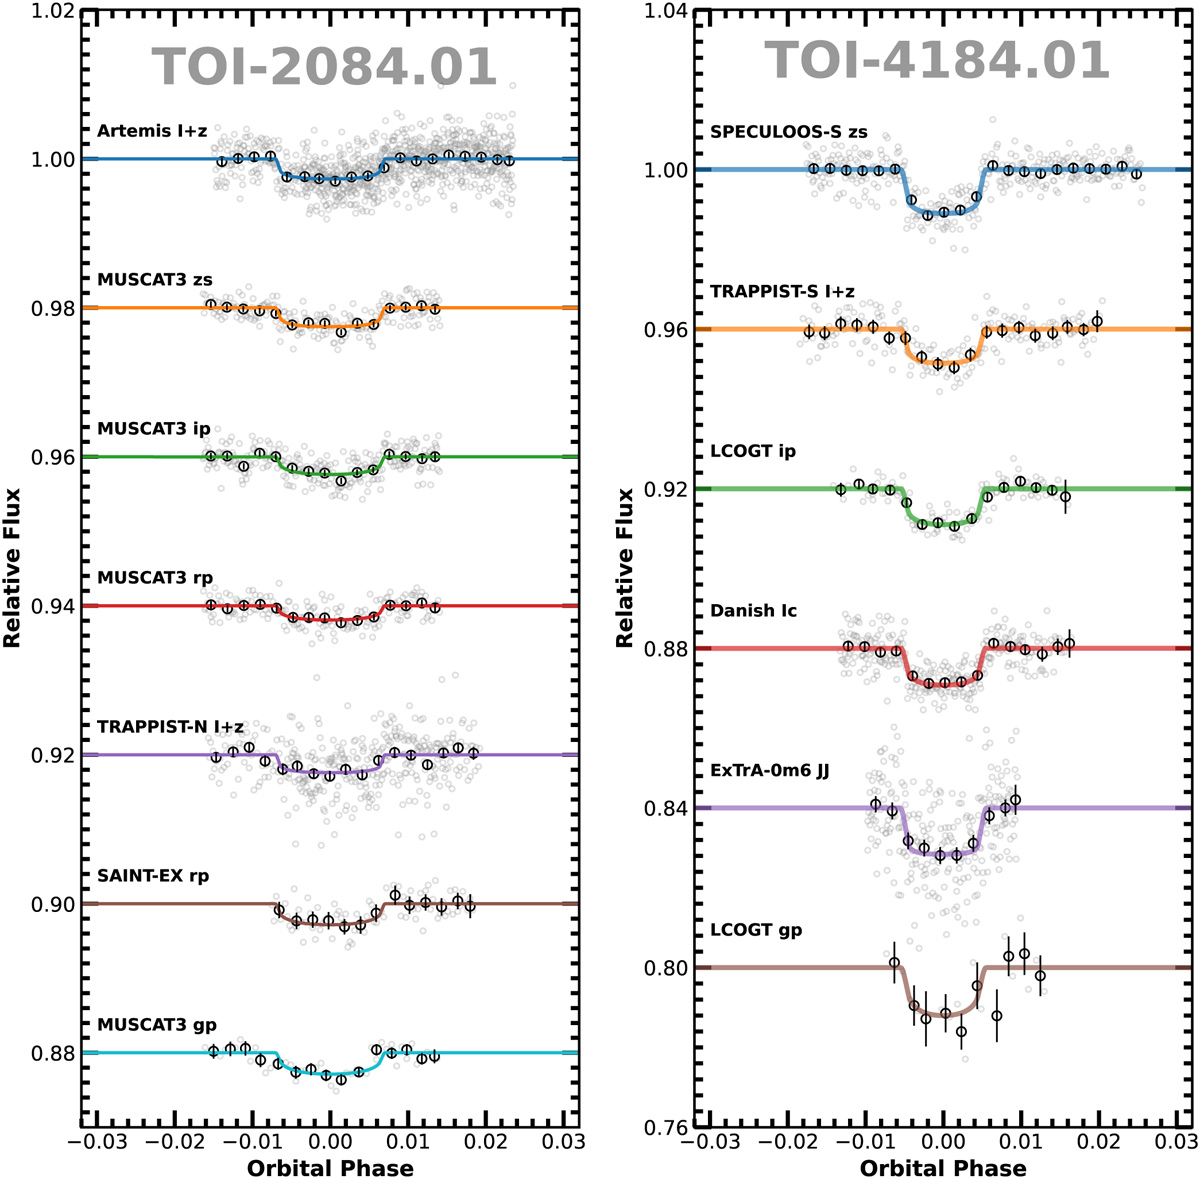
Ground-based photometric light curves of TOI-2081.01 (left) and TOI-4184.01 (right). The gray points show the unbinned data and the black points are data binned at 10 min. The coloured lines are the best-fitting transit model. The light curves are shifted along the y-axis for visibility.
Current usage metrics show cumulative count of Article Views (full-text article views including HTML views, PDF and ePub downloads, according to the available data) and Abstracts Views on Vision4Press platform.
Data correspond to usage on the plateform after 2015. The current usage metrics is available 48-96 hours after online publication and is updated daily on week days.
Initial download of the metrics may take a while.