Fig. 8
Download original image
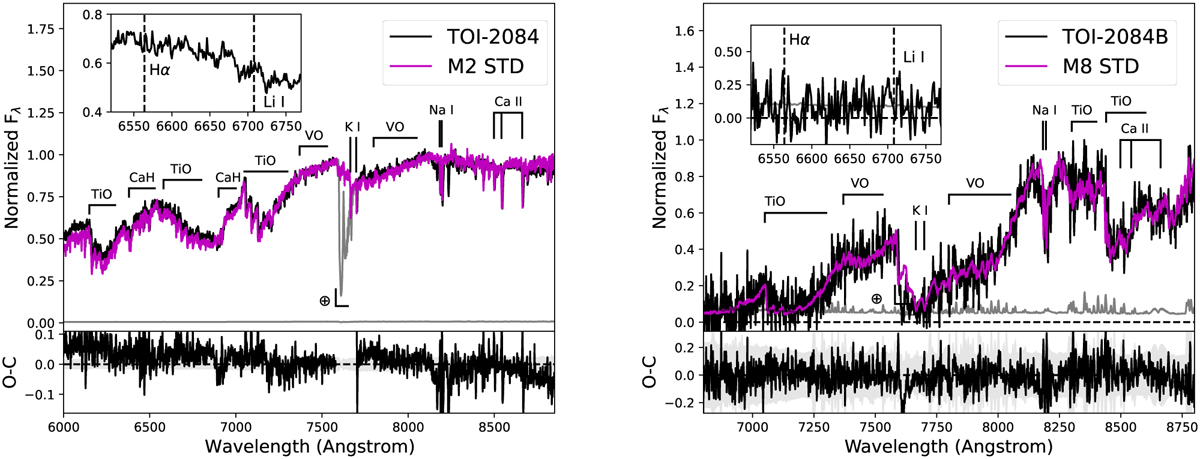
Shane/Kast red optical spectra (black lines) of TOI-2084 (left) and its wide stellar companion TOI-2084B (right) compared to the best-fit M2 and M8 SDSS spectral templates from Bochanski et al. (2007, magenta lines). The lower panels display the difference between these spectra (black line) compared to the ±1σ measurement uncertainty (grey band). Key features are labeled, including the strong telluric O2 band at 7600 Å (⊕). Inset boxes show close-ups of the region around the 6563 Å Hα and 6708 Å Li I lines.
Current usage metrics show cumulative count of Article Views (full-text article views including HTML views, PDF and ePub downloads, according to the available data) and Abstracts Views on Vision4Press platform.
Data correspond to usage on the plateform after 2015. The current usage metrics is available 48-96 hours after online publication and is updated daily on week days.
Initial download of the metrics may take a while.