Open Access
Fig. 3
Download original image
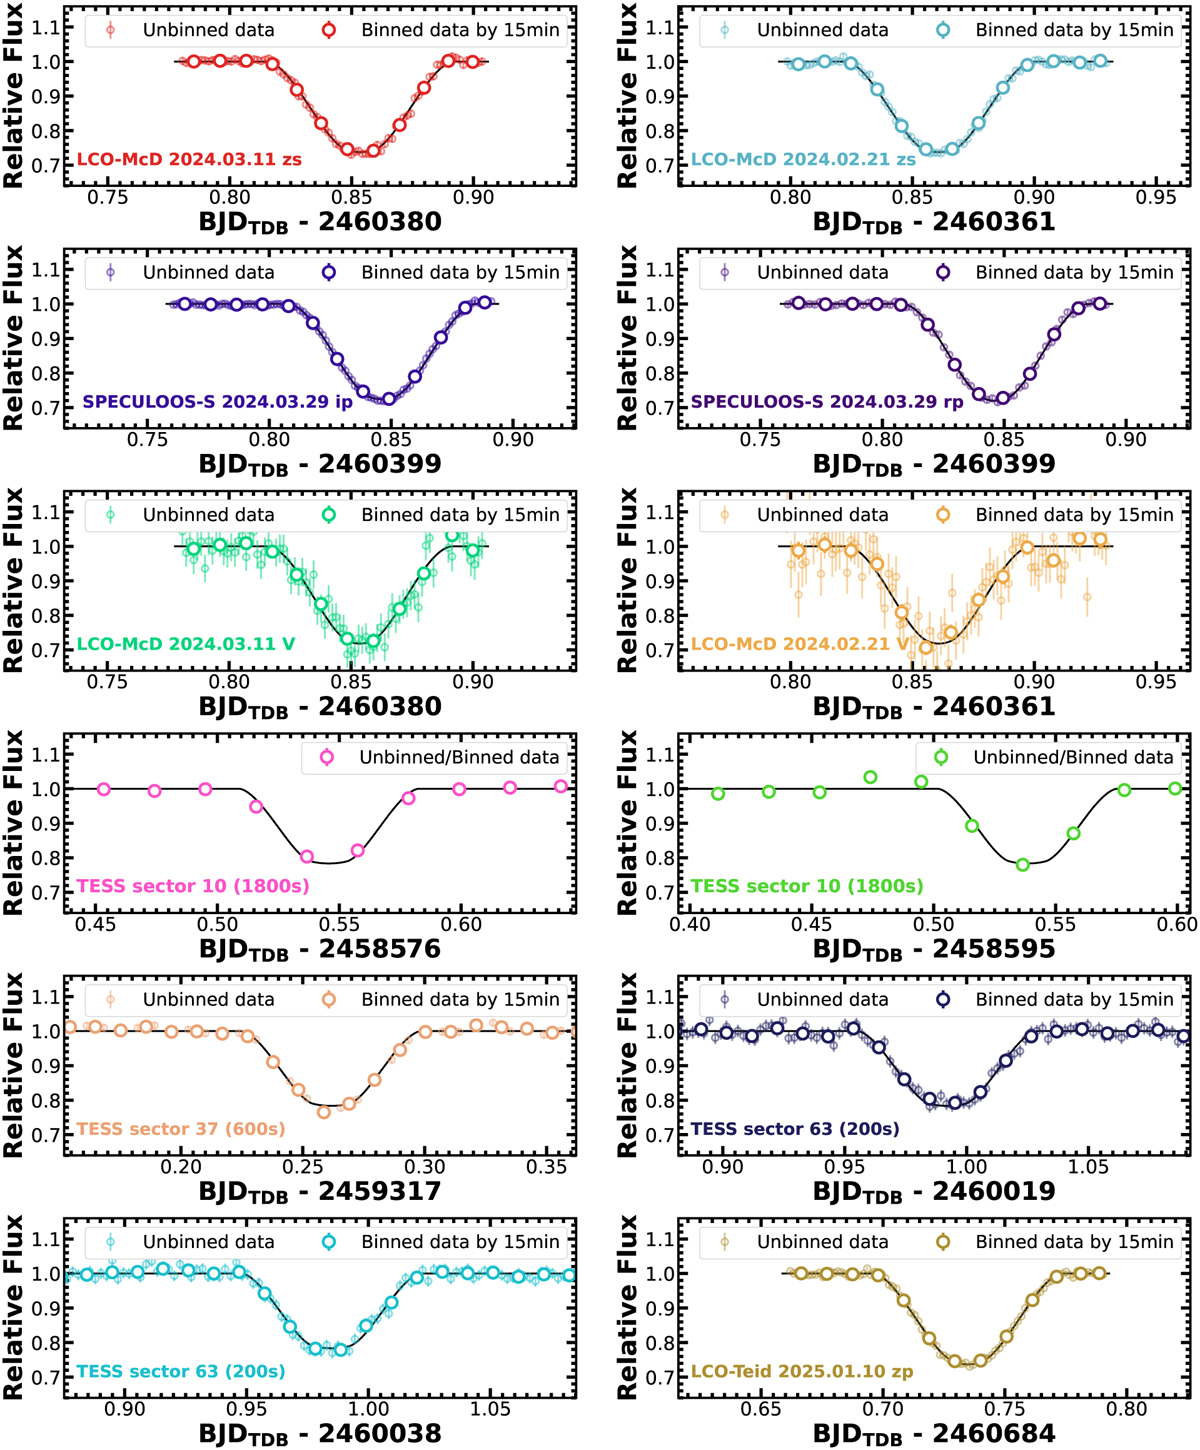
Individual TESS (Sectors 10, 37 and 63) and ground-based (collected with SPECULOOS-S-1.0m and LCOGT-1.0m) light curves of TOI-6508 b. The colored data points show the relative flux measurements (unbinned and binned data). The black solid lines show the best-fitting transit model.
Current usage metrics show cumulative count of Article Views (full-text article views including HTML views, PDF and ePub downloads, according to the available data) and Abstracts Views on Vision4Press platform.
Data correspond to usage on the plateform after 2015. The current usage metrics is available 48-96 hours after online publication and is updated daily on week days.
Initial download of the metrics may take a while.