| Issue |
A&A
Volume 696, April 2025
|
|
|---|---|---|
| Article Number | L16 | |
| Number of page(s) | 9 | |
| Section | Letters to the Editor | |
| DOI | https://doi.org/10.1051/0004-6361/202452913 | |
| Published online | 25 April 2025 | |
Letter to the Editor
First detections of CO absorption in the Magellanic Clouds and direct measurement of the CO-to-H2 ratio
1
Ioffe Institute, Polyteknicheskaya ul. 26, 194021 Saint-Petersburg, Russia
2
Institut d’Astrophysique de Paris, CNRS-SU, UMR 7095, 98bis bd Arago, 75014 Paris, France
⋆ Corresponding author: This email address is being protected from spambots. You need JavaScript enabled to view it.
Received:
6
November
2024
Accepted:
13
March
2025
Abstract
Molecular hydrogen (H2) is by far the most abundant molecule in the Universe. However, due to the low emissivity of H2, carbon monoxide (CO) is widely used instead to trace molecular gas in galaxies. The relative abundances of these molecules is expected to depend on both physical (e.g. density) and chemical (e.g. metal enrichment) properties of the gas, making direct measurements in diverse environments crucial. We present a systematic search for CO in absorption towards 34 stars behind H2 gas in the Magellanic Clouds using the Hubble Space Telescope. We report the first two definitive detections of CO absorption in the Large Magellanic Cloud (LMC) and one in the Small Magellanic Cloud (SMC), along with stringent upper limits for the remaining sightlines. Non-detections of CO are consistent with models of low thermal pressures and/or low metallicities while detections at the lower metallicities of the Magellanic Clouds require higher thermal pressures, Pth = 105 − 106 K cm−3 than detections the Milky Way at similar N(H2). Notably, the high density derived from the rotational excitation of CO towards Sk 143 in the SMC suggests full molecularisation of CO in the absorbing cloud, with CO/H2 = 8.3−1.6+2.0 × 10⁻⁵ consistent with the standard ratio (3.2 × 10⁻⁴) measured in dense molecular gas in the Milky Way, scaled to the SMC’s 0.2 Z⊙ metallicity.
Key words: ISM: clouds / ISM: molecules / galaxies: abundances
© The Authors 2025
 Open Access article, published by EDP Sciences, under the terms of the Creative Commons Attribution License (https://creativecommons.org/licenses/by/4.0), which permits unrestricted use, distribution, and reproduction in any medium, provided the original work is properly cited.
This article is published in open access under the Subscribe to Open model. This email address is being protected from spambots. You need JavaScript enabled to view it. to support open access publication.
1. Introduction
The Small and Large Magellanic Clouds (SMC and LMC) are nearby dwarf galaxies that tidally interact with the Milky Way (MW) and exhibit lower average metallicities than it does (Russell & Dopita 1992; Kosenko et al. 2024). The proximity of the Magellanic Clouds (MCs) has enabled extensive studies across the entire electromagnetic spectrum, from radio (e.g. Brüns et al. 2005 to γ-rays (e.g. Abdo et al. 2010a,b). Notably, the molecular gas in the interstellar medium (ISM) of these galaxies has long been investigated through carbon monoxide (CO) emission (see review by Fukui & Kawamura 2010). While emission line studies provide a global view of the molecular content, they are mostly sensitive to dense and warm molecular gas producing lines (e.g. from HCO+) and high rotational CO transitions. Moreover, these studies are limited by the resolution of the telescopes, which at the distance of the MCs (Pietrzyński et al. 2019; Graczyk et al. 2020), corresponds to physical scales ranging from ∼40 pc for NANTEN (e.g. Mizuno et al. 2001; Fukui et al. 2008 to ≲0.4 pc for ALMA (e.g. Indebetouw et al. 2013; Jameson et al. 2018).
Absorption line studies towards bright point-like sources such as stars or quasars offer a more detailed view of local gas properties. Not only do these sources probe low-excitation and diffuse gas (i.e. including CO-dark molecular gas that remains invisible in CO emission), but they also permit accurate simultaneous measurements of the species column densities. The angular sizes of these sources are also much smaller than typical ISM structures, virtually eliminating transverse spatial averaging. Although some averaging along the line of sight is inevitable, velocity decomposition in absorption line profiles reduces this effect.
Absorption studies laid the foundation for our discovery of the ISM and our basic understanding of its properties. The first detection of H2 absorption in the ISM (Carruthers 1970) was soon followed by that of CO (Smith & Stecher 1971), opening the way to the study of both molecules using larger samples of bright nearby stars (e.g. Savage et al. 1977; Federman et al. 1980). A few decades later, the Hubble Space Telescope (HST) enabled more detailed studies of the physical properties of CO-bearing gas along Galactic sightlines (Sheffer et al. 2007, 2008), and resolved its rotational population (Sonnentrucker et al. 2007). At the same time, large ground-based telescopes led to the detection of electronic CO absorption in intervening galaxies at z ∼ 1.7 − 2.7 towards background quasars (Srianand et al. 2008; Noterdaeme et al. 2009, 2010, 2011, 2017, 2018, and possibly Ma et al. 2015), and at z ∼ 3 in the host galaxy of a γ-ray burst (Prochaska et al. 2009). We also note the recent detection of intervening CO absorption in the radio domain at z = 0.05 towards a z = 1.3 quasar by Combes et al. (2019). CO has also been detected in absorption within circumnuclear regions in active galaxies through radio observations (Emonts et al. 2024) and IR observations (Shirahata et al. 2013; Onishi et al. 2021; Ohyama et al. 2023).
It is hence somewhat paradoxical that possible CO absorption has only been reported along three sightlines through the MCs to date: SK −67 5, SK −68 135, and SK −69 246 (Bluhm & de Boer 2001; André et al. 2004)1. These claims were based solely on data around the CO C-X band at 1088 Å, and given the insufficient spectral resolution and known calibration issues with the Far Ultraviolet Spectroscopic Explorer (FUSE, Kosenko & Balashev 2023), these detections are debatable. Welty et al. (2016) also mentioned the presence of CO absorptions towards SK 143 and SK −68 137 in HST Space Telescope Imaging Spectrograph (STIS) and FUSE spectra, respectively, but did not provide further details.
Several more convenient A-X bands are available at λ ≳ 1300 Å, accessible via the HST. In this Letter, we present a systematic search for and study of CO absorption in the MC based on archival HST data. We do not confirm the previous claims, but report the first definitive detections of CO absorption along two sightlines in the LMC and one in the SMC. This allowed us to directly derive and discuss the relative abundance of CO and H2 for the first time in these environments.
2. Data and analysis
To search for CO absorption, we scrutinised archival data from the Cosmic Origin Spectrograph (COS) and the STIS of UV-bright stars in the LMC and SMC, where H2 has been detected (Welty et al. 2012; Kosenko & Balashev 2023) with column densities N(H2)≳1019.5 (here and below all column densities are in cm−2).
For each sightline we considered all available spectra during the analysis. We constructed the local continuum over the expected positions of CO bands (both 12CO and 13CO) using an iterative B-spline model, constrained by unabsorbed regions. The continuum was then visually inspected and corrected if necessary. We used a compilation of CO transitions from Daprà et al. (2016), which includes A-X bands from (0 − 0) to (9 − 0), as well as the d-X 5-0 band. We performed Voigt profile fitting of the data, along with Bayesian inference through an affine-invariant sampler (Goodman & Weare 2010) to obtain constraints (including upper limits) on the CO column densities and other model parameters. The number of components is based on the associated C I absorption. The line profiles with line spread function which was chosen to be Gaussian for STIS spectra and provided by Space Telescope Science Institute for COS2.
Due to the limited spectral resolution, the lines corresponding to transitions from CO rotational levels are either unresolved (for COS spectra) or barely resolved (for STIS spectra). To obtain consistent column densities across the different rotational levels, we assumed homogeneous excitation of CO within the absorption gas: we used a single Doppler parameter for all CO rotational levels and tied the column densities of the various rotational levels using a one-zone excitation model. Details of the model are provided in Appendix A.
We accounted for uncertainties in continuum placement following Noterdaeme et al. (2021). Briefly, for each CO band we estimated the pixel dispersion in regions near the absorption line and applied a hierarchical Bayesian model, with a factor h representing continuum variations.
We used Gaussian priors on the component velocities derived from the C I absorption lines (except for sightlines towards SK −67 2 and SK 143, where we used CH lines detected in high-resolution optical spectra). For the Doppler parameters we conservatively assumed Gaussian priors with a mean of 1.0 and a standard deviation of 0.3 km s−1. For the temperature (which sets the collisional rates) we used log normal priors log Tk[K] = 1.7 ± 0.3 and 1.2 ± 0.1, expressing the mean ± standard deviation for sightlines with CO non-detection and detection, respectively. This choice was motivated by observations (see e.g. Balashev et al. 2019; Klimenko et al. 2024) and Meudon PDR modelling (see Fig. B.1 and discussion in Appendix B). For sightlines with CO detections, we used a flat prior for the number densities log n, while for those without CO detection, we applied a log-normal prior, log n[cm−3] = 2.5 ± 0.3, corresponding to typical values in molecular clouds (e.g. Draine 2011; Klimenko & Balashev 2020). For the continuum variation factor h (unitless), we assumed a Gaussian prior with h = 1.0 ± 0.3.
All data analysis, including profile fitting, CO population calculations, and posterior distribution inference, was performed using the publicly available code spectro3. For each parameter, we report both the point estimate and interval estimates, which correspond to the maximum a posteriori probability and the 0.683 highest posterior density interval, respectively. The latter represents the statistical uncertainty under the given model assumptions, which should be taken with caution.
3. Results
We confidently detect 12CO absorption lines towards SK −68 137 in LMC and both 12CO and 13CO towards SK −67 2 (LMC) and SK 143 (SMC), yielding an isotopic ratio ∼ 10−2 consistent with what is seen in the MW (Sonnentrucker et al. 2007; Sheffer et al. 2007). The fits are shown in Figs. 1, 2 and 3 and the corresponding parameters in Table 1. We also derived stringent upper limits on the 12CO column densities for 16 and 15 sightlines in the LMC and SMC, respectively. The co-added band profiles are shown in Fig. C.1 and the 2σ (95.4% significance level) upper limits are presented in Table C.1. Our results, based on several A-X bands observed at high spectral resolution do not confirm previous claims of CO detection from a single C-X band at lower resolution by André et al. (2004) and Bluhm & de Boer (2001). Our upper limits (log N(CO) < 12.9, < 13.2 and < 13.0) are significantly below the reported values of  ,
,  ,
,  for SK −67 5, SK −68 135, SK −69 246, respectively (André et al. 2004)4.
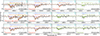 |
Fig. 1. CO absorption bands in the LMC towards SK −67 2. The instrument (grating) are indicated at the bottom right corner of each panel. The pixels used to constrain the Voigt-profile model are shown in black, otherwise in grey. The red, blue (green for 13CO), and violet lines and shaded regions show the model profiles sampled from the posterior distribution of the fit parameters for the total, main, and additional (with CO constrained as an upper limit) component, respectively. The blue lines at the top of each panel shows the residuals between the observed and modelled spectra. The connected ticks mark lines from J = 0 − 5 rotational levels. |
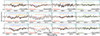 |
Fig. 2. CO absorption bands in the LMC towards SK −68 137. The graphical elements are the same as in Fig. 1. The absorption at 1394 Å, blended with the 12 CO A − X 5 − 0 band, corresponds to the Si IV doublet. |
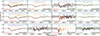 |
Fig. 3. CO absorption bands in the SMC towards SK 143. The graphical elements are the same as in Fig. 1. |
Results for the CO detections in the MCs.
The best models for the detection are obtained for number densities well above 102 cm−3, consistent with the expected values for cold molecular gas. The thermal pressures along the three lines of sight range from 104 to 106 cm−3 K, which is higher than typical values for the cold ISM in the MW (Jenkins & Tripp 2011; Klimenko & Balashev 2020; Klimenko et al. 2024). This elevated pressure is expected, as the MCs have lower metallicity and stronger UV fields than the MW, leading to higher pressures in thermal equilibrium (e.g. Wolfire et al. 1995). Other studies have also reported a trend of higher pressures in the diffuse medium of the MCs compared to that of the MW (see e.g. Welty et al. 2016; Kosenko et al. 2024).
The CO absorbing gas exhibits small Doppler parameters, around 0.2–0.5 km s−1, and the derived temperatures are below 40 K. While these results may be influenced by the choice of priors (motivated by modelling; see Appendix B), in the case of SK 143, we found an even lower temperature of ∼10 K in which case the thermal broadening is less than 0.15 km s−1. This indicates Mach numbers  ,
,  , and
, and  for SK −67 2, SK −68 137, and SK 143, respectively, which are consistent with typical values measured in CNM and molecular clouds in our Galaxy (e.g. Heiles & Troland 2003; Schneider et al. 2013). We also note that the characteristic cloud sizes, 0.01–1 pc, derived from the column and number densities, are consistent with the Larson relation, given the observed turbulent motions.
4. Discussions
In Fig. 5, we compare our constraints on the 12CO (hereafter denoted CO) and H2 column densities in the MCs with similar absorption measurements in the MW (Sonnentrucker et al. 2007; Sheffer et al. 2008; Burgh et al. 2010; Welty et al. 2020; Federman et al. 2021) and at high redshifts (Noterdaeme et al. 2018; Klimenko et al. 2024, and references therein). Most constraints are significantly below the standard ratio CO/H2 ≈ 3 × 10⁻⁴ adopted for the MW (Bolatto et al. 2013). However, they present a steep increase in CO column densities around log N(H2) ∼ 20.5 (see also Sonnentrucker et al. 2007; Sheffer et al. 2008), indicating a transition from atomic to molecular forms of carbon. This also means that the majority of the clouds have not reached full carbon molecularisation. Remarkably, some SMC and LMC sightlines feature very low CO column densities (N(CO)≲13) even at log N(H2)≳20.5, while two high-z systems present relatively high CO column densities at log N(H2) < 19.5. The high-z detections can be explained by the solar or super-solar metallicities in these particular cases (Srianand et al. 2008; Noterdaeme et al. 2017). In turn, the MCs have sub-solar metallicities. Environmental differences can also be at play, for example with lower pressures in the clouds with low N(CO) despite high N(H2).
The star SK −68 137 lies north of the 30 Doradus complex, suggesting that the absorption system may be part of the star-forming region, so that the detection of CO may in principle not be surprising. However, CO was not detected in absorption towards other stars near 30 Dor, such as SK −68 135, SK −69 246, and SK −68 129. In contrast, SK −67 2 and SK 143 where CO was detected in absorption, are located in more quiescent regions: SK −67 2 is an isolated star in the north-west of the LMC, and SK 143 is situated in the eastern part of the SMC wing. Interestingly, Welty et al. (2013) found an unusual chemical composition in the absorption system towards SK 143 differing from typical SMC wing abundances, including the first detection of C2 and C3 outside our galaxy. Overall, the location of the star does not provide a direct hint of the local conditions, and hence the detectability of CO.
To quantitatively explore the variation in CO/H2 abundances with physical parameters, we then compared our observations with predictions from the Meudon PDR code (Le Petit et al. 2006)5. Isobaric models were computed for three metallicities: 0.2 and 0.5 (typical for the SMC and LMC, respectively) and 1.0, with respect to solar. We assumed a plane-parallel geometry with standard dust composition, a UV field intensity equal to the (Mathis et al. 1983) field, and a cosmic ray ionisation rate (CRIR) of 10−16 s−1 per H2 molecule. Figure 5 shows that, when the metallicity is taken into account, the MW data and the upper limits in the MCs can both be explained by models with thermal pressures of 104 − 105 cm−3 K. However, the CO detections in the LMC and SMC suggest locally either a higher metallicity (closer to solar) or higher thermal pressures (up to a few × 106 cm−3 K). While large spatial variation of metallicities are seen in the MCs (Tchernyshyov et al. 2015; Kosenko et al. 2024), similar to variations seen in the solar neighbourhood, (De Cia et al. 2021, but see Ritchey et al. 2023), those along the SK −67 2 and SK 143 sightlines are found to be close to the average values (see Kosenko et al. 2024; Jenkins & Wallerstein 2017). The saturated S II lines in SK −68 137 indicate an elevated metallicity in comparison with the average LMC value. In short, high thermal pressures (Pth > 106 K cm−3) appear to be essential to explain at least two CO detections.
This is particularly clear for the gas towards SK 143 in the SMC: CO/H2 is remarkably high and reaches the maximum value predicted by the corresponding models, that otherwise converge only at much higher N(H2) for pressures below that value. The rotational excitation of CO in this system also indicates a high pressure, as can be seen in Fig. 4. In that case, the gas has likely reached full molecularisation so that the CO/H2 ratio,  , should be representative of that of dense molecular gas. We note that the exact value of the thermal pressure is hard to estimate since various factors that influence the CO/H2 ratio (metallicity, UV field, CRIR, and C/H gas abundance) are not well known in this system. Interestingly, the ratio is found to be approximately four times lower than the standard Galactic value of 3.2 × 10⁻⁴ (Bolatto et al. 2013), in agreement with the approximately five times lower metallicity. However, we note that in the SMC some studies reported slightly lower carbon abundances ≈0.1 of solar value (Welty et al. 2016; Vink et al. 2023).
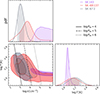 |
Fig. 4. Marginalised (1D – diagonal panel, and 2D – bottom left panel) posterior distributions of the number density and kinetic temperature in CO-bearing gas towards SK −67 2 (grey), SK −68 137 (red), and SK 143 (purple). The shaded regions depict 0.683 (1D and 2D) and 0.954 (2D) credible intervals. The solid, dashed, and dotted lines represent constant thermal pressures of 104, 105, and 106 cm−3 K, respectively. |
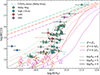 |
Fig. 5. Measurements of CO vs H2 column densities in absorption. The green squares and blue diamonds represent the literature measurements in our Galaxy and high-z DLAs, respectively. The red pentagons and pink circles show the data obtained in this paper for LMC and SMC, respectively. The curves indicate isobaric models using the Meudon PDR code (Le Petit et al. 2006), with thermal pressures of 104 (solid), 105 (dashed), and 106 cm−3 K (dotted) and metallicities of Z = 0.2 (pink), 0.5 (red), and 1 (green) relative to solar. The dashed lines indicate the standard CO/H2 = 3.2 × 10⁻⁴ measured in the dense clouds in the MW (green) and the same value scaled to the MC average metallicity (red and purple). |
In summary, the detection of CO towards SK 143 enabled the first direct measurement of the CO-to-H2 ratio in the SMC, yielding a value consistent with the standard value, scaled down to the observed SMC metallicity. We caution however that other factors, such as the strength of the UV field (Bolatto et al. 2013) and CRIR (Bisbas et al. 2017), can in principle also alter the ratio, and this warrants detailed modelling. The modelling could be aided by constraints from C I and H2 abundances and their excitation levels.
We emphasise that it is essential to ensure that a cloud is fully molecularised before applying the observed CO/H2 ratio to any CO-emitting gas. Since very high H2 columns are rare and difficult to characterise in absorption, direct measurements of the CO/H2 ratio at low metallicities require observing high-pressure gas. In this context, resolving the CO bands to study the population of rotational levels is crucial.
CH, CH+, C2, C3, and CN were firmly detected in other MCs sightlines by Welty et al. (2006, 2013).
Bluhm & de Boer (2001) reported log N(CO) = 13.0 ± 0.4 towards SK −69 246.
Version 1.5.4, revision 2095 (August 2021).
Acknowledgments
We thank the referee for a very detailed and thorough report, which allowed us to significantly improve the quality of the manuscript. This work is supported by RSF grant 23-12-00166. Based on observations obtained with the NASA/ESA Hubble Space Telescope, retrieved from the Mikulski Archive for Space Telescopes (MAST) at the Space Telescope Science Institute (STScI). STScI is operated by the Association of Universities for Research in Astronomy, Inc. under NASA contract NAS 5-26555.
References
- Abdo, A. A., Ackermann, M., Ajello, M., et al. 2010a, A&A, 512, A7 [NASA ADS] [CrossRef] [EDP Sciences] [Google Scholar]
- Abdo, A. A., Ackermann, M., Ajello, M., et al. 2010b, A&A, 523, A46 [NASA ADS] [CrossRef] [EDP Sciences] [Google Scholar]
- André, M. K., Le Petit, F., Sonnentrucker, P., et al. 2004, A&A, 422, 483 [NASA ADS] [CrossRef] [EDP Sciences] [Google Scholar]
- Balashev, S. A., Klimenko, V. V., Noterdaeme, P., et al. 2019, MNRAS, 490, 2668 [NASA ADS] [CrossRef] [Google Scholar]
- Bisbas, T. G., van Dishoeck, E. F., Papadopoulos, P. P., et al. 2017, ApJ, 839, 90 [Google Scholar]
- Bluhm, H., & de Boer, K. S. 2001, A&A, 379, 82 [NASA ADS] [CrossRef] [EDP Sciences] [Google Scholar]
- Bolatto, A. D., Wolfire, M., & Leroy, A. K. 2013, ARA&A, 51, 207 [CrossRef] [Google Scholar]
- Brüns, C., Kerp, J., Staveley-Smith, L., et al. 2005, A&A, 432, 45 [CrossRef] [EDP Sciences] [Google Scholar]
- Burgh, E. B., France, K., & Jenkins, E. B. 2010, ApJ, 708, 334 [CrossRef] [Google Scholar]
- Carruthers, G. R. 1970, ApJ, 161, L81 [Google Scholar]
- Cartledge, S. I. B., Clayton, G. C., Gordon, K. D., et al. 2005, ApJ, 630, 355 [NASA ADS] [CrossRef] [Google Scholar]
- Cecchi-Pestellini, C., Bodo, E., Balakrishnan, N., & Dalgarno, A. 2002, ApJ, 571, 1015 [NASA ADS] [CrossRef] [Google Scholar]
- Combes, F., Gupta, N., Jozsa, G. I. G., & Momjian, E. 2019, A&A, 623, A133 [NASA ADS] [CrossRef] [EDP Sciences] [Google Scholar]
- Daprà, M., Niu, M. L., Salumbides, E. J., Murphy, M. T., & Ubachs, W. 2016, ApJ, 826, 192 [Google Scholar]
- De Cia, A., Jenkins, E. B., Fox, A. J., et al. 2021, Nature, 597, 206 [NASA ADS] [CrossRef] [Google Scholar]
- Draine, B. T. 2011, Physics of the Interstellar and Intergalactic Medium (Princeton University Press) [Google Scholar]
- Emonts, B. H. C., Curran, S. J., Miley, G. K., et al. 2024, ApJ, 962, 187 [Google Scholar]
- Federman, S. R., Glassgold, A. E., Jenkins, E. B., & Shaya, E. J. 1980, ApJ, 242, 545 [Google Scholar]
- Federman, S. R., Rice, J. S., Ritchey, A. M., et al. 2021, ApJ, 914, 59 [NASA ADS] [CrossRef] [Google Scholar]
- Fukui, Y., & Kawamura, A. 2010, ARA&A, 48, 547 [NASA ADS] [CrossRef] [Google Scholar]
- Fukui, Y., Kawamura, A., Minamidani, T., et al. 2008, ApJS, 178, 56 [Google Scholar]
- Goodman, J., & Weare, J. 2010, Commun. Appl. Math. Comp. Sci., 5, 65 [NASA ADS] [CrossRef] [Google Scholar]
- Graczyk, D., Pietrzyński, G., Thompson, I. B., et al. 2020, ApJ, 904, 13 [Google Scholar]
- Heiles, C., & Troland, T. H. 2003, ApJ, 586, 1067 [NASA ADS] [CrossRef] [Google Scholar]
- Indebetouw, R., Brogan, C., Chen, C. H. R., et al. 2013, ApJ, 774, 73 [NASA ADS] [CrossRef] [Google Scholar]
- Jameson, K. E., Bolatto, A. D., Wolfire, M., et al. 2018, ApJ, 853, 111 [Google Scholar]
- Jenkins, E. B., & Tripp, T. M. 2011, ApJ, 734, 65 [NASA ADS] [CrossRef] [Google Scholar]
- Jenkins, E. B., & Wallerstein, G. 2017, ApJ, 838, 85 [NASA ADS] [CrossRef] [Google Scholar]
- Klimenko, V. V., & Balashev, S. A. 2020, MNRAS, 498, 1531 [CrossRef] [Google Scholar]
- Klimenko, V. V., Balashev, S. A., Noterdaeme, P., Srianand, R., & Ivanchik, A. V. 2024, MNRAS, 533, 1367 [NASA ADS] [CrossRef] [Google Scholar]
- Kosenko, D. N., & Balashev, S. A. 2023, MNRAS, 525, 2820 [Google Scholar]
- Kosenko, D. N., Balashev, S. A., & Klimenko, V. V. 2024, MNRAS, 528, 5065 [NASA ADS] [CrossRef] [Google Scholar]
- Larson, R. B. 1981, MNRAS, 194, 809 [Google Scholar]
- Le Petit, F., Nehmé, C., Le Bourlot, J., & Roueff, E. 2006, ApJS, 164, 506 [NASA ADS] [CrossRef] [Google Scholar]
- Ma, J., Caucal, P., Noterdaeme, P., et al. 2015, MNRAS, 454, 1751 [NASA ADS] [CrossRef] [Google Scholar]
- Mathis, J. S., Mezger, P. G., & Panagia, N. 1983, A&A, 128, 212 [NASA ADS] [Google Scholar]
- Mizuno, N., Rubio, M., Mizuno, A., et al. 2001, PASJ, 53, L45 [NASA ADS] [Google Scholar]
- Noterdaeme, P., Ledoux, C., Srianand, R., Petitjean, P., & Lopez, S. 2009, A&A, 503, 765 [NASA ADS] [CrossRef] [EDP Sciences] [Google Scholar]
- Noterdaeme, P., Petitjean, P., Ledoux, C., et al. 2010, A&A, 523, A80 [NASA ADS] [CrossRef] [EDP Sciences] [Google Scholar]
- Noterdaeme, P., Petitjean, P., Srianand, R., Ledoux, C., & López, S. 2011, A&A, 526, L7 [CrossRef] [EDP Sciences] [Google Scholar]
- Noterdaeme, P., Krogager, J. K., Balashev, S., et al. 2017, A&A, 597, A82 [NASA ADS] [CrossRef] [EDP Sciences] [Google Scholar]
- Noterdaeme, P., Ledoux, C., Zou, S., et al. 2018, A&A, 612, A58 [NASA ADS] [CrossRef] [EDP Sciences] [Google Scholar]
- Noterdaeme, P., Balashev, S., Ledoux, C., et al. 2021, A&A, 651, A78 [NASA ADS] [CrossRef] [EDP Sciences] [Google Scholar]
- Ohyama, Y., Onishi, S., Nakagawa, T., et al. 2023, ApJ, 951, 87 [NASA ADS] [CrossRef] [Google Scholar]
- Onishi, S., Nakagawa, T., Baba, S., et al. 2021, ApJ, 921, 141 [NASA ADS] [CrossRef] [Google Scholar]
- Pietrzyński, G., Graczyk, D., Gallenne, A., et al. 2019, Nature, 567, 200 [Google Scholar]
- Prochaska, J. X., Sheffer, Y., Perley, D. A., et al. 2009, ApJ, 691, L27 [NASA ADS] [CrossRef] [Google Scholar]
- Ritchey, A. M., Jenkins, E. B., Shull, J. M., et al. 2023, ApJ, 952, 57 [NASA ADS] [CrossRef] [Google Scholar]
- Roman-Duval, J., Jenkins, E. B., Williams, B., et al. 2019, ApJ, 871, 151 [NASA ADS] [CrossRef] [Google Scholar]
- Russell, S. C., & Dopita, M. A. 1992, ApJ, 384, 508 [NASA ADS] [CrossRef] [Google Scholar]
- Savage, B. D., Bohlin, R. C., Drake, J. F., & Budich, W. 1977, ApJ, 216, 291 [NASA ADS] [CrossRef] [Google Scholar]
- Schneider, N., André, P., Könyves, V., et al. 2013, ApJ, 766, L17 [NASA ADS] [CrossRef] [Google Scholar]
- Schöier, F. L., van der Tak, F. F. S., van Dishoeck, E. F., & Black, J. H. 2005, A&A, 432, 369 [Google Scholar]
- Sheffer, Y., Rogers, M., Federman, S. R., Lambert, D. L., & Gredel, R. 2007, ApJ, 667, 1002 [NASA ADS] [CrossRef] [Google Scholar]
- Sheffer, Y., Rogers, M., Federman, S. R., et al. 2008, ApJ, 687, 1075 [Google Scholar]
- Shirahata, M., Nakagawa, T., Usuda, T., et al. 2013, PASJ, 65, 5 [NASA ADS] [CrossRef] [Google Scholar]
- Smith, A. M., & Stecher, T. P. 1971, ApJ, 164, L43 [Google Scholar]
- Sonnentrucker, P., Welty, D. E., Thorburn, J. A., & York, D. G. 2007, ApJS, 168, 58 [NASA ADS] [CrossRef] [Google Scholar]
- Srianand, R., Noterdaeme, P., Ledoux, C., & Petitjean, P. 2008, A&A, 482, L39 [NASA ADS] [CrossRef] [EDP Sciences] [Google Scholar]
- Tchernyshyov, K., Meixner, M., Seale, J., et al. 2015, ApJ, 811, 78 [NASA ADS] [CrossRef] [Google Scholar]
- Vink, J. S., Mehner, A., Crowther, P. A., et al. 2023, A&A, 675, A154 [NASA ADS] [CrossRef] [EDP Sciences] [Google Scholar]
- Welty, D. E., Federman, S. R., Gredel, R., Thorburn, J. A., & Lambert, D. L. 2006, ApJS, 165, 138 [Google Scholar]
- Welty, D. E., Xue, R., & Wong, T. 2012, ApJ, 745, 173 [NASA ADS] [CrossRef] [Google Scholar]
- Welty, D. E., Howk, J. C., Lehner, N., & Black, J. H. 2013, MNRAS, 428, 1107 [NASA ADS] [CrossRef] [Google Scholar]
- Welty, D. E., Lauroesch, J. T., Wong, T., & York, D. G. 2016, ApJ, 821, 118 [CrossRef] [Google Scholar]
- Welty, D. E., Sonnentrucker, P., Snow, T. P., & York, D. G. 2020, ApJ, 897, 36 [Google Scholar]
- Wolfire, M. G., Hollenbach, D., McKee, C. F., Tielens, A. G. G. M., & Bakes, E. L. O. 1995, ApJ, 443, 152 [Google Scholar]
- Yang, B., Stancil, P. C., Balakrishnan, N., & Forrey, R. C. 2010, ApJ, 718, 1062 [Google Scholar]
Appendix A: Model of CO excitation
Here we describe the CO excitation model used to tie column densities across the various rotational levels during Voigt profile fitting. We employed a one-zone static model, where the balance equations for each ith level are expressed as
 (A.1)
(A.1)
where fi = ni/ntot = Ni/Ntot, and ni (Ni) and ntot (Ntot) represent the CO number (column) density in the ith level and total, respectively. Qij are the transition rates between ith and jth levels. In our model, we accounted for populating the levels by collisions and CMB radiation, and also incorporated the radiative trapping effect,
 (A.2)
(A.2)
 (A.3)
(A.3)
where u and l correspond to the upper and lower levels, respectively. The terms in both Qul and Qlu describe collisional excitation: nk is the number density of collisional partner k, Culk and Cluk are the corresponding collisional rate coefficients. Assuming that CO resides in a H2-dominated medium, we considered collisions with H2 (with ortho-para ratio of H2 corresponding to the kinetic temperature) and He (with 7% abundance) with collisional rates taken from Yang et al. 2010; Cecchi-Pestellini et al. 2002. Aul, Blu, and Bul are Einstein coefficients (taken from Schöier et al. 2005), describing spontaneous decay, absorption and stimulated emission. ICMB is the intensity of CMB radiation at z = 0, with TCMB = 2.725 K. β ∼ Ntot(CO) is the escape probability coefficient, which accounts for radiative trapping effect (see Klimenko et al. 2024). Radiative trapping begins to play a significant role for column densities log Ntot(CO)≳15, where we assume an exponential dependence of β on the total CO column density, β = e−(log Ntot(CO)−15)/2, based on extrapolating points obtained through detailed calculations (Klimenko et al. 2024). We note that for two detections with relatively large CO column densities, the joint line profiles of CO bands are better reproduced by collisional excitation, making radiative trapping negligible in these cases. Overall, the described model provides column densities for the various rotational levels as a function of Ntot(CO), n, and TK, which were used as independent parameters during the line profile fitting.
Appendix B: Model motivated choice of temperature prior
In Fig. B.1 we compare the kinetic temperature profiles as a function of N(CO), for a set of Meudon PDR models with different metallicities and thermal pressures (these models are described and used in Sect. 4). One can notice that models present a similar behaviour in the CO column density range log N(CO) = 13 − 16, with median T ≈ 50 K for log N(CO) = 13 (similar to detection limits) and T ≈ 15 K for log N(CO) = 16. These motivated our choice of priors on the kinetic temperature (see Sect. 2) during the fit for both non- detections and detections, respectively.
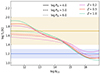 |
Fig. B.1. Kinetic temperature as a function of CO column density obtained using the Meudon PDR code. The solid, dashed, and dotted lines depict models with thermal pressures of 104, 105, and 106 cm−3 K, respectively, while pink, red, and green correspond to metallicities (relative to solar) Z = 0.2, 0.5, and 1, respectively. The blue (log TK[k] = 1.2 ± 0.1) and orange (log TK[k] = 1.7 ± 0.3) horizontal stripes show our choice of priors on the kinetic temperatures used to fit CO absorption lines towards sightlines with and without CO detections, respectively. |
Appendix C: Overall sample: Non-detections and summary
Figure C.1 presents the co-added spectra at the position of CO absorption bands for the sightlines without CO detection. To co-add the spectra and fit model we shifted the lines in each band using the R0 line as reference, determining the velocity offset (Fig. C.1). This co-adding was performed for illustrative purposes only; constraints on the column densities were obtained using the full spectral information. This technique is also described in (Noterdaeme et al. 2018). Some of the sightlines, e.g. SK −68 135 or SK −70 79, present tentative detections only, with constraints on CO column densities close to the expected values for the typical physical conditions in the diffuse ISM. However, deeper and higher resolution studies are needed to substantiate these possible detections.
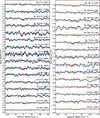 |
Fig. C.1. Stack of STIS (left column) and COS (right column) HST spectra of CO absorption lines towards LMC and SMC stars. The black lines with blue error bars represent the CO bands co-added spectrum (using R0 line as a reference line for each band to define the velocity offset), while the red lines correspond to the co-added fit profiles. Each spectrum is arbitrary shifted in y-axis for illustrative purposes. The name of each background star is provided above each spectrum. This includes three sightlines Sk −67 5, Sk −68 135, and Sk −69 246, where Bluhm & de Boer (2001), André et al. (2004) previously claimed CO detection, while HST data indicate non-detection with much lower upper limits on CO column densities, see Table C.1. |
Table C.1 summaries all the measurements and upper limits obtained towards the 34 stars in the LMC and SMC, together with some additional information from the literature.
CO and H2 measurements towards LMC and SMC sightlines.
Appendix D: CO excitation diagrams
Using the sampling from derived posterior distribution function for the physical conditions (n, TK) and the total CO column density, we can reconstruct the CO excitation diagram for each detected system. The data is provided in Table D.1. An example of excitation diagram is shown in Fig. D.1. For SK 143 the fit to the sampled CO column densities with Boltzmann distribution indicate a temperature Texc = 11.7 ± 0.2 K. These estimates match the constrained estimates obtained directly from the model fit, which is expected since the posterior values of the number densities are well above the critical densities for all rotational levels. We also note that constrained values are consistent with the trend of increase of the Texc at CO column densities log N(Co) ≳ 15 seen in our Galaxy (see e.g. compilations by Sonnentrucker et al. 2007; Klimenko et al. 2024).
CO rotational column densities.
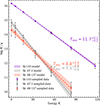 |
Fig. D.1. CO excitation diagram towards three CO absorption systems. The grey, red, and violet points indicate the column densities values sampled from the posterior distributions of the fit parameters using the model described in Sect. 2 for SK −67 2, SK −68 137, and SK 143, respectively. The stripes of the corresponding colours indicate the 0.683 credible region of the excitation diagram derived from the fit to the sampled column densities with Boltzmann law. |
All Tables
All Figures
|
Fig. 1. CO absorption bands in the LMC towards SK −67 2. The instrument (grating) are indicated at the bottom right corner of each panel. The pixels used to constrain the Voigt-profile model are shown in black, otherwise in grey. The red, blue (green for 13CO), and violet lines and shaded regions show the model profiles sampled from the posterior distribution of the fit parameters for the total, main, and additional (with CO constrained as an upper limit) component, respectively. The blue lines at the top of each panel shows the residuals between the observed and modelled spectra. The connected ticks mark lines from J = 0 − 5 rotational levels. |
| In the text | |
|
Fig. 2. CO absorption bands in the LMC towards SK −68 137. The graphical elements are the same as in Fig. 1. The absorption at 1394 Å, blended with the 12 CO A − X 5 − 0 band, corresponds to the Si IV doublet. |
| In the text | |
|
Fig. 3. CO absorption bands in the SMC towards SK 143. The graphical elements are the same as in Fig. 1. |
| In the text | |
|
Fig. 4. Marginalised (1D – diagonal panel, and 2D – bottom left panel) posterior distributions of the number density and kinetic temperature in CO-bearing gas towards SK −67 2 (grey), SK −68 137 (red), and SK 143 (purple). The shaded regions depict 0.683 (1D and 2D) and 0.954 (2D) credible intervals. The solid, dashed, and dotted lines represent constant thermal pressures of 104, 105, and 106 cm−3 K, respectively. |
| In the text | |
|
Fig. 5. Measurements of CO vs H2 column densities in absorption. The green squares and blue diamonds represent the literature measurements in our Galaxy and high-z DLAs, respectively. The red pentagons and pink circles show the data obtained in this paper for LMC and SMC, respectively. The curves indicate isobaric models using the Meudon PDR code (Le Petit et al. 2006), with thermal pressures of 104 (solid), 105 (dashed), and 106 cm−3 K (dotted) and metallicities of Z = 0.2 (pink), 0.5 (red), and 1 (green) relative to solar. The dashed lines indicate the standard CO/H2 = 3.2 × 10⁻⁴ measured in the dense clouds in the MW (green) and the same value scaled to the MC average metallicity (red and purple). |
| In the text | |
|
Fig. B.1. Kinetic temperature as a function of CO column density obtained using the Meudon PDR code. The solid, dashed, and dotted lines depict models with thermal pressures of 104, 105, and 106 cm−3 K, respectively, while pink, red, and green correspond to metallicities (relative to solar) Z = 0.2, 0.5, and 1, respectively. The blue (log TK[k] = 1.2 ± 0.1) and orange (log TK[k] = 1.7 ± 0.3) horizontal stripes show our choice of priors on the kinetic temperatures used to fit CO absorption lines towards sightlines with and without CO detections, respectively. |
| In the text | |
|
Fig. C.1. Stack of STIS (left column) and COS (right column) HST spectra of CO absorption lines towards LMC and SMC stars. The black lines with blue error bars represent the CO bands co-added spectrum (using R0 line as a reference line for each band to define the velocity offset), while the red lines correspond to the co-added fit profiles. Each spectrum is arbitrary shifted in y-axis for illustrative purposes. The name of each background star is provided above each spectrum. This includes three sightlines Sk −67 5, Sk −68 135, and Sk −69 246, where Bluhm & de Boer (2001), André et al. (2004) previously claimed CO detection, while HST data indicate non-detection with much lower upper limits on CO column densities, see Table C.1. |
| In the text | |
|
Fig. D.1. CO excitation diagram towards three CO absorption systems. The grey, red, and violet points indicate the column densities values sampled from the posterior distributions of the fit parameters using the model described in Sect. 2 for SK −67 2, SK −68 137, and SK 143, respectively. The stripes of the corresponding colours indicate the 0.683 credible region of the excitation diagram derived from the fit to the sampled column densities with Boltzmann law. |
| In the text | |
Current usage metrics show cumulative count of Article Views (full-text article views including HTML views, PDF and ePub downloads, according to the available data) and Abstracts Views on Vision4Press platform.
Data correspond to usage on the plateform after 2015. The current usage metrics is available 48-96 hours after online publication and is updated daily on week days.
Initial download of the metrics may take a while.