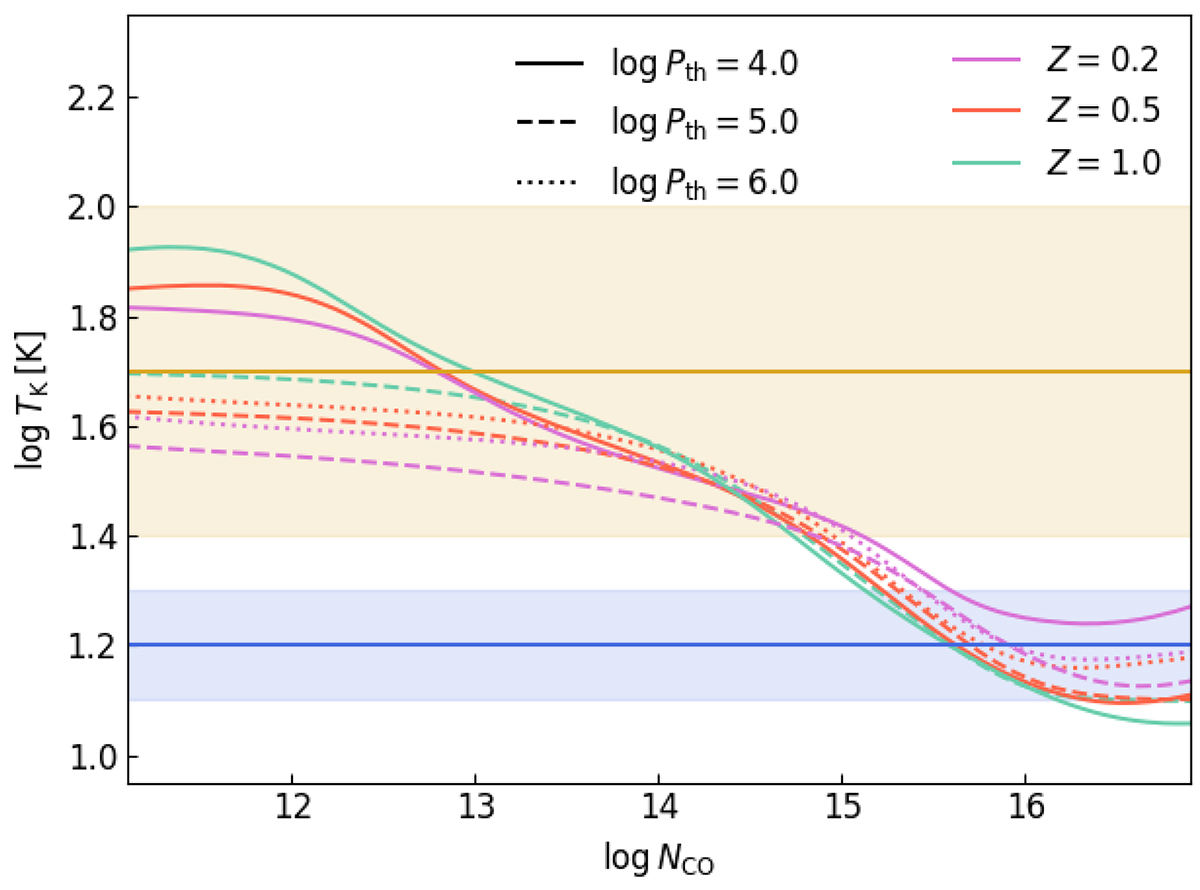
Fig. B.1.
Download original image
Kinetic temperature as a function of CO column density obtained using the Meudon PDR code. The solid, dashed, and dotted lines depict models with thermal pressures of 104, 105, and 106 cm−3 K, respectively, while pink, red, and green correspond to metallicities (relative to solar) Z = 0.2, 0.5, and 1, respectively. The blue (log TK[k] = 1.2 ± 0.1) and orange (log TK[k] = 1.7 ± 0.3) horizontal stripes show our choice of priors on the kinetic temperatures used to fit CO absorption lines towards sightlines with and without CO detections, respectively.
Current usage metrics show cumulative count of Article Views (full-text article views including HTML views, PDF and ePub downloads, according to the available data) and Abstracts Views on Vision4Press platform.
Data correspond to usage on the plateform after 2015. The current usage metrics is available 48-96 hours after online publication and is updated daily on week days.
Initial download of the metrics may take a while.