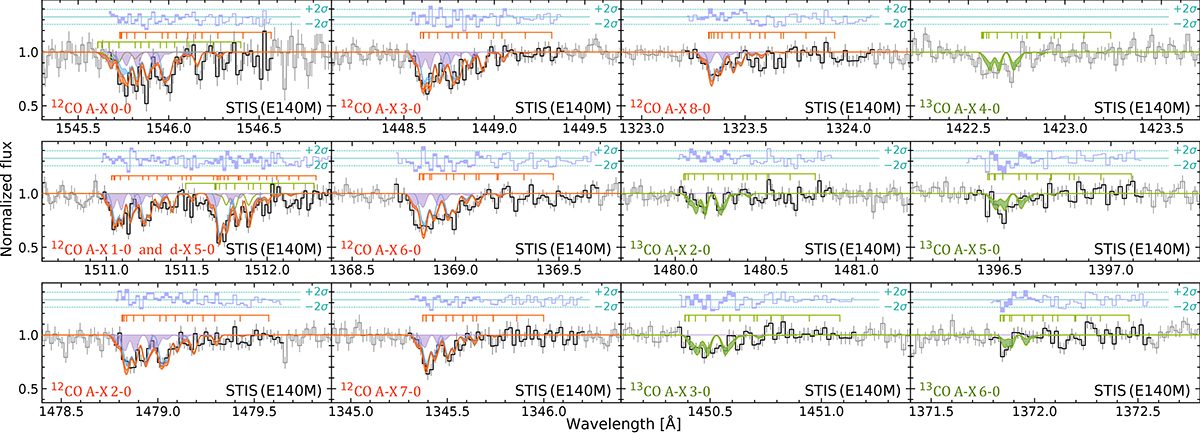
Fig. 1.
Download original image
CO absorption bands in the LMC towards SK −67 2. The instrument (grating) are indicated at the bottom right corner of each panel. The pixels used to constrain the Voigt-profile model are shown in black, otherwise in grey. The red, blue (green for 13CO), and violet lines and shaded regions show the model profiles sampled from the posterior distribution of the fit parameters for the total, main, and additional (with CO constrained as an upper limit) component, respectively. The blue lines at the top of each panel shows the residuals between the observed and modelled spectra. The connected ticks mark lines from J = 0 − 5 rotational levels.
Current usage metrics show cumulative count of Article Views (full-text article views including HTML views, PDF and ePub downloads, according to the available data) and Abstracts Views on Vision4Press platform.
Data correspond to usage on the plateform after 2015. The current usage metrics is available 48-96 hours after online publication and is updated daily on week days.
Initial download of the metrics may take a while.