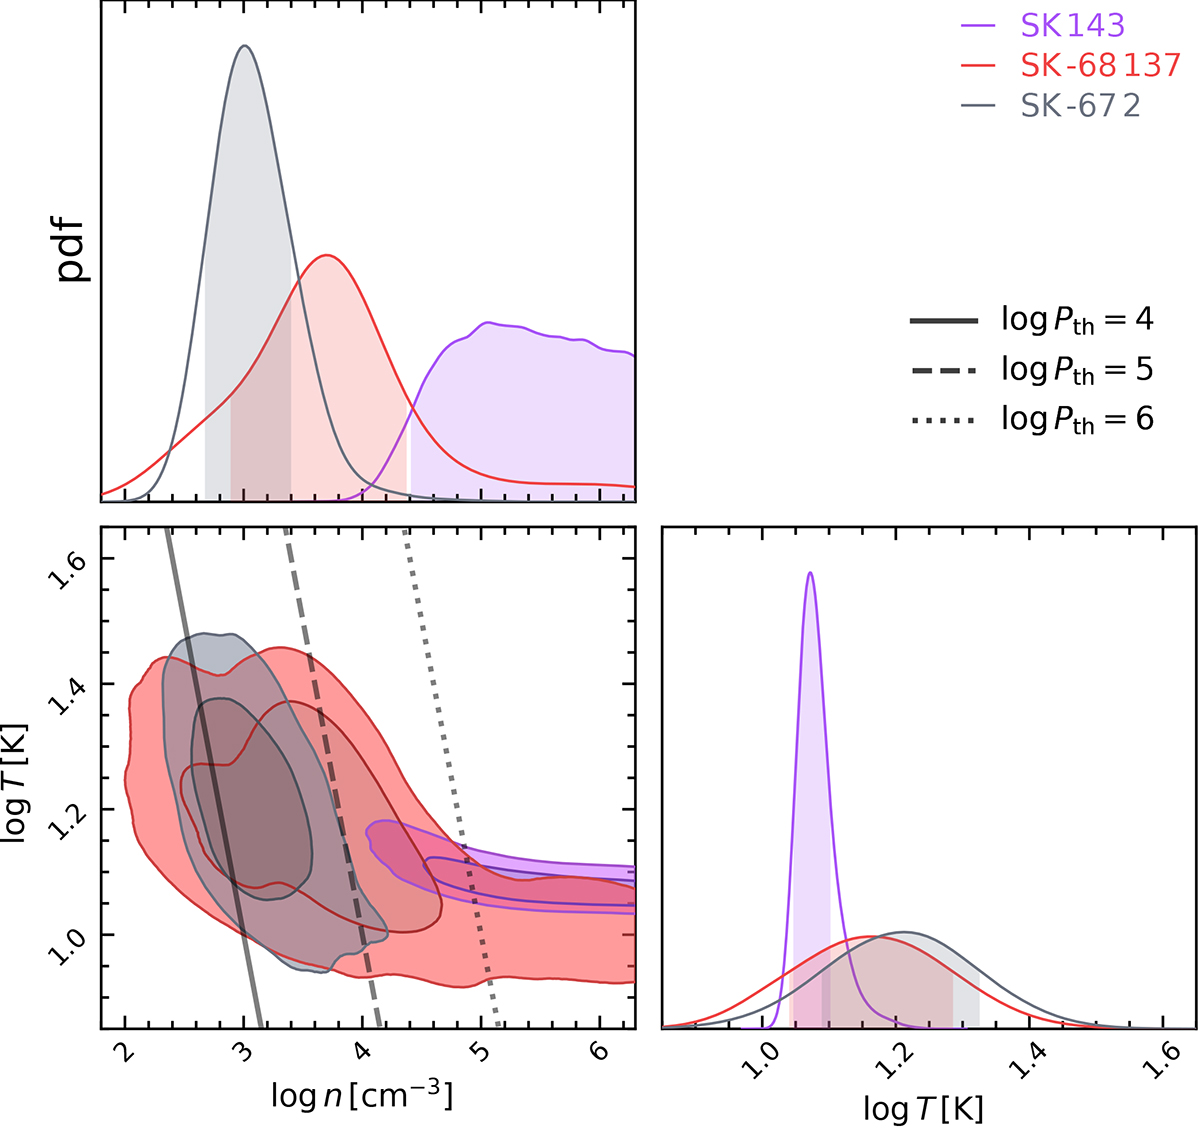
Fig. 4.
Download original image
Marginalised (1D – diagonal panel, and 2D – bottom left panel) posterior distributions of the number density and kinetic temperature in CO-bearing gas towards SK −67 2 (grey), SK −68 137 (red), and SK 143 (purple). The shaded regions depict 0.683 (1D and 2D) and 0.954 (2D) credible intervals. The solid, dashed, and dotted lines represent constant thermal pressures of 104, 105, and 106 cm−3 K, respectively.
Current usage metrics show cumulative count of Article Views (full-text article views including HTML views, PDF and ePub downloads, according to the available data) and Abstracts Views on Vision4Press platform.
Data correspond to usage on the plateform after 2015. The current usage metrics is available 48-96 hours after online publication and is updated daily on week days.
Initial download of the metrics may take a while.