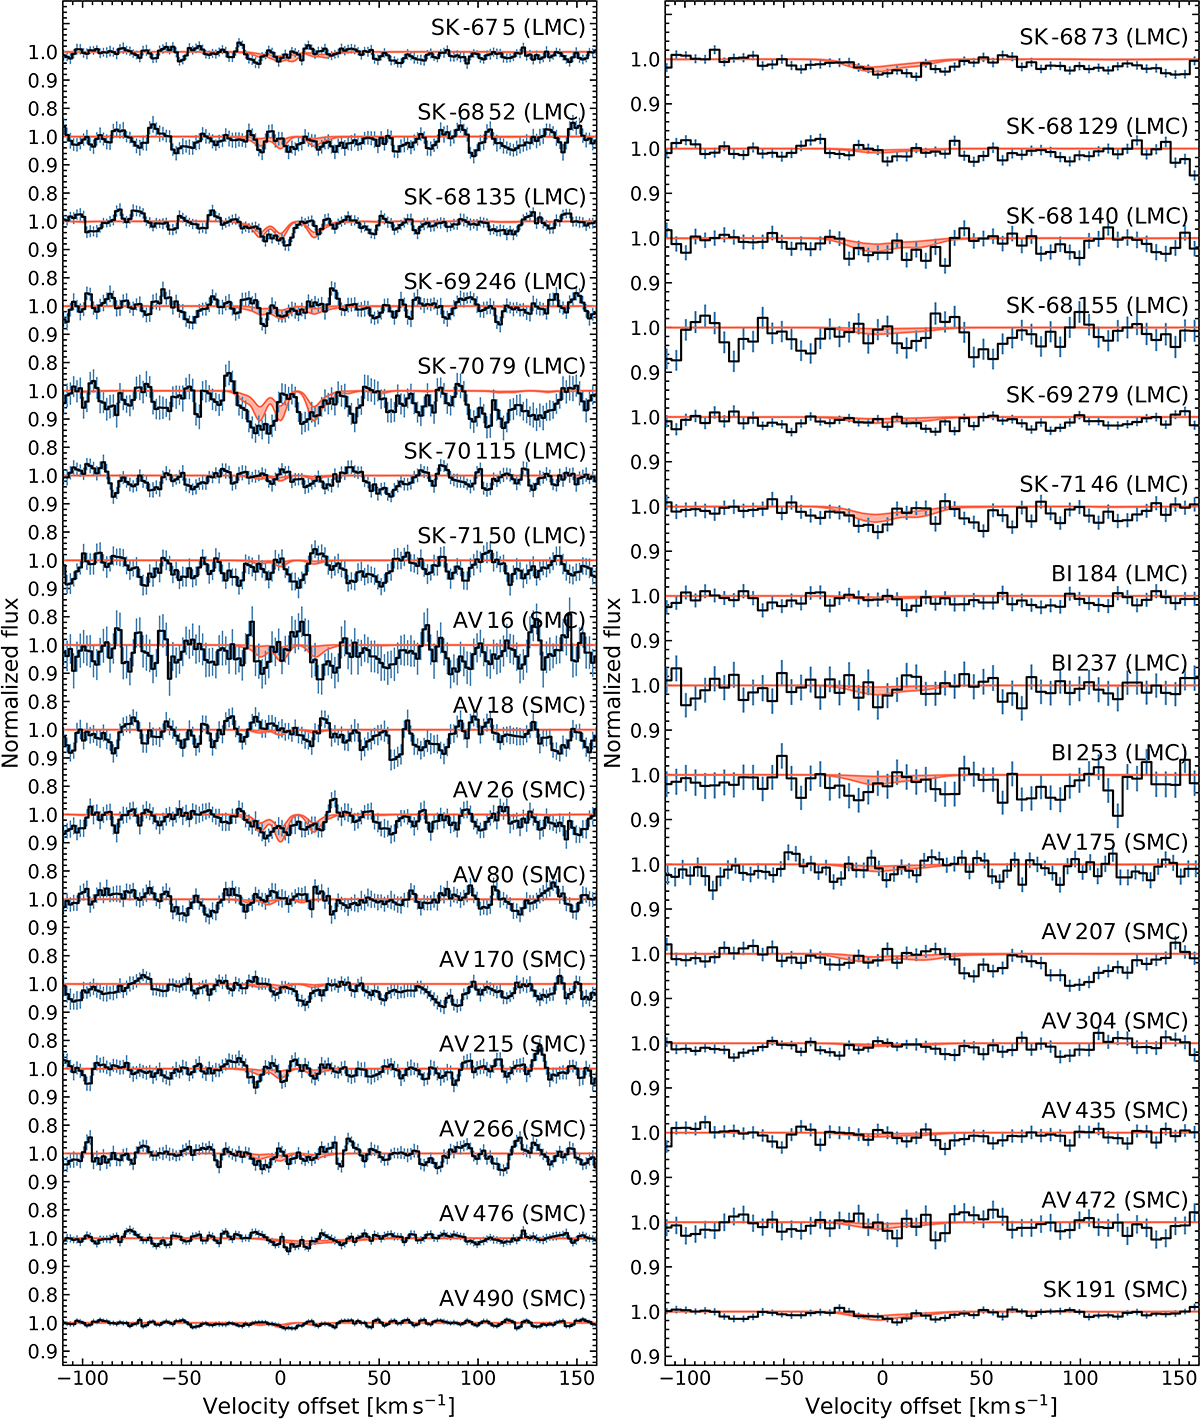
Fig. C.1.

Download original image
Stack of STIS (left column) and COS (right column) HST spectra of CO absorption lines towards LMC and SMC stars. The black lines with blue error bars represent the CO bands co-added spectrum (using R0 line as a reference line for each band to define the velocity offset), while the red lines correspond to the co-added fit profiles. Each spectrum is arbitrary shifted in y-axis for illustrative purposes. The name of each background star is provided above each spectrum. This includes three sightlines Sk −67 5, Sk −68 135, and Sk −69 246, where Bluhm & de Boer (2001), André et al. (2004) previously claimed CO detection, while HST data indicate non-detection with much lower upper limits on CO column densities, see Table C.1.
Current usage metrics show cumulative count of Article Views (full-text article views including HTML views, PDF and ePub downloads, according to the available data) and Abstracts Views on Vision4Press platform.
Data correspond to usage on the plateform after 2015. The current usage metrics is available 48-96 hours after online publication and is updated daily on week days.
Initial download of the metrics may take a while.


