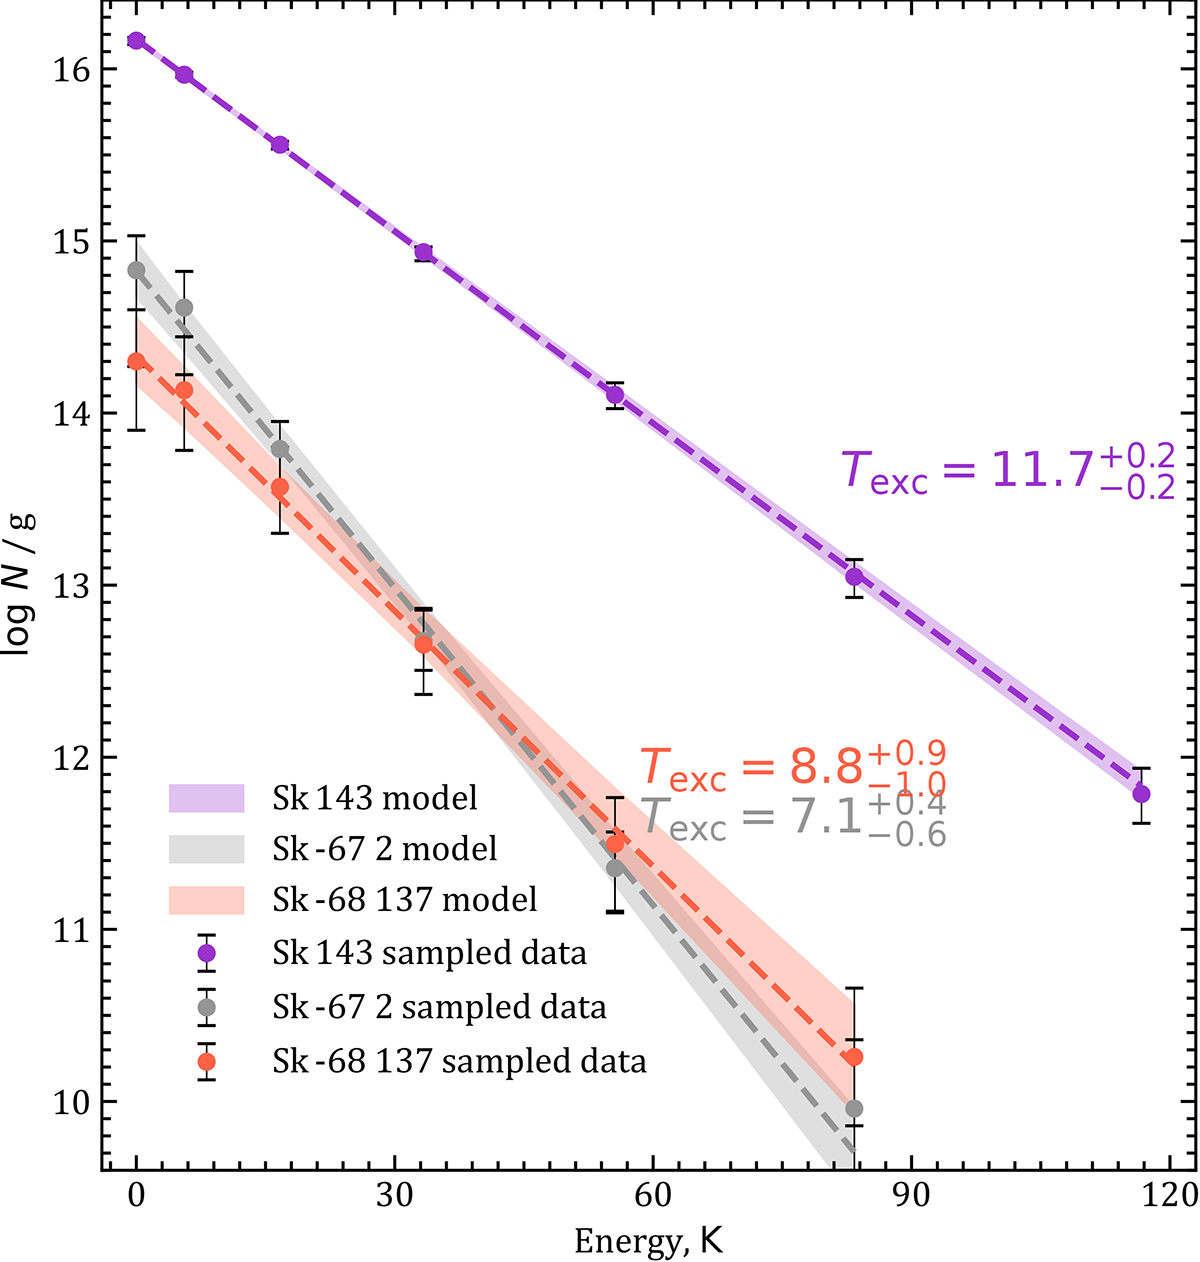
Fig. D.1.
Download original image
CO excitation diagram towards three CO absorption systems. The grey, red, and violet points indicate the column densities values sampled from the posterior distributions of the fit parameters using the model described in Sect. 2 for SK −67 2, SK −68 137, and SK 143, respectively. The stripes of the corresponding colours indicate the 0.683 credible region of the excitation diagram derived from the fit to the sampled column densities with Boltzmann law.
Current usage metrics show cumulative count of Article Views (full-text article views including HTML views, PDF and ePub downloads, according to the available data) and Abstracts Views on Vision4Press platform.
Data correspond to usage on the plateform after 2015. The current usage metrics is available 48-96 hours after online publication and is updated daily on week days.
Initial download of the metrics may take a while.