| Issue |
A&A
Volume 695, March 2025
|
|
|---|---|---|
| Article Number | A102 | |
| Number of page(s) | 16 | |
| Section | Atomic, molecular, and nuclear data | |
| DOI | https://doi.org/10.1051/0004-6361/202453312 | |
| Published online | 13 March 2025 | |
Hydroxylamine in astrophysical ices: Infrared spectra and cosmic-ray-induced radiolytic chemistry
1
Instituto de Estructura de la Materia, IEM-CSIC,
Calle Serrano 121,
28006
Madrid, Spain
2
Instituto de Fisica Fundamental, IFF-CSIC,
Calle Serrano 121,
28006
Madrid, Spain
3
HUN-REN Institute for Nuclear Research (Atomki),
Bem Tér 18/C,
Debrecen
4026, Hungary
4
Centro de Astrobiología (CAB), CSIC-INTA,
Carretera de Ajalvir Km. 4, Torrejón de Ardoz,
28850
Madrid, Spain
5
Institute of Chemistry, University of Debrecen,
Egyetem Tér 1,
Debrecen
4032, Hungary
6
Doctoral School of Chemistry, University of Debrecen,
Egyetem Tér 1,
Debrecen
4032, Hungary
7
Centre for Interstellar Catalysis (InterCat), Department of Physics and Astronomy, Aarhus University,
Aarhus
8000, Denmark
★ Corresponding author; belen.mate@csic.es
Received:
5
December
2024
Accepted:
28
January
2025
Context. Gas-phase hydroxylamine (NH2OH) has recently been detected within dense clouds in the interstellar medium. However, it is also likely present within interstellar ices, as well as on the icy surfaces of outer Solar System bodies, where it may react to form more complex prebiotic molecules such as amino acids.
Aims. In this work, we aim to provide infrared spectra of NH2OH in astrophysical ice analogues that will help in the search for this molecule in various astrophysical environments. Furthermore, we aim to provide quantitative information on the stability of NH2OH upon exposure to ionising radiation analogous to cosmic rays, as well as on the ensuing chemistry and potential formation of complex prebiotic molecules.
Methods. Ices composed of NH2 OH, H2O, and CO were prepared by vapour deposition, and infrared spectra were acquired between 4000–500 cm−1 (2.5–20 µm) prior to and during irradiation using 15 keV protons.
Results. Our spectroscopic characterisations determine that NH2OH ices deposited at 10–20 K adopt an amorphous structure, which begins to crystallise upon warming to temperatures greater than 150 K. In interstellar ice analogues, the most prominent infrared absorption band of NH2OH is that at about 1188 cm−1, which may be a good candidate to use in searches for this species in icy space environments. Calculated effective destruction cross-sections and G-values for the NH2 OH-rich ices studied show that NH2OH is rapidly destroyed upon exposure to ionising radiation (more rapidly than a number of previously studied organic molecules) and that this destruction is slightly enhanced when it is mixed with other icy species. The irradiation of a NH2OH:H2O:CO ternary ice mixture leads to a rich chemistry that includes the formation of simple inorganic molecules such as NH3, CO2, OCN−, and H2O2, as well as ammonium salts and, possibly, complex organic molecules relevant to life such as formamide, formic acid, urea, and glycine.
Key words: astrochemistry / molecular data / radiation mechanisms: general / solid state: volatile / ISM: molecules
© The Authors 2025
 Open Access article, published by EDP Sciences, under the terms of the Creative Commons Attribution License (https://creativecommons.org/licenses/by/4.0), which permits unrestricted use, distribution, and reproduction in any medium, provided the original work is properly cited.
This article is published in open access under the Subscribe to Open model. Subscribe to A&A to support open access publication.
1 Introduction
The rich diversity of molecules known to populate the interstellar medium (McGuire 2022) has spurred astrochemists to search for so-called prebiotic molecules whose chemical processing could conceivably lead to the formation of the fundamental building blocks of life-relevant compounds (i.e. amino acids, nucleobases, sugars, and lipids). Indeed, such searches have recently seen considerable success, with a number of prebiotic molecules such as urea (H2NCONH2), Z-ethenediol (HOC2H4OH), and ethanolamine (HOCH2CH2NH2) having been detected in dense molecular clouds over the past few years (Belloche et al. 2019; Rivilla et al. 2021, 2022).
One such molecule that was recently detected in the gas phase within dense molecular clouds is hydroxylamine (NH2OH) (Rivilla et al. 2020). This molecule, a derivative of ammonia, is known to be a key intermediate during the synthesis of amino acids and nucleotides (Sakurai & Yanagawa 1984; Snow et al. 2007; Becker et al. 2019; Zhu et al. 2020; Xu et al. 2022). It is therefore perhaps unsurprising that hydroxylamine has been the focus of several past astrochemical studies. Initial searches for this molecule in interstellar regions proved unsuccessful (McGuire et al. 2015; Ligterink et al. 2018), until it was definitively detected by Rivilla et al. in 2020. Laboratory studies have also considered viable methods for its formation and chemical evolution (Charnley et al. 2001; Congiu et al. 2012; Fedoseev et al. 2016; Tsegaw et al. 2017; Nguyen et al. 2019), while modelling efforts have focused on its relative abundance in the interstellar medium (He et al. 2015; Garrod et al. 2022; Molpeceres et al. 2023b). All efforts thus far seem to suggest that hydroxylamine is primarily synthesised in the solid phase within interstellar icy grain mantles, before being released to the gas phase through desorption or sublimation.
Rivilla et al. (2020) showed that gas-phase hydroxylamine in dense molecular clouds has a relatively low abundance of 2.1 × 10⁻¹⁰ with respect to H2. This observation is in line with predictions recently made by our chemical models (Molpeceres et al. 2023b), which have further predicted that the content of hydroxylamine within interstellar icy grain mantles should be enhanced to abundances of 10–7–10–8 with respect to H2. This would make hydroxylamine a comparatively abundant prebiotic molecule within ices. Given that hydroxylamine possesses both a hydroxyl (–OH) and an amine (–NH2) group, as well as a relatively labile N–O bond in its structure, it is conceivable that its radiolytic processing in the solid phase within interstellar icy grain mantles by impinging cosmic rays could lead to the formation of more complex prebiotic species, such as the aforementioned urea and ethanolamine, as well as, potentially, glycolamide (H2NCOCH2OH) or glycine (H2NCH2COOH).
As such, an accurate understanding of the radiolytic destruction (or stability) of hydroxylamine is imperative if its contribution to the formation of biologically relevant molecules in interstellar space is to be constrained. Although there exists a kinetic formalism for the inclusion of radiolysis in astrochemical models (Shingledecker & Herbst 2018), there is no theoretical framework to predict the likelihood of possible radiolytic reactions under astrophysical conditions. As such, laboratory experiments are critical in order to assess the cosmic-ray-induced radiation chemistry occurring in interstellar ices and thus provide data that may be fed into astrochemical models. Indeed, a wealth of studies has demonstrated that astrophysical ice analogues, when irradiated by ion or electron beams mimicking cosmic rays, host the synthesis of various molecules of direct relevance to biology and the origins of life (Hudson et al. 2008; Zhu et al. 2020; Kleimeier et al. 2021; Turner et al. 2021; Marks et al. 2023a; Zhang et al. 2023; Wang et al. 2024).
In the present study, we considered astrophysical ice analogues rich in hydroxylamine prepared by vapour deposition onto a cooled surface. Both single-component ices, as well as binary mixtures with H2O and ternary mixtures with H2O and CO, have been studied. Infrared (IR) absorption spectra of these ices have been acquired with the aim of generating spectroscopic data that may be of use to current high-resolution telescopes (e.g. the James Webb Space Telescope) in the search for solid-phase hydroxylamine in the interstellar medium or on the surfaces of icy outer Solar System bodies. The neat hydroxylamine ices, together with the binary and ternary mixtures, were then subjected to irradiation using 15 keV protons as cosmic ray analogues with the aim of quantifying the radiolytic destruction of hydroxylamine under realistic astrophysical conditions and characterising the chemical products of irradiation. Further details of the experimental apparatus and methodologies used in this study are given in Section 2, and the results of our study are presented and discussed in Section 3 and 4, respectively. Finally, concluding remarks are given in Section 5.
2 Apparatus and methodology
Experiments were carried out at two laboratories: IR spectroscopic characterisations were performed at the Instituto de Estructura de la Materia of the Consejo Superior de Investigaciones Científicas (IEM-CSIC) in Madrid, Spain, while proton irradiation studies were carried out at the HUN-REN Institute for Nuclear Research (Atomki) in Debrecen, Hungary.
2.1 Experiments performed at IEM-CSIC
The experimental setup at IEM-CSIC has been described in detail in previous publications (e.g. Maté et al. 2024). Briefly, the setup consists of a high vacuum chamber with a base pressure of 5 × 10⁻⁸ mbar at room temperature. The chamber is equipped with a closed-cycle helium cryostat as well as a Fourier-transform IR spectrophotometer (Bruker Vertex 70) with an external mercury-cadmium-telluride (MCT) detector. Within the chamber is a 2-mm-thick KBr substrate held in thermal contact with the cold finger of the cryostat whose temperature can be controlled between 10–300 K with an accuracy of 0.5 K.
Neat hydroxylamine ices were prepared by the deposition of the vapour generated by the thermal decomposition of the solid hydroxylammonium phosphate  salt, supplied by Santa Cruz Biotechnology. The salt was placed in a homemade sublimation oven located within the chamber, and the cooled KBr deposition substrate was rotated to directly face the oven. The oven was subsequently warmed to 37 °C and, having equilibrated at this temperature, its shutter was opened to allow for the deposition of hydroxylamine onto the substrate surface. After several minutes of deposition, the oven shutter was closed and the deposition substrate was rotated to face the incident IR spectroscopic beam. Transmission absorption spectra were acquired as an average of 300 scans across a wavenumber range of 4000–500 cm–1 and at a resolution of 4 cm–1.
2.2 Experiments performed at HUN-REN Atomki
Experiments at HUN-REN Atomki were carried out using the recently commissioned AQUILA setup, which has been described in detail in the work of Rácz et al. (2024). The AQUILA consists of an ultra-high vacuum chamber operating at a base pressure of a few 10–9 mbar that is installed as a permanent end station to an electron cyclotron resonance ion source (ECRIS) that can supply a number of versatile ion beams able to simulate extra-terrestrial radiation (Biri et al. 1997, 2021; Rácz et al. 2012). Within the centre of the chamber is a 3-mm-thick ZnSe deposition substrate that is held in thermal contact with the cold finger of a closed-cycle helium cryostat, allowing the temperature of the substrate to be controlled between 20 and 300 K with an accuracy of 0.2 K.
Similar to the experiments conducted at IEM-CSIC, hydroxylamine ices could be prepared on the cooled ZnSe substrate through the thermal decomposition of the  salt, this time using a commercial effusive evaporator (Createc OLED-40-10-WK-SHM). After rotating the deposition substrate to directly face the nozzle of the effusive evaporator, the salt was warmed to 37 °C and allowed a few minutes to equilibrate at this temperature. Subsequently, the shutter to the effusive evaporator was opened for a few minutes to allow for hydroxylamine vapour to condense onto the cooled deposition substrate.
To prepare binary and ternary ices containing hydroxylamine mixed with H2O (or D2O) and/or CO, vapours of these volatile species were introduced into the main chamber of the AQUILA through a separate dosing line during the deposition of the hydroxylamine so as to generate a co-deposited ice mixture. It is important to note that the geometry of the chamber as well as the radiation shield surrounding the cooled ZnSe deposition substrate prevent significant deposition of the volatile species onto the rear side of the substrate (see Herczku et al. 2021 and Rdcz et al. 2024 for more details).
Once an ice had been prepared, the deposition substrate was rotated to face an incident IR spectroscopic beam supplied by a Bruker Vertex 70v spectrophotometer (coupled to an external MCT detector) and a transmission absorption spectrum of the prepared ice was acquired as an average of 300 scans over a wavenumber range of 4000–650 cm–1 and at a resolution of 4 cm–1. This spectrum could then be used to quantify the abundance of a certain species of molecule within the ice through measurement of its column density N (molecules cm–2), which is related to the integrated absorbance of a characteristic IR absorption band, I (cm–1), as follows:
 (1)
(1)
where Av is the band strength constant associated with that particular band.
Although Luckhaus (1997) provided experimental and theoretical band strength constants for gas-phase hydroxylamine (quantifying Av = 2.9 × 10⁻¹⁸ cm molecule–1 for the NH2 wagging mode at 1115 cm–1), to the best of our knowledge band strength constants for solid hydroxylamine at low temperatures have not yet been evaluated. Indeed, previous astrochemical studies have had to make assumptions regarding the band strength constants of the IR absorption features of solid-phase hydroxylamine. For example, Tsegaw et al. (2017) made use of a band strength of Av = 4.16 × 10⁻¹⁸ cm molecule–1 for the NOH bending mode at 1486 cm–1, which they adopted from a theoretical calculation performed by Saldyka & Mielke (2003) for the NH2OH-CO dimer. On the other hand, Jonusas & Krim (2016) made use of a band strength constant of Av = 1.2 × 10⁻¹⁷ cm molecule–1 for the NH2 wagging mode at 1194 cm–1. This value was itself adopted by comparing to a similar vibrational mode (i.e. the umbrella mode at 1070 cm–1) in the spectrum of solid NH3 ice, for which the reported band strength ranges from Av = 1.3 × 10⁻¹⁷ cm molecule–1 (Zanchet et al. 2013) to Av = 1.7 × 10⁻¹⁷ cm molecule–1 (Hudson et al. 2022). In this present work, we experimentally estimated the band strength constant of the NH2 wagging mode (which appears at about 1188 cm–1 in our spectra) to be Av = 9 × 10–18 cm molecule–1, with an expected uncertainty of 30%. Details on how this value was estimated may be found in Appendix A.
Having quantified the column density of hydroxylamine in this way, the thickness of a neat hydroxylamine ice, h (μm), can be calculated as follows:
 (2)
(2)
where m is the molar mass of the molecule (g mol–1), ρ is the ice density (g cm–3), and NA is the Avogadro constant.
As is evident from Eq. (2), calculating the thickness of the ice in this way requires knowledge not only of the column density of the deposited hydroxylamine, but also of its density. Meyers & Lipscomb (1955) reported a density of 1.4 g cm–3 for a perfect crystal of hydroxylamine, but it appears that the density of the amorphous solid at temperatures relevant to astrochemistry has not yet been measured. We therefore adopted an estimated density of 1 g cm−3 for the amorphous solid at 20 K based on the typical lower density of vapour-deposited amorphous solids compared to the density of their corresponding crystalline structures as measured through crystallographic techniques.
The use of Eq. (2) can also be applied to the mixed ices considered in this study. For these ices, the total ice thickness was approximated as being:
 (3)
(3)
where fi is the fractional abundance of an ice mixture component and hi is the thickness that that component would adopt were it a single-component ice. The integrated band strength constants and densities of the ice mixture components used to calculate the compositions and thicknesses of the mixed ices are given in Table 1.
Once the initial column densities and thicknesses of the hydroxylamine-containing ices had been successfully quantified, the ices were exposed to a 15 keV proton beam supplied by the ECRIS that impacted the ice at an angle of 45°. The penetration ranges and linear energy transfers of the proton beams into our ice samples were estimated using the Stopping and Range of Ions in Matter (SRIM) software (Ziegler et al. 2010). In each case, the ice was irradiated in fluence steps of 6 × 10¹³ protons cm–2 after each of which an IR absorption spectrum was acquired so as to discern any radiation-induced changes to the structure and chemical composition of the ice. A summary of the irradiation experiments performed in this study is given in Table 2.
Densities and IR band strength constants used in this study.
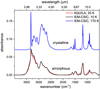 |
Fig. 1 IR absorption spectra of amorphous hydroxylamine ices prepared by vapour deposition at 10 K (setup at IEM-CSIC; black trace) and 20 K (AQUILA setup at HUN-REN Atomki; red trace), and of crystalline hydroxylamine ice prepared by deposition at 10 K and warming to 170 K (blue trace). We note that amorphous and crystalline spectra are vertically offset for clarity. |
3 Results
3.1 IR spectroscopic characterisation of hydroxylamine ice
The IR absorption spectra of pure amorphous and crystalline hydroxylamine ice are shown in Fig. 1. It is worth noting that the spectra of hydroxylamine prepared by vapour deposition at 10 K (IEM-CSIC) and 20 K (HUN-REN Atomki) are nearly identical and correspond to an amorphous ice structure, as evidenced by the broad absorption features present in these spectra. When the ice prepared at 10 K was warmed at a rate of 10 K min–1, an amorphous-to-crystalline phase transition was observed, which started at 150 K and appeared to be complete by 170 K. Indeed, the IR absorption spectrum acquired at 170 K is characterised by many of the expected features of crystalline ice, including narrower absorption features and band splitting. Further warming of the ice resulted in its sublimation at a temperature of about 180 K.
The major IR absorption features visible in the spectra of amorphous and crystalline hydroxylamine ice are assigned in Table 3. These assignments have been made with reference to the previous works of Nightingale & Wagner (1954) and Luckhaus (1997). To the best of our knowledge, the work of Nightingale & Wagner (1954) provided the only IR absorption spectra of low-temperature hydroxylamine that were acquired experimentally. Indeed, the method according to which they prepared their ices is similar to the vapour deposition methodology used in the present study. The later work of Luckhaus (1997) was a combined experimental and theoretical study of the ro-vibrational spectrum of gaseous hydroxylamine, with band assignments being made on the basis of calculations.
We note in passing that, although several previous astrochemical studies have considered the formation of hydroxylamine as a result of, for example, the energetic processing of precursor species (Tsegaw et al. 2017) or the non-energetic hydrogenation of nitric oxide (Fedoseev et al. 2016; Nguyen et al. 2019), none of these studies provided a spectrum of neat, solid hydroxylamine at low temperatures. The study of Jonusas & Krim (2016) did provide a spectrum of a NH2OH:H2O mixed ice, but this was a consequence of the low vapour pressure of hydroxylamine that precluded those authors from preparing a neat hydroxylamine ice free from contamination from residual water in their high vacuum setup.
IR absorption spectra of different ice mixtures containing hydroxylamine are presented in the left panels of Fig. 2. Band assignments for hydroxylamine in these ice mixtures are also provided in Table 4, and it is possible to note that a number of bands undergo shifts (typically of less than 10 cm–1) in their peak positions, as well as band broadening due to changes in the matrix environment (Fig. 2, Table 4). Furthermore, a new absorption band at about 1100 cm–1 is evident in the spectra of the binary and ternary mixed ices (Fig. 2), which we tentatively attribute to NH3 (Hudson et al. 2022). We speculate that it is possible that a low-temperature reaction may be occurring in the ice mixture in which hydroxylamine is reduced to ammonia, although further studies are recommended to confirm this.
Summary of irradiation experiments performed in this study.
Assignments for IR absorption bands in the spectra of amorphous (20 K) and crystalline (170 K) hydroxylamine ice.
Assignments for IR absorption bands in the spectra of hydroxylamine in mixtures with H2O (or D2O) and/or CO at 20 K.
3.2 Irradiation with 15 keV protons
The irradiation of solid-phase hydroxylamine with 15 keV protons results in its destruction. Assuming that this radiolytic destruction follows first-order kinetics, it can be modelled by the following equation:
 (4)
(4)
where F is the ion fluence and  is a parameter termed the effective destruction cross-section. It is very important to note that this parameter is not identical to the destruction crosssection term that is typically used in ion-molecule collision physics studies (see the work of Ivlev et al. (2023) as an example). This is primarily due to the fact that true destruction cross-sections can only be defined for collisions in which there is negligible change in the kinetic energy and momentum of the projectile particle, which is not the case in our experiments. Moreover, the effective destruction cross-section given in Eq. (4) takes into account any sputtering of the hydroxylamine into the gas phase as a result of the collision of the projectile proton, which is not the case for true destruction cross-sections that only take into account molecular destruction through radiolytic dissociation. Nevertheless, the effective destruction cross-section parameter is useful to gauge the radiolytic resistance of molecules to ionising radiation used in laboratory experiments to mimic the effects of galactic cosmic rays (see, for instance, previous works by Maté et al. 2011, 2018, 2021; Herrero et al. 2022) and thus can be utilised to gain insights into astrochemical processes.
As shown in Eq. (1), the molecular column density of hydroxylamine at a given ion fluence is proportional to the intensity of its absorption bands as measured from acquired IR absorption spectra. Substituting Eq. (1) into Eq. (4) yields:
 (5)
(5)
where I0 and IF, respectively, represent the integrated area of a characteristic hydroxylamine absorption band prior to irradiation and at a given fluence F.
It is also important to note that as the hydroxylamine- containing ice is irradiated, its chemical composition will change, and new products can be formed that may take part in secondary reactions. This may lead to a deviation from the exponential decay of hydroxylamine described by Eq. (4); however, it is possible to assume that this equation is accurate during the initial stages of irradiation when radiolytic dissociation should be the only major contributor to hydroxylamine destruction.
The right panels of Fig. 2 depict the evolution of the IR absorption spectra of the four ices containing hydroxylamine that were considered in this study as a function of proton fluence. Although it would be ideal to calculate effective destruction cross-sections from all the apparent hydroxylamine absorption bands (as these different cross-sections will provide information on the various possible radiolytic mechanisms taking place), these spectra demonstrate that this is not possible for several of the absorption bands due either to their overlap with other components in the ice (i.e. H2O or CO) or with the absorption bands of products formed as a result of radiolysis. For instance, the hydroxylamine NH and OH stretching modes in the 3000 cm–1 region overlap with the broad and strong OH stretching modes of water. Furthermore, the hydroxylamine HNH and HNO bending modes in the 1500–1450 cm–1 region of the spectrum overlap with the broad bending mode of water at about 1600 cm–1, as well as with a number of features attributable to radiolytic products. The hydroxylamine NO stretching mode at about 920 cm–1 also overlaps with the libration mode of water.
Fortunately, the hydroxylamine NH2 wagging mode at about 1188 cm–1 remains fairly isolated from other absorption bands throughout the irradiation experiment, and it is therefore a good candidate to measure with the aim of quantifying effective destruction cross-sections. It is to be noted, however, that in the ice mixture containing D2O the NH2 wagging mode of hydroxylamine overlaps with the D2O bending mode. To overcome this problem, we assumed that D2O is not destroyed to any significant degree during irradiation, and therefore a constant contribution of D2O to this absorption band at 1188 cm–1 could be subtracted at different fluences to determine the extent of hydroxylamine destruction. However, the hydroxylamine OH and NO stretching modes, respectively located at about 3000 cm–1 and 920 cm–1, are free from overlap with other absorption features in the ice mixture containing D2O; thus, they could be utilised to quantify the effective destruction cross-section.
Overall, the radiolysis-induced decay of the hydroxylamine NH2 wagging mode at approximately 1188 cm–1 was used to quantify the effective destruction cross-section of hydroxylamine in all four studied ices. Additionally, the decay of the OH stretching mode at 2600 cm–1 was used to quantify the effective destruction cross-section in the neat hydroxylamine ice as well as the ternary mixture containing D2O. The effective destruction cross-section of hydroxylamine in this latter ice mixture was also calculated by measuring the decay of the NO stretching mode at about 920 cm–1. The left panels of Fig. 3 show the normalised decay trends of the relevant hydroxylamine absorption band areas. Effective destruction cross-sections were determined by fitting a linear trend to the natural logarithmic representation of this data (this is shown in the right panels of Fig. 3) and by only considering the initial fluence steps of the irradiation process.
After evaluating the effective destruction cross-section, it is possible to estimate the half-life dose, D1/2; this is defined as the amount of energy that must be deposited into the ice in order to reduce the abundance of hydroxylamine to half of its original value. From Eq. (4), the fluence required to achieve this reduction in hydroxylamine is given as:
 (6)
(6)
The half-life dose can therefore be expressed as:
 (7)
(7)
where E is the kinetic energy of the impacting protons (i.e. 15 keV) and fE is the fraction of this energy deposited into the ice during irradiation. If it is assumed that the energy imparted by the ions to the ice sample is done so in a homogeneous manner, Eq. (7) can be re-written in terms of the linear energy transfer (LET) of the protons and the density of the ice:
 (8)
(8)
The LET of the protons, together with the density of the ice and the effective destruction cross-section, may be used to quantify another parameter often used in radiation chemistry studies: the so-called G-value of hydroxylamine. This is defined as the number of hydroxylamine molecules that undergo radiolysis per 100 eV of energy that is deposited into the ice and is given as:
 (9)
(9)
As stated previously, the linear energy transfers of the 15 keV protons in the four ices considered in this study were calculated using the SRIM software. The calculated linear energy transfers, effective destruction cross-sections, and G-values are summarised in Table 5.
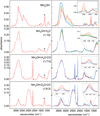 |
Fig. 2 IR absorption spectra of ice mixtures containing hydroxylamine grown by vapour deposition at 20 K using the AQUILA setup. Left panels: IR spectra acquired prior to irradiation, with the absorption band at 1188 cm−1 indicated by an asterisk. Right panels: evolution of IR absorption spectra during irradiation with 15 keV protons. In each panel, the initial IR spectrum is given by the red trace, and the final spectrum at the end of the irradiation experiment is given by the blue trace. |
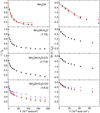 |
Fig. 3 Hydroxylamine IR band decay as a function of proton fluence. Left panels: normalised absorption band area decay for three distinct IR vibrational modes (black squares: NH2 wagging mode; red circles: OH stretching mode; blue triangles: NO stretching mode). We note that lines between the individual data points are not fits and are plotted solely to guide the eye. Right panels: natural logarithmic representation of data plotted in the left panels. We note that, in this case, the straight lines are linear trend lines fitted to data points at low proton fluences. |
Calculated radiolytic destruction parameters of hydroxylamine-containing ices irradiated by 15 keV protons.
3.3 Radiolytic chemistry at 20 K
The irradiation of neat hydroxylamine ice with 15 keV protons resulted in the almost complete destruction of this molecule, as indicated by the data plotted in Fig. 3. To better identify IR absorption features attributable to radiolytic product species, the spectrum acquired at the end of the irradiation experiment is plotted alongside the scaled spectra of neat hydroxylamine and neat water ices at 20 K (Fig. 4), thus allowing for the maximum amount of surviving hydroxylamine to be visualised. It is evident from Fig. 4 that water is a major radiolytic product, although absorption features that can be ascribed to other molecules are also evident. These include bands at 3376, 1640, and 1125 cm–1 whose positions are most commensurate with the asymmetric stretching, degenerated deformation, and symmetric deformation vibrational modes of ammonia, respectively. This is in agreement with the previous theoretical work of Wang et al. (2010), who proposed that the major dissociation reaction is:
 (10)
(10)
Indeed, absorption bands visible at about 2800 and 1500 cm–1 (Fig. 4) are likely associated with the NH stretching and HNO bending modes of the HNO molecule, respectively (Jacox & Milligan 1973).
In the case of the irradiation of the NH2OH:H2O (1:10) mixed ice, it is difficult to observe the formation of new bands due to the intense and broad absorption features of water. Indeed, when analysing the difference spectrum (i.e. the spectrum obtained when subtracting the initial, pre-irradiation spectrum from that acquired after the end of the irradiation process), it is only possible to recognise IR absorption features associated with the formation of water (Fig. 4). It is, however, possible to note that the radiolytic destruction of hydroxylamine is still quite extensive, as evidenced by the decay of the band at 1188 cm–1 with increasing proton fluence (Fig. 3). As such, the dominant chemical process taking place is likely similar to that suggested by Feller & Dixon (2003):
 (11)
(11)
Perhaps unsurprisingly, the richest chemistry in our experiments was observed during the irradiation of the ternary NH2OH:H2O(D2O):CO ice mixtures (Fig. 4). No attempt to characterise the radiolytic products has been made in the case of the experiment involving D2O, primarily due to a lack of information as to the wavenumber positions of the absorption bands of the relevant deuterated molecules in the solid phase.
The same difference spectrum given in the lower panel of Fig. 4 for the irradiated NH2OH:H2O:CO ice mixture is plotted in the top panel of Fig. 5, where it is possible to more clearly identify the positive absorption bands of a number of radiolytic product molecules. The strongest of these absorption bands is that at 2343 cm–1, which is ascribed to the asymmetric stretching mode of CO2; combination modes for this molecule are also present at 3700 and 3591 cm–1. Other simple molecules detected by means of this spectrum include H2O2 (2843 cm–1), C3O and / or N2O (2244–2238 cm–1), HNCO (2263 cm–1), OCN– (2174 cm–1), CN− (2065 cm–1), HCO (1850 cm–1), and NH3 (1096 cm–1; very weak). These assignments were made on the basis of the previous works of Gerakines et al. (1996), Brucato et al. (2006), Loeffler et al. (2006), and Gálvez et al. (2010). Furthermore, features associated with  (1431 cm–1) and HCOO– (1386 cm–1) ions are observable in the difference spectrum (Fig. 5). A list of band assignments for these radiolytic products is given in Table 6.
To assist with the identification of more complex organic species such as formic acid (HCOOH), formamide (NH2CHO), or urea, the low-temperature spectra of these molecules in the solid phase are depicted in Fig. 5. These spectra were taken from the works of Brucato et al. (2006), Gerakines et al. (1996), Bergantini et al. (2014), and Timón et al. (2021) and correspond to neat ices prepared at temperatures of 15-20 K. Considering that changes in the matrix environment of a cryogenic solid typically alter the positions of its main IR absorption bands by about 10 cm–1, it is possible to propose that these three complex organic molecules are good radiolytic product candidates. The presence of both carbamic acid (NH2COOH), whose main IR absorption features are at 1691, 1451, and 1320 cm–1 ; and carbonic acid (H2CO3), which displays three equally intense features at 1714, 1598, and 1313 cm–1, cannot be excluded (Moore & Khanna 1991; Brucato et al. 1997; James et al. 2020, 2021; Marks et al. 2023b). IR absorption spectra of the neutral and zwitterionic forms of glycine, taken from the work of Maté et al. (2011), are also depicted in Fig. 5; it is possible to note that the main absorption features of this amino acid coincide with regions of the difference spectrum in which there is an absorbance gain. As such, it is possible to suggest that glycine is among the radiolytic products.
To obtain additional information on the radiation chemistry taking place in the ternary NH2OH:H2O:CO ice as a result of its exposure to 15 keV protons, a post-irradiative temperatureprogrammed desorption (TPD) experiment was performed in which the ice was warmed at a rate of 1 K min−1. IR absorption spectra acquired during this TPD experiment are depicted in Fig. 6. Sublimation of the components of the irradiated ice mixture is anticipated to follow a trend of decreasing volatility, and CO was indeed the first molecule observed to sublime, followed by CO2. The sublimation of CO2 was accompanied by the greater formation of OCN− (i.e. in addition to that produced radiolytically), whose absorption band peak shifts from 2174 cm–1 to 2165 cm–1. This band begins to decrease during the sublimation of water and eventually disappears by a temperature of 220 K.
An interesting result of the TPD experiment was that, during the phase transition of water from amorphous to crystalline at 140–160 K (Hagen et al. 1981), the absorption bands associated with the HCOO– (1588, 1386, and 1350 cm–1) and  (1450 cm–1) ions were observed to grow (Fig. 6). It is possible that the rearrangement of water molecules in the ice matrix allowed for the better diffusion of these ions to yield salt products, including ammonium formate
  and ammonium cyanate
  . Similar results were previously reported by Gálvez et al. (2010) and Maté et al. (2012). Once the sublimation of water was practically completed at 200 K, the IR absorption spectrum was dominated by the features of these two salts: bands associated with
  are clearly visible at 3200 and 1450 cm–1 in the spectrum acquired at 200 K, together with bands associated with OCN– at 2175 cm–1 and with HCOO– at 1588, 1386, and 1350 cm–1. Other bands also visibly increase in intensity upon warming to 200 K, such as those at 1312, 1060, and 1000 cm–1 (marked with asterisks in the middle panel insert of Fig. 6), whose carriers could not be unambiguously identified.
At temperatures greater than 200 K, ammonium formate was observed to thermally decompose into ammonia and formic acid, which in turn undergo sublimation. Ammonium cyanate is also removed from the deposition substrate, but at a slightly higher temperature of 220 K, as discussed previously. This allows for other, more refractory, organic species present in lower abundances to be identified in higher temperature IR absorption spectra. To aid in constraining the identity of these species, it is possible to compute the difference spectrum across a given temperature interval. For a difference spectrum produced as a result of subtracting the spectrum acquired at a temperature T1 from that acquired at another temperature T2 (i.e. T2 – T1, where T1 > T2), it is possible to associate positive absorption bands in the resultant difference spectrum with material that has undergone sublimation across this temperature interval. Fig. 7 depicts the difference spectrum obtained in this way using IR absorption spectra acquired at 260 and 280 K during the TPD experiment, along with the spectrum of neat zwitterionic glycine for comparative purposes. Given the similarities between these spectra, together with previous reports of glycine undergoing sublimation at 280 K under ultra-high vacuum conditions (Esmaili et al. 2018), it is possible that glycine is indeed a product of the radiolysis of the ternary ice mixture considered in this study.
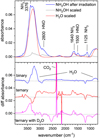 |
Fig. 4 IR spectra acquired to assess the major radiolytic products of the studied ices. Top panel: spectrum of neat hydroxylamine ice after irradiation with 15 keV protons (blue trace), together with spectra of amorphous water (red trace) and neat hydroxylamine ices (grey trace) scaled to match the amount of water formed and the hydroxylamine that survives at the end of the irradiation. Bottom panel: difference spectra (i.e. the initial pre-irradiation spectrum subtracted from that acquired at the end of the experiment) of the three ice mixtures containing hydroxylamine that were considered in this study. We note that two of the spectra in this panel have been vertically offset for clarity. |
Band assignments for products formed during irradiation of the NH2OH:H2O:CO ternary ice mixture using 15 keV protons.
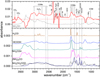 |
Fig. 5 Analysis of potential complex organic molecules (COMs) formed as a result of irradiating hydroxylamine-containing ices. Top panel: difference spectrum (i.e. the initial pre-irradiation spectrum subtracted from the final spectrum acquired after the end of the irradiation process) of the ternary NH2OH:H2O:CO ice (red solid trace). Also shown is the spectrum of neat hydroxylamine (grey dashed trace) to compare against the negative peaks associated with molecular destruction in the difference spectrum. Bottom panel: IR absorption spectra of candidate COM products assembled from the literature (Gerakines et al. 1996; Brucato et al. 2006; Maté et al. 2011; Bergantini et al. 2014; Timón et al. 2021). From top to bottom, these are spectra of formaldehyde, formic acid, formamide, urea, and neutral (dashed line) and zwitterionic (solid line) glycine. |
Possible complex organic molecules present in irradiated the NH2OH:H2O:CO ternary ice.
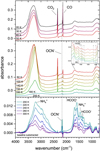 |
Fig. 6 Evolution of IR absorption spectra of 15 keV proton-irradiated NH2OH:H2O:CO ice upon warming at a rate of 1 K min–1. |
4 Discussion
4.1 IR absorption spectroscopy
One of the main aims of this study was the characterisation of the IR absorption spectra of hydroxylamine-containing ices under conditions relevant to astrochemistry. In this regard, our experiments have demonstrated that the preparation of hydroxylamine ice by background condensation of the gas at 10–20 K results in an amorphous structure. Warming the resultant ice to higher temperatures does not result in any thermal decomposition; however, a phase transition to a more ordered crystalline form begins at 150 K and is largely complete by 170 K (Fig. 1). The formation of this crystalline phase was evident through the appearance of new resolved IR features and the sharpening of bands, as has been observed for several other molecular ices (Hudson et al. 2014, 2017, 2020; Timón et al. 2021; Hudson & Yarnall 2022; Mifsud et al. 2023, 2024): for instance, a single broad band at about 1503 cm–1 in the spectrum of the amorphous ice is resolved to a doublet structure with peaks at 1558 and 1507 cm–1 in the spectrum of the crystalline phase. Further warming of the hydroxylamine ice to temperatures of 180 K and above resulted in the sublimation of the ice, which is consistent with the view of hydroxylamine being a less volatile species than water under conditions relevant to astrochemistry (Molpeceres et al. 2023b).
The strongest absorption features in the IR spectrum of solid hydroxylamine are the OH and NH stretching modes. However, these bands overlap with the low-frequency wing of the broad and strong OH stretching mode of water, and thus they are not easy to identify in ice mixtures dominated by water. As such, it is likely that these two hydroxylamine vibrational modes are not good candidates for the search for icy hydroxylamine in space environments using high-resolution and high-sensitivity instruments such as the James Webb Space Telescope. Instead, we propose that the band at about 1188 cm–1, which remains clearly identifiable in ice mixtures containing both H2O and CO (Fig. 2), is a better candidate for this purpose.
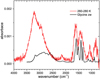 |
Fig. 7 Difference spectrum generated using IR absorption spectra acquired at temperatures of 260 and 280 K during the TPD experiment (red trace) shown alongside a spectrum of neat zwitterionic glycine (black trace). |
4.2 Radiolytic destruction of hydroxylamine
Another goal of our study was to quantify the radio-resistance of solid hydroxylamine during its irradiation by 15 keV protons, which were used as analogues of galactic cosmic rays. To achieve this goal, effective destruction cross-sections were quantified for all the investigated hydroxylamine-containing ices by following the decay of the IR absorption band at about 1188 cm–1 (Table 5). This band corresponds to the NH2 wagging mode and possibly samples the following dissociation reaction:
 (12)
(12)
An analysis of the effective destruction cross-sections given in Table 5 reveals a slightly slower rate of radiolytic destruction for neat hydroxylamine ice compared to the binary mixture with H2O and the ternary mixture with H2O and CO. Moreover, since the effective destruction cross-section of hydroxylamine in the ternary ice mixture containing D2O could be calculated not only from the decay of the NH2 wagging mode at 1188 cm–1, but also from the decay of the OH and NH stretching modes at about 2600 and 920 cm–1, respectively, it is possible to compare these values to one another. It is evident that, to a first approximation, the effective destruction cross-sections calculated from these IR absorption bands are similar within experimental error limits.
It is also possible to compare the calculated half-life doses shown in Table 5 to those previously calculated for other complex organic molecules relevant to astrochemistry, such as glycine, urea, methyl isocyanate, and 2-aminooxazole (Maté et al. 2011, 2018, 2021; Herrero et al. 2022). Comparisons reveal that the half-life dose of hydroxylamine is significantly lower than those calculated for these other organic species of interest (see Maté et al. 2021 and references therein for more information), implying that hydroxylamine in interstellar ices is significantly less radio-resistant during cosmic-ray irradiation. This result, taken with the fact that the half-life doses of complex organic molecules are generally smaller than those of the underlying dust grains in interstellar clouds (Maté et al. 2016; Molpeceres et al. 2017) and the arguments previously made by Molpeceres et al. (2023b) as to the overall low abundance of hydroxylamine in the gas-phase, helps to explain why this molecule has thus far only been detected in one interstellar source (Rivilla et al. 2020). However, it is important to emphasise that the efficient radiolytic destruction of hydroxylamine in interstellar ices likely contributes to a rich, solid-phase chemistry leading to the formation of complex organic molecules relevant to biology, as discussed below.
4.3 Radiolytic chemistry
Our final objective was to elucidate the radiolytic chemistry of hydroxylamine in astrophysical ice analogues. The postulated importance of hydroxylamine in the synthesis of prebiotic molecules provided strong motivation to study its radiation chemistry not only as a single-component ice, but also in more realistic interstellar ice analogues containing H2O and CO. Our experiments have demonstrated the unambiguous detection of a number of simple product molecules, including H2O, NH3, H2O2, and HNO (Fig. 2, Table 6) in all considered ices. The formation of these molecules can be rationalised through the following reactions following the dissociation of hydroxylamine and the recombination of the resultant radical species:
 (13)
(13)
 (14)
(14)
 (15)
(15)
 (16)
(16)
 (17)
(17)
 (18)
(18)
Of course, other reaction routes may also potentially contribute to the synthesis of these simple product molecules. It is interesting to note, however, that the radiolysis of hydroxylamine is analogous to that of isoelectronic molecules such as CH3OH or H2O2 (Hudson & Moore 2001; Loeffler et al. 2006; Bennett et al. 2007). As an example, the hydroxylamine reactions described by Eqs. (14)-(16) are analogous to the formation of H2CO and CH4 during the radiolysis of CH3OH.
Our experiments also demonstrate that the 15 keV proton irradiation of hydroxylamine-containing ices results in the production of complex organic molecules. Although it is likely that a myriad of chemical reactions could conceivably contribute to the formation of such products, it is reasonable to assume that the initial reaction must involve CO, since this is the only carbon- bearing molecule initially included in our ice mixtures. As such, CO may react with excited or suprathermal radical species; particularly those that are produced in abundance as a result of the radiolytic dissociation of the parent hydroxylamine molecule and are also more likely to be mobile within the ice matrix, such as OH, NH2, and hydrogen atoms. Therefore, the most likely products to form as a result of the reaction between CO and these radicals are:
 (19)
(19)
 (20)
(20)
 (21)
(21)
Each of these products (i.e. HOCO, NH2CO, and HCO) represents an important starting point for a new network of reactions which results in the formation of new complex organic molecules, some of which may be prebiotic in nature. Each of these possible networks is discussed in further detail in the subsections below.
4.3.1 HOCO-initiated chemistry
Following the synthesis of HOCO within the irradiated ice mixture, it is possible that this species itself may undergo reactions with the more mobile abundant radicals within the ice (i.e. OH, NH2, and hydrogen atoms). These reactions, respectively, lead to the synthesis of carbonic acid, carbamic acid, and formic acid:
 (22)
(22)
 (23)
(23)
 (24)
(24)
Concerning these three acid species, we were only able to definitively detect formic acid among the radiolytic products of our experiment (Fig. 5 and Table 7). Interestingly, our study also demonstrates that formic acid may be retained in the solid phase at temperatures over 200 K (i.e. above its anticipated sublimation temperature; Molpeceres et al. 2022) in the form of the ammonium formate salt. It should be noted, however, that Molpeceres et al. (2022) calculated binding energies for isolated formic acid molecules on amorphous solid water ice as proxies for sublimation temperatures, which is not quite representative of our present experiments. Nevertheless, the observation of ammonium formate at higher temperatures is of particular importance, as recent studies have suggested that ammonium salts could account for an important reservoir of nitrogen in icy Solar System environments (Poch et al. 2020); therefore, they could conceivably be associated with deprotonated organic acids under conditions relevant to astrochemistry.
Conversely, the detection of the carbonic and carbamic acids remains more elusive due to the complexity of the IR spectra acquired during and after the irradiation process. However, we are able to speculate on the likelihood of their formation. Starting with carbonic acid, which was recently detected in the interstellar medium (Sanz-Novo et al. 2023), we suggest that its presence within our irradiated ices is unlikely due to mismatches between the observed IR absorption bands in our spectra and those reported in the literature for carbonic acid (Ioppolo et al. 2021). However, we note that the absence of carbonic acid in our experiments cannot be unequivocally linked to its nonformation; this is due to the known ease with which this molecule undergoes dissociation upon exposure to ionising radiation (Ioppolo et al. 2021). As such, it is possible that carbonic acid did form in our experiments but was quickly dissociated to yield other molecules such as H2O and CO2. In the case of carbamic acid, although there is a somewhat better agreement between the IR absorption features in our spectra and those reported in the literature for this molecule (James et al. 2020, 2021; Marks et al. 2023b), it is difficult to definitively confirm its presence due to the possibility that other organic species that could conceivably form in the irradiated ice may contribute to at least some of the observed IR bands.
4.3.2 NH2CO-initiated chemistry
The reaction of NH2CO with OH radicals, NH2 radicals, and hydrogen atoms could result in the direct synthesis of carbamic acid, urea, and formamide, respectively:
 (25)
(25)
 (26)
(26)
 (27)
(27)
As described previously, the presence of carbamic acid in our irradiated ice cannot be definitively confirmed. However, based on the reasonably good agreement between band peak positions in our IR absorption spectra and those in the literature (Sivaraman et al. 2013), formamide is more than likely present within our irradiated ice (Table 7). Moreover, several features in the 1800–1600 cm–1 region of the spectrum also show good agreement with the expected absorption bands of urea (Timón et al. 2021), tentatively suggesting the presence of this molecule as well. However, other bands in our IR spectra that have been suggested to be associated with urea (such as that at about 1500 cm–1 ) appear to be shifted to slightly higher wavenumbers compared to their literature positions, and, as such, the detection of urea should be considered tentative.
4.3.3 HCO-initiated chemistry
The reaction of HCO with OH radicals, NH2 radicals, and hydrogen atoms could lead to the formation of formic acid, formamide, and formaldehyde, respectively:
 (28)
(28)
 (29)
(29)
 (30)
(30)
The chemistry leading to the formation of formic acid and formamide has already been discussed. In addition, we note the unambiguous detection of formaldehyde in our experiments (Fig. 5 and Table 6). Therefore, all products of the reactions of HCO with radicals formed as a result of the radiolytic dissociation of the hydroxylamine parent species were detected in the irradiated ternary ice mixture.
4.3.4 Other reactions
Our IR absorption spectra also provide evidence of other types of reactions taking place within the irradiated ice mixture. Among these is the reaction between ground-state CO and excited CO, which contributes to the formation of CO2 (Jamieson et al. 2006; Ivlev et al. 2023). It should be noted that non-energetic reactions, such as those involving HOCO intermediates, could also contribute in a non-negligible manner to the presence of CO2 in the irradiated ice mixture (Ioppolo et al. 2011; Qasim et al. 2019; Molpeceres et al. 2023a), although the exact mechanism of the reaction is still under debate and will be the subject of a forthcoming work. Other routes towards the formation of CO2 are also possible, including those making use of radiolytic products within the ice. For instance, the reaction between CO and 3O may be possible due to the injection of energy by the impinging projectile ions, which may be used to overcome the energy barrier associated with this spin-forbidden reaction (Minissale et al. 2013).
Acid-base chemistry also takes place in the ice, as evidenced by the formation of OCN− (Hudson et al. 2001; Van Broekhuizen et al. 2004). In this scenario, a precursor molecule (likely isocyanic acid, HNCO) donates a proton to either water or ammonia to yield a salt product:
 (31)
(31)
 (32)
(32)
Indeed, IR spectral signatures of ammonium cyanate were observed in spectra acquired during the TPD experiment at temperatures below 220 K (Fig. 6).
One product that was not observed in our irradiation experiments was hydrazine (NH2NH2), despite the fact that the synthesis of this molecule as a result of the combination of two NH2 radicals seems relatively straightforward. The reason for this is not fully understood; however, we speculate that it may be related to the relatively low abundance of ammonia in our ices (as evidenced by the weak spectral features of that molecule; Table 6). To the best of our knowledge, the synthesis of hydrazine as a result of the irradiation of astrophysical ice analogues has only been reported in ices that were initially rich in ammonia (Zheng et al. 2008; Henderson & Gudipati 2015; Shulenberger et al. 2019). Therefore, given that ammonia was never a dominant species in the ices considered in this study, it is entirely possible that the radiolytic formation of hydrazine either occurred to an extent below the limits of spectroscopic detection or, alternatively, was precluded entirely.
At this point, we must emphasise that our analysis of the radiolytic chemistry occurring within the investigated ices likely only represents a small portion of the chemical processes taking place. Indeed, our analysis primarily focuses on radical-radical combination reactions and the role of excited neutral molecules. However, it is likely that ion-based chemistry plays an equally significant role in explaining the observed chemical complexity. For example, the observed formation of salts is challenging to fully rationalise without invoking chemical processes that involve ions. Despite its importance, ion-based chemistry is less straightforward to describe, and many specific reaction mechanisms are poorly understood. As such, conclusions formed regarding reactions involving ionic species would likely be speculative at best, and we therefore consider these reactions to be beyond the scope of the present work. Nonetheless, we emphasise the importance of these species in the chemistry occurring in our irradiated ices and plan to explore this subject more fully in a future work.
4.3.5 Proposed radiolytic synthesis of glycine
Finally, and in light of the chemical connection between hydroxylamine and glycine (Snow et al. 2007), we also searched for the latter species among the products of the irradiated NH2OH:H2O:CO ternary ice mixture. However, such a detection is challenging if based solely on IR absorption spectroscopy, and we are only able to tentatively claim a detection in our experiments. This is primarily due to the generally weak absorption features that were tentatively attributed to glycine in our spectra, compounded by the complexity of the possible co-existence of neutral and zwitterionic glycine depending on the polarity of the local matrix environment. However, it is to be noted that the large degree of similarity between the IR absorption spectrum of zwitterionic glycine and that of the final residue after our TPD experiment (Fig. 7), combined with the disappearance of these absorption features at the expected desorption temperature of glycine, constitutes an optimistic outlook for the presence of glycine as a radiolytic product in our study.
5 Summary and conclusions
In this study, we considered the IR absorption spectra of neat and mixed hydroxylamine astrophysical ice analogues prepared through vapour condensation onto a cooled substrate. Furthermore, we studied the radio-resistance of hydroxylamine in these ices when irradiated using 15 keV protons, as well as the ensuing chemistry. Our main findings can be summarised as follows:
The vapour deposition of hydroxylamine onto a cooled substrate at 10-20 K results in an amorphous ice that crystallises upon heating to temperatures greater than 150 K in a phase change process that is largely complete by 170 K. Hydroxylamine ice undergoes sublimation from the substrate upon further heating to 180 K;
IR absorption band strengths of amorphous hydroxylamine were estimated from the amount of water formed after its complete radiolytic destruction (see Appendix A for more information);
Our spectroscopic characterisations have determined that the NH2 wagging mode of hydroxylamine at about 1188 cm−1 is the most appropriate band by which this species could be detected in icy environments in space and that is has an estimated band strength constant of Av = 9 × 10–18 cm molecule–1. We strongly emphasise that this value is merely an estimate and that dedicated experiments are required to accurately measure the band strength constants of this molecule;
Effective destruction cross-sections of hydroxylamine irradiated by 15 keV protons at 20 K have been determined for the neat ice, the binary mixture with H2O, and the ternary mixture with H2O and CO. Hydroxylamine half-life doses were computed and are about one order of magnitude lower than those of other commonly studied complex organic molecules such as glycine and urea, indicating the low radioresistance of solid hydroxylamine in space environments. This may make its future detection in icy interstellar grains challenging;
The radiolytic chemistry of hydroxylamine in a ternary ice mixture also containing H2O and CO is rich and produces a number of organic species including formaldehyde, formic acid, and urea. Ammonium salts (i.e. ammonium formate and ammonium cyante) were also formed. Other species of varying complexity, such as carbamic acid, formamide, and glycine have been tentatively detected as radiolytic products; although more work is required to confirm a definitive detection for these species;
Potential reaction routes and networks have been suggested to rationalise the diversity of the products detected in our experiments.
Acknowledgements
The authors gratefully acknowledge support from the Europlanet RI through the Transnational Access Project Grant no. 22-EPN3-074. The Europlanet RI has received funding from the European Union’s Horizon 2020 Research Innovation Program under grant agreement no. 871149. This study is also based on work from the COST Action CA20129 MultIChem, supported by COST (European Cooperation in Science and Technology). Belén Maté, Ramón J. Peláez, and Juan Ortigoso acknowledge support provided by grant no. PID2020-113084GB-I00 funded by MICIU/AEI/10.13039/501100011033. Germán Molpeceres acknowledges the support provided by the grant no. RYC2022-035442-I funded by MICIU/AEI/10.13039/501100011033 and ESF+. Germán Molpeceres also acknowledges support received from the project 20245AT016 (Proyectos Intramurales CSIC). Víctor M. Rivilla acknowledges the Spanish State Research Agency (AEI) through project no. PID2022-136814NB- 100 from the Spanish Ministy of Science, Innovation, and Univeristies / State Agency of Research MICIU/AEI/10.13039/501100011033 and by “ERDF: A Way of Making Europe”. Víctor M. Rivilla also acknowledges support from the grant no. RYC2020-029387-1 funded by MICIU/AEI/10.13039/501100011033 and by “ESF: Investing in Your Future”, as well as from the Consejo Superior de Investigaciones Científicas (CSIC) and the Centro de Astrobiología (CAB) through the project no. 20225AT015 (Proyectos Intramurales Especiales del CSIC). Víctor M. Rivilla is grateful for support from the grant CNS2023-144464 funded by MICIU/AEI/10.13039/501100011033 and by “European Union NextGenera- tionEU/PRTR”. Sergio Ioppolo thanks the Danish National Research Foundation for support through the Center of Excellence ‘InterCat’ (grant agreement no. DNRF150). Zoltán Juhász is grateful for support from the Hungarian Academy of Sciences through the János Bolyai Research Scholarship.
Appendix A Hydroxylamine IR band strength estimation
Our experiment on the irradiation of neat hydroxylamine ice at 20 K led to practically the complete destruction of this molecule, as can be seen in Fig. 3. As discussed previously, hydroxylamine is anticipated to primarily decompose as per the reaction:
 (A.1)
(A.1)
Indeed, the formation of water is evident in the top panel of Fig. 4, which illustrates an IR absorption spectrum of amorphous water scaled to match the amount of water formed radiolytically. Therefore, by measuring the column density of water from this scaled spectrum, it is possible to make use of the stoichiometric relationship given in Eq. (A.1) to calculate the molecular column density of hydroxylamine molecules which must dissociate to yield the measured abundance of water (this was done using the band strength constant of water indicated in Table 1). Due to the very extensive radiolytic destruction of hydroxylamine in this experiment, this calculated column density of hydroxylamine is assumed to be equal to the initial abundance present.
Having estimated the initial column density of hydroxylamine present in the neat ice prior to irradiation, N0, and knowing the initial integrated absorption of the IR band at 1188 cm–1, I0, it is possible to rearrange Eq. 1 to calculate the band strength constant:
 (A.2)
(A.2)
In principle, it is also possible to use this methodology to calculate the initial column density of hydroxylamine by making use of the umbrella vibrational mode of ammonia at about 1125 cm–1. However, the strength constant of this band is about one order of magnitude weaker than that of the OH stretching modes of water and thus the uncertainties associated with measuring the integrated absorption of the ammonia band are larger. Moreover, previous works have indicated that the band strength constant associated with the umbrella vibrational mode of ammonia varies significantly depending on the chemical nature of the ice (Kerkhof et al. 1999). As such, the use of the IR absorption features of ammonia to estimate the initial column density of hydroxylamine was not pursued.
Of course, this estimation method is associated with a number of sources of error, such as the uncertainty in the estimation of H2O formation due to the IR absorption bands of this molecule overlapping with those of NH3 and HNO (see top panel of Fig. 4). Another source of error is the assumption that the dissociation mechanism shown in Eq. A.1 is the only reaction by which hydroxylamine is destroyed during irradiation. In reality, it is possible that other reaction mechanisms that do not hold the same stoichiometry as Eq. A.1 may contribute to the decay of hydroxylamine, as may ion impact-induced sputtering. However, in the absence of dedicated studies aimed at quantifying the IR absorption band strength constants of hydroxylamine, the present method of estimation should be considered an acceptable substitute.
References
- Becker, S., Feldmann, J., Wiedemann, S., et al. 2019, Science, 366, 76 [NASA ADS] [CrossRef] [Google Scholar]
- Belloche, A., Garrod, R., Müller, H., et al. 2019, A&A, 628, A10 [NASA ADS] [CrossRef] [EDP Sciences] [Google Scholar]
- Bennett, C. J., Chen, S.-H., Sun, B.-J., Chang, A. H., & Kaiser, R. I. 2007, ApJ, 660, 1588 [NASA ADS] [CrossRef] [Google Scholar]
- Bergantini, A., Pilling, S., Rothard, H., Boduch, P., & Andrade, D. 2014, MNRAS, 437, 2720 [CrossRef] [Google Scholar]
- Biri, S., Vámosi, J., Valek, A., et al. 1997, Nucl. Instrum. Methods Phys. Res. B, 124, 427 [CrossRef] [Google Scholar]
- Biri, S., Vajda, I., Hajdu, P., et al. 2021, Eur. Phys. J. Plus, 136, 247 [CrossRef] [Google Scholar]
- Bossa, J.-B., Theulé, P., Duvernay, F., Borget, F., & Chiavassa, T. 2008, A&A, 492, 719 [NASA ADS] [CrossRef] [EDP Sciences] [Google Scholar]
- Brucato, J. R., Palumbo, M. E., & Strazzulla, G. 1997, Icarus, 125, 135 [NASA ADS] [CrossRef] [Google Scholar]
- Brucato, J. R., Baratta, G. A., & Strazzulla, G. 2006, A&A, 455, 395 [NASA ADS] [CrossRef] [EDP Sciences] [Google Scholar]
- Charnley, S., Rodgers, S., & Ehrenfreund, P. 2001, A&A, 378, 1024 [NASA ADS] [CrossRef] [EDP Sciences] [Google Scholar]
- Congiu, E., Fedoseev, G., Ioppolo, S., et al. 2012, ApJ, 750, L12 [NASA ADS] [CrossRef] [Google Scholar]
- Dohnalek, Z., Kimmel, G. A., Ayotte, P., Smith, R. S., & Kay, B. D. 2003, J. Chem. Phys., 118, 364 [CrossRef] [Google Scholar]
- Esmaili, S., Bass, A. D., Cloutier, P., Sanche, L., & Huels, M. A. 2018, J. Chem. Phys., 148, 164702 [NASA ADS] [CrossRef] [Google Scholar]
- Fedoseev, G., Chuang, K.-J., van Dishoeck, E. F., Ioppolo, S., & Linnartz, H. 2016, MNRAS, 460, 4297 [NASA ADS] [CrossRef] [Google Scholar]
- Feller, D., & Dixon, D. A. 2003, J. Phys. Chem. A, 107, 10419 [NASA ADS] [CrossRef] [Google Scholar]
- Gálvez, O., Maté, B., Herrero, V. J., & Escribano, R. 2010, ApJ, 724, 539 [NASA ADS] [CrossRef] [Google Scholar]
- Garrod, R. T., Jin, M., Matis, K. A., et al. 2022, ApJS, 259, 1 [NASA ADS] [CrossRef] [Google Scholar]
- Gerakines, P., Schutte, W., & Ehrenfreund, P. 1996, A&A, 312, 289 [Google Scholar]
- González Díaz, C., Carrascosa, H., Muñoz Caro, G. M., Satorre, M. Á., & Chen, Y. 2022, MNRAS, 517, 5744 [CrossRef] [Google Scholar]
- Hagen, W., Tielens, A., & Greenberg, J. 1981, Chem. Phys., 56, 367 [NASA ADS] [CrossRef] [Google Scholar]
- He, J., Vidali, G., Lemaire, J.-L., & Garrod, R. T. 2015, ApJ, 799, 49 [NASA ADS] [CrossRef] [Google Scholar]
- Henderson, B. L., & Gudipati, M. S. 2015, ApJ, 800, 66 [NASA ADS] [CrossRef] [Google Scholar]
- Herczku, P., Mifsud, D. V., Ioppolo, S., et al. 2021, Rev. Sci. Instrum., 92, 084501 [NASA ADS] [CrossRef] [Google Scholar]
- Herrero, V. J., Tanarro, I., Jiménez-Serra, I., et al. 2022, MNRAS, 517, 1058 [NASA ADS] [CrossRef] [Google Scholar]
- Hudson, R., & Moore, M. 1999, Icarus, 140, 451 [NASA ADS] [CrossRef] [Google Scholar]
- Hudson, R., & Moore, M. 2001, J. Geophys. Res. Planet., 106, 33275 [NASA ADS] [CrossRef] [Google Scholar]
- Hudson, R. L., & Yarnall, Y. Y. 2022, ACS Earth Space Chem., 6, 1163 [NASA ADS] [CrossRef] [Google Scholar]
- Hudson, R., Moore, M., & Gerakines, P. 2001, ApJ, 550, 1140 [NASA ADS] [CrossRef] [Google Scholar]
- Hudson, R. L., Moore, M. H., Dworkin, J. P., Martin, M. P., & Pozun, Z. D. 2008, Astrobiology, 8, 771 [Google Scholar]
- Hudson, R., Ferrante, R., & Moore, M. 2014, Icarus, 228, 276 [Google Scholar]
- Hudson, R., Loeffler, M., & Gerakines, P. 2017, J. Chem. Phys, 146, 024304 [NASA ADS] [CrossRef] [Google Scholar]
- Hudson, R. L., Yarnall, Y. Y., & Coleman, F. M. 2020, Spectrochim. Acta A, 233, 118217 [NASA ADS] [CrossRef] [Google Scholar]
- Hudson, R. L., Gerakines, P. A., & Yarnall, Y. Y. 2022, ApJ, 925, 156 [NASA ADS] [CrossRef] [Google Scholar]
- Ioppolo, S., Van Boheemen, Y., Cuppen, H., Van Dishoeck, E., & Linnartz, H. 2011, MNRAS, 413, 2281 [NASA ADS] [CrossRef] [Google Scholar]
- Ioppolo, S., Kaňuchová, Z., James, R. L., et al. 2021, A&A, 646, A172 [NASA ADS] [CrossRef] [EDP Sciences] [Google Scholar]
- Ivlev, A. V., Giuliano, B. M., Juhász, Z., et al. 2023, ApJ, 944, 181 [NASA ADS] [CrossRef] [Google Scholar]
- Jacox, M. E., & Milligan, D. E. 1973, J. Mol. Spectrosc., 48, 536 [NASA ADS] [CrossRef] [Google Scholar]
- James, R. L., Ioppolo, S., Hoffmann, S. V., et al. 2020, RSC Adv., 10, 37515 [NASA ADS] [CrossRef] [Google Scholar]
- James, R. L., Ioppolo, S., Hoffmann, S. V., et al. 2021, RSC Adv., 11, 33055 [NASA ADS] [CrossRef] [Google Scholar]
- Jamieson, C. S., Mebel, A. M., & Kaiser, R. I. 2006, ApJSS, 163, 184 [NASA ADS] [CrossRef] [Google Scholar]
- Jonusas, M., & Krim, L. 2016, MNRAS, 459, 1977 [NASA ADS] [CrossRef] [Google Scholar]
- Kerkhof, O., Schutte, W., & Ehrenfreund, P. 1999, A&A, 346, 990 [NASA ADS] [Google Scholar]
- Kleimeier, N. F., Abplanalp, M. J., Johnson, R. N., et al. 2021, ApJ, 911, 24 [NASA ADS] [CrossRef] [Google Scholar]
- Ligterink, N., Walsh, C., Bhuin, R., et al. 2018, A&A, 612, A88 [NASA ADS] [CrossRef] [EDP Sciences] [Google Scholar]
- Loeffler, M., Raut, U., Vidal, R. A., Baragiola, R., & Carlson, R. 2006, Icarus, 180, 265 [Google Scholar]
- Luckhaus, D. 1997, J. Chem. Phys., 106, 8409 [NASA ADS] [CrossRef] [Google Scholar]
- Luna, R., Millán, C., Domingo, M., Santonja, C., & Satorre, M. Á. 2022, ApJ, 935, 134 [NASA ADS] [CrossRef] [Google Scholar]
- Marks, J. H., Wang, J., Evseev, M. M., et al. 2023a, ApJ, 942, 43 [NASA ADS] [CrossRef] [Google Scholar]
- Marks, J. H., Wang, J., Sun, B.-J., et al. 2023b, ACS Cent. Sci., 9, 2241 [CrossRef] [Google Scholar]
- Maté, B., Rodriguez-Lazcano, Y., Galvez, O., Tanarro, I., & Escribano, R. 2011, Phys. Chem. Chem. Phys., 13, 12268 [CrossRef] [Google Scholar]
- Maté, B., Herrero, V. J., Rodriguez-Lazcano, Y., et al. 2012, ApJ, 759, 90 [CrossRef] [Google Scholar]
- Maté, B., Molpeceres, G., Jiménez-Redondo, M., Tanarro, I., & Herrero, V. J. 2016, ApJ, 831, 51 [CrossRef] [Google Scholar]
- Maté, B., Molpeceres, G., Tanarro, I., et al. 2018, ApJ, 861, 61 [Google Scholar]
- Maté, B., Carrasco-Herrera, R., Timón, V., et al. 2021, ApJ, 909, 123 [CrossRef] [Google Scholar]
- Maté, B., Tanarro, I., Peláez, R. J., Cernicharo, J., & Herrero, V. J. 2024, A&A, 682, A158 [NASA ADS] [CrossRef] [EDP Sciences] [Google Scholar]
- McGuire, B. A. 2022, ApJSS, 259, 30 [NASA ADS] [CrossRef] [Google Scholar]
- McGuire, B. A., Carroll, P. B., Dollhopf, N. M., et al. 2015, ApJ, 812, 76 [NASA ADS] [CrossRef] [Google Scholar]
- Meyers, E., & Lipscomb, W. 1955, Acta Crystallogr., 8, 583 [NASA ADS] [CrossRef] [Google Scholar]
- Mifsud, D. V., Herczku, P., Rahul, K., et al. 2023, Phys. Chem. Chem. Phys., 25, 26278 [NASA ADS] [CrossRef] [Google Scholar]
- Mifsud, D. V., Herczku, P., Ramachandran, R., et al. 2024, Spectrochim. Acta A, 124567 [NASA ADS] [CrossRef] [Google Scholar]
- Minissale, M., Congiu, E., Manicò, G., Pirronello, V., & Dulieu, F. 2013, A&A, 559, A49 [NASA ADS] [CrossRef] [EDP Sciences] [Google Scholar]
- Molpeceres, G., Timón, V., Jiménez-Redondo, M., et al. 2017, Phys. Chem. Chem. Phys., 19, 1352 [NASA ADS] [CrossRef] [Google Scholar]
- Molpeceres, G., Jiménez-Serra, I., Oba, Y., et al. 2022, A&A, 663, A41 [NASA ADS] [CrossRef] [EDP Sciences] [Google Scholar]
- Molpeceres, G., Enrique-Romero, J., & Aikawa, Y. 2023a, A&A, 677, A39 [NASA ADS] [CrossRef] [EDP Sciences] [Google Scholar]
- Molpeceres, G., Rivilla, V. M., Furuya, K., et al. 2023b, MNRAS, 521, 6061 [NASA ADS] [CrossRef] [Google Scholar]
- Moore, M., & Khanna, R. 1991, Spectrochim. Acta A, 47, 255 [CrossRef] [Google Scholar]
- Nguyen, T., Talbi, D., Congiu, E., et al. 2019, ACS Earth Space Chem., 3, 1196 [NASA ADS] [CrossRef] [Google Scholar]
- Nightingale, R., & Wagner, E. 1954, J. Chem. Phys., 22, 203 [NASA ADS] [CrossRef] [Google Scholar]
- Poch, O., Istiqomah, I., Quirico, E., et al. 2020, Science, 367, eaaw7462 [Google Scholar]
- Qasim, D., Lamberts, T., He, J., et al. 2019, A&A, 626, A118 [NASA ADS] [CrossRef] [EDP Sciences] [Google Scholar]
- Rácz, R., Biri, S., Juhász, Z., Sulik, B., & Pálinkás, J. 2012, Rev. Sci. Instrum., 83, 02A313 [CrossRef] [Google Scholar]
- Rácz, R., Kovács, S., Lakatos, G., et al. 2024, Rev. Sci. Instrum., 95, 095105 [CrossRef] [Google Scholar]
- Rivilla, V. M., Martín-Pintado, J., Jiménez-Serra, I., et al. 2020, ApJ, 899, L28 [Google Scholar]
- Rivilla, V. M., Jiménez-Serra, I., Martín-Pintado, J., et al. 2021, PNAS, 118, e2101314118 [NASA ADS] [CrossRef] [Google Scholar]
- Rivilla, V. M., Colzi, L., Jiménez-Serra, I., et al. 2022, ApJ, 929, L11 [NASA ADS] [CrossRef] [Google Scholar]
- Sakurai, M., & Yanagawa, H. 1984, Orig. Life, 14, 171 [CrossRef] [Google Scholar]
- Sałdyka, M., & Mielke, Z. 2003, Phys. Chem. Chem. Phys., 5, 4790 [CrossRef] [Google Scholar]
- Sanz-Novo, M., Rivilla, V. M., Jiménez-Serra, I., et al. 2023, ApJ, 954, 3 [NASA ADS] [CrossRef] [Google Scholar]
- Shingledecker, C. N., & Herbst, E. 2018, Phys. Chem. Chem. Phys., 20, 5359 [Google Scholar]
- Shulenberger, K. E., Zhu, J. L., Tran, K., et al. 2019, ACS Earth Space Chem., 3, 800 [NASA ADS] [CrossRef] [Google Scholar]
- Sivaraman, B., Sekhar, B. R., Nair, B., Hatode, V., & Mason, N. 2013, Spectrochim. Acta A, 105, 238 [NASA ADS] [CrossRef] [Google Scholar]
- Snow, J. L., Orlova, G., Blagojevic, V., & Bohme, D. K. 2007, J. Am. Chem. Soc., 129, 9910 [NASA ADS] [CrossRef] [Google Scholar]
- Timón, V., Maté, B., Herrero, V. J., & Tanarro, I. 2021, Phys. Chem. Chem. Phys., 23, 22344 [CrossRef] [Google Scholar]
- Tsegaw, Y. A., Góbi, S., Förstel, M., et al. 2017, J. Phys. Chem. A, 121, 7477 [NASA ADS] [CrossRef] [Google Scholar]
- Turner, A. M., Bergantini, A., Koutsogiannis, A. S., et al. 2021, ApJ, 916, 74 [NASA ADS] [CrossRef] [Google Scholar]
- Van Broekhuizen, F., Keane, J., & Schutte, W. 2004, A&A, 415, 425 [NASA ADS] [CrossRef] [EDP Sciences] [Google Scholar]
- Wang, Q., Wei, C., Perez, L. M., et al. 2010, J. Phys. Chem. A, 114, 9262 [NASA ADS] [CrossRef] [Google Scholar]
- Wang, J., Nikolayev, A. A., Marks, J. H., et al. 2024, J. Am. Chem. Soc., 146, 28437 [NASA ADS] [Google Scholar]
- Xu, F., Crisp, A., Schinkel, T., et al. 2022, Angew. Chem. Int. Ed., 61, e202211945 [CrossRef] [Google Scholar]
- Zanchet, A., Rodríguez-Lazcano, Y., Gálvez, Ó., et al. 2013, ApJ, 777, 26 [CrossRef] [Google Scholar]
- Zhang, C., Wang, J., Turner, A. M., et al. 2023, ApJ, 952, 132 [NASA ADS] [CrossRef] [Google Scholar]
- Zheng, W., Jewitt, D., Osamura, Y., & Kaiser, R. I. 2008, ApJ, 674, 1242 [NASA ADS] [CrossRef] [Google Scholar]
- Zhu, C., Turner, A. M., Meinert, C., & Kaiser, R. I. 2020, ApJ, 889, 134 [NASA ADS] [CrossRef] [Google Scholar]
- Ziegler, J. F., Ziegler, M. D., & Biersack, J. P. 2010, Nucl. Instrum. Methods Phys. Res. B, 268, 1818 [Google Scholar]
All Tables
Assignments for IR absorption bands in the spectra of amorphous (20 K) and crystalline (170 K) hydroxylamine ice.
Assignments for IR absorption bands in the spectra of hydroxylamine in mixtures with H2O (or D2O) and/or CO at 20 K.
Calculated radiolytic destruction parameters of hydroxylamine-containing ices irradiated by 15 keV protons.
Band assignments for products formed during irradiation of the NH2OH:H2O:CO ternary ice mixture using 15 keV protons.
Possible complex organic molecules present in irradiated the NH2OH:H2O:CO ternary ice.
All Figures
|
Fig. 1 IR absorption spectra of amorphous hydroxylamine ices prepared by vapour deposition at 10 K (setup at IEM-CSIC; black trace) and 20 K (AQUILA setup at HUN-REN Atomki; red trace), and of crystalline hydroxylamine ice prepared by deposition at 10 K and warming to 170 K (blue trace). We note that amorphous and crystalline spectra are vertically offset for clarity. |
| In the text | |
|
Fig. 2 IR absorption spectra of ice mixtures containing hydroxylamine grown by vapour deposition at 20 K using the AQUILA setup. Left panels: IR spectra acquired prior to irradiation, with the absorption band at 1188 cm−1 indicated by an asterisk. Right panels: evolution of IR absorption spectra during irradiation with 15 keV protons. In each panel, the initial IR spectrum is given by the red trace, and the final spectrum at the end of the irradiation experiment is given by the blue trace. |
| In the text | |
|
Fig. 3 Hydroxylamine IR band decay as a function of proton fluence. Left panels: normalised absorption band area decay for three distinct IR vibrational modes (black squares: NH2 wagging mode; red circles: OH stretching mode; blue triangles: NO stretching mode). We note that lines between the individual data points are not fits and are plotted solely to guide the eye. Right panels: natural logarithmic representation of data plotted in the left panels. We note that, in this case, the straight lines are linear trend lines fitted to data points at low proton fluences. |
| In the text | |
|
Fig. 4 IR spectra acquired to assess the major radiolytic products of the studied ices. Top panel: spectrum of neat hydroxylamine ice after irradiation with 15 keV protons (blue trace), together with spectra of amorphous water (red trace) and neat hydroxylamine ices (grey trace) scaled to match the amount of water formed and the hydroxylamine that survives at the end of the irradiation. Bottom panel: difference spectra (i.e. the initial pre-irradiation spectrum subtracted from that acquired at the end of the experiment) of the three ice mixtures containing hydroxylamine that were considered in this study. We note that two of the spectra in this panel have been vertically offset for clarity. |
| In the text | |
|
Fig. 5 Analysis of potential complex organic molecules (COMs) formed as a result of irradiating hydroxylamine-containing ices. Top panel: difference spectrum (i.e. the initial pre-irradiation spectrum subtracted from the final spectrum acquired after the end of the irradiation process) of the ternary NH2OH:H2O:CO ice (red solid trace). Also shown is the spectrum of neat hydroxylamine (grey dashed trace) to compare against the negative peaks associated with molecular destruction in the difference spectrum. Bottom panel: IR absorption spectra of candidate COM products assembled from the literature (Gerakines et al. 1996; Brucato et al. 2006; Maté et al. 2011; Bergantini et al. 2014; Timón et al. 2021). From top to bottom, these are spectra of formaldehyde, formic acid, formamide, urea, and neutral (dashed line) and zwitterionic (solid line) glycine. |
| In the text | |
|
Fig. 6 Evolution of IR absorption spectra of 15 keV proton-irradiated NH2OH:H2O:CO ice upon warming at a rate of 1 K min–1. |
| In the text | |
|
Fig. 7 Difference spectrum generated using IR absorption spectra acquired at temperatures of 260 and 280 K during the TPD experiment (red trace) shown alongside a spectrum of neat zwitterionic glycine (black trace). |
| In the text | |
Current usage metrics show cumulative count of Article Views (full-text article views including HTML views, PDF and ePub downloads, according to the available data) and Abstracts Views on Vision4Press platform.
Data correspond to usage on the plateform after 2015. The current usage metrics is available 48-96 hours after online publication and is updated daily on week days.
Initial download of the metrics may take a while.