Fig. 4
Download original image
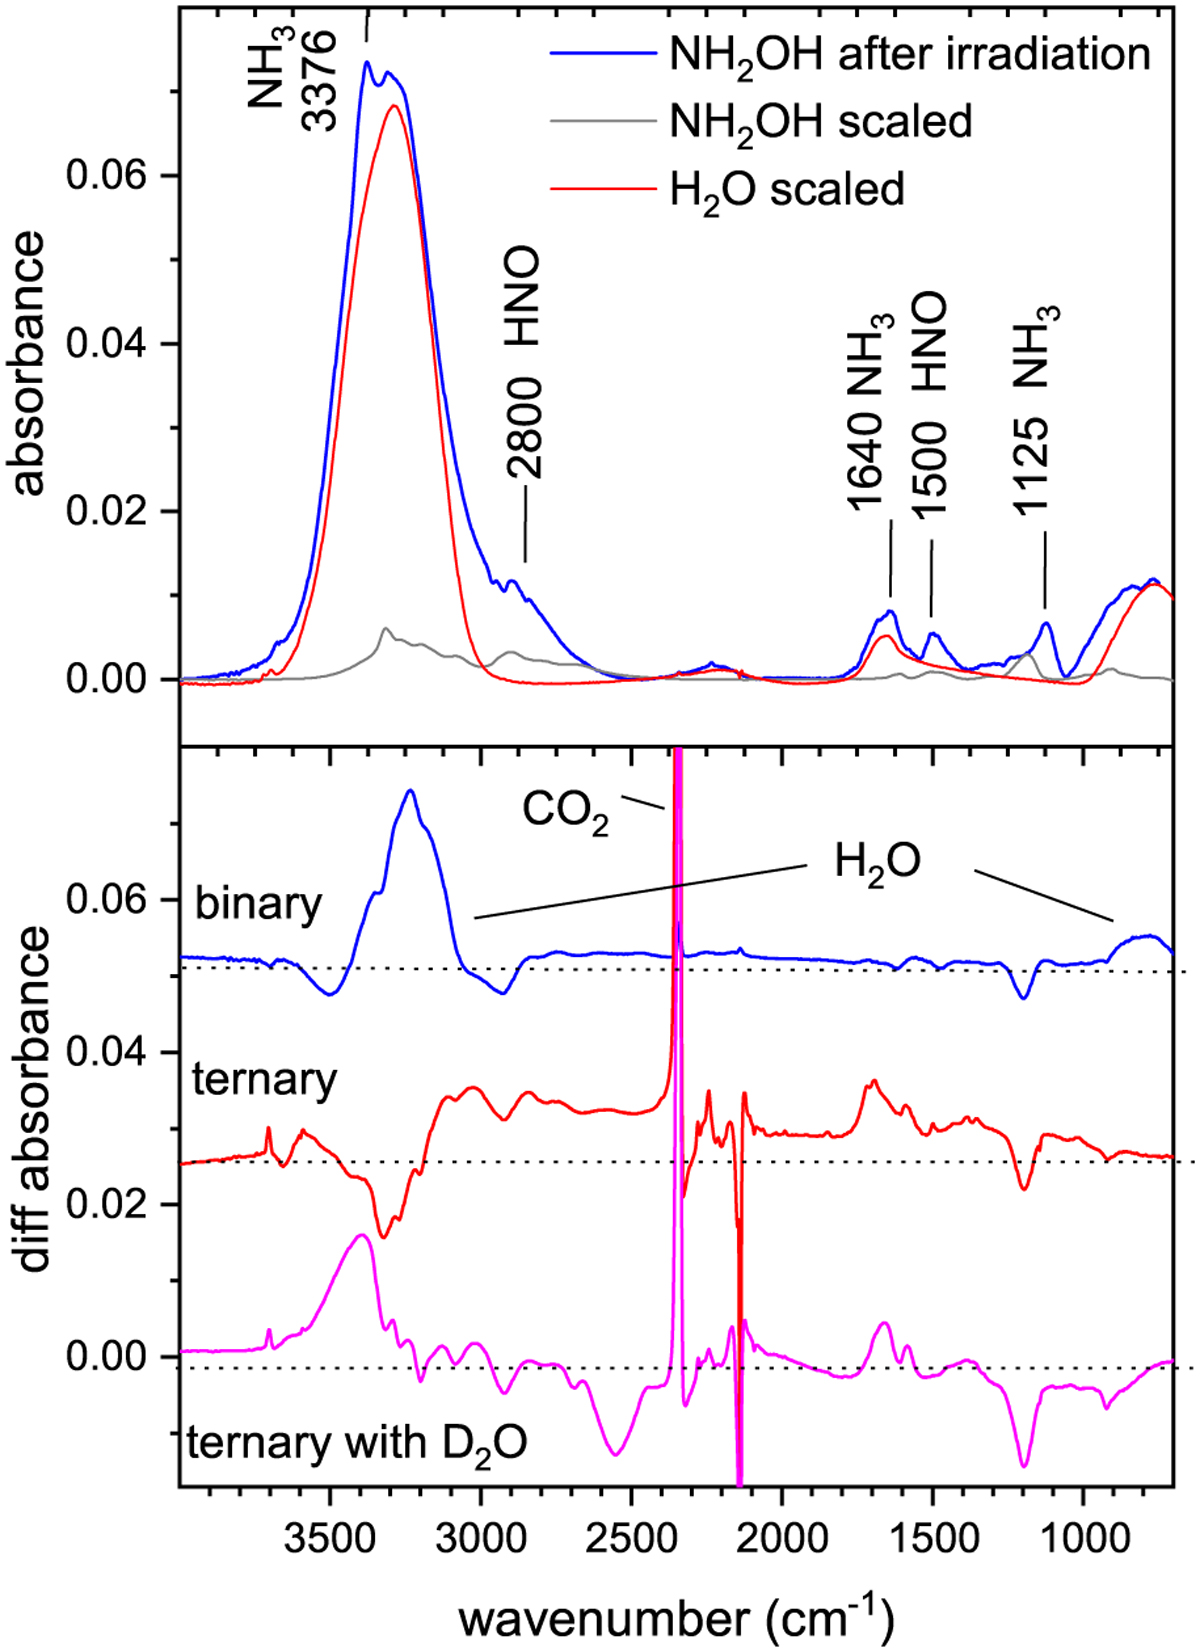
IR spectra acquired to assess the major radiolytic products of the studied ices. Top panel: spectrum of neat hydroxylamine ice after irradiation with 15 keV protons (blue trace), together with spectra of amorphous water (red trace) and neat hydroxylamine ices (grey trace) scaled to match the amount of water formed and the hydroxylamine that survives at the end of the irradiation. Bottom panel: difference spectra (i.e. the initial pre-irradiation spectrum subtracted from that acquired at the end of the experiment) of the three ice mixtures containing hydroxylamine that were considered in this study. We note that two of the spectra in this panel have been vertically offset for clarity.
Current usage metrics show cumulative count of Article Views (full-text article views including HTML views, PDF and ePub downloads, according to the available data) and Abstracts Views on Vision4Press platform.
Data correspond to usage on the plateform after 2015. The current usage metrics is available 48-96 hours after online publication and is updated daily on week days.
Initial download of the metrics may take a while.