| Issue |
A&A
Volume 682, February 2024
|
|
|---|---|---|
| Article Number | A158 | |
| Number of page(s) | 11 | |
| Section | Atomic, molecular, and nuclear data | |
| DOI | https://doi.org/10.1051/0004-6361/202347889 | |
| Published online | 16 February 2024 | |
Indene energetic processing in ice mantles in the interstellar medium
1
Instituto de Estructura de la Materia, IEM-CSIC,
Calle Serrano 121,
28006
Madrid,
Spain
e-mail: This email address is being protected from spambots. You need JavaScript enabled to view it.
2
Instituto de Física Fundamental, IFF-CSIC,
Calle Serrano 123,
28006
Madrid,
Spain
Received:
6
September
2023
Accepted:
6
December
2023
Abstract
Context. Indene, a small PAH, has been detected in the gas phase in the cold dense cloud TMC-1. Due to the low temperature in the cloud, below indene condensation temperature, its presence in the ice mantles of dust grains is likely.
Aims. The aim of this work is to study the stability of indene against the energetic processing by VUV photons or cosmic rays in the ice mantles of dense molecular clouds.
Methods. Ice layers of pure indene or indene diluted in water ice were grown by vapor deposition on a cold surface held at 10 K, 100 K, or 140 K. The samples were processed with VUV photons (120–180 nm) and 5 keV electrons and the destruction of indene was monitored by following the decay of its absorption bands in the infrared (IR) spectrum. Finally, we recorded the mass spectra of the decomposition products sublimated by thermal programmed desorption of the processed samples.
Results. Photolysis and radiolysis cross-sections, along with half-life energy doses for indene in the solid form and diluted in water ice matrices at 10 K were derived. Ketones and alcohols were identified as the main processing products in indene and water–ice mixtures
Conclusions. Dilution in water ice enhances the destruction rate of indene under energetic processing. The molecule is expected to survive for more than 107 yr in the ice mantles of grains in the interior of dense clouds, but it will end up getting destroyed within the next few hundred years by the intense VUV field in the diffuse region at the edges of the cloud.
Key words: astrochemistry / molecular data / molecular processes / methods: laboratory: molecular / ISM: molecules / infrared: ISM
© The Authors 2024
 Open Access article, published by EDP Sciences, under the terms of the Creative Commons Attribution License (https://creativecommons.org/licenses/by/4.0), which permits unrestricted use, distribution, and reproduction in any medium, provided the original work is properly cited.
This article is published in open access under the Subscribe to Open model. This email address is being protected from spambots. You need JavaScript enabled to view it. to support open access publication.
1 Introduction
Polycyclic aromatic hydrocarbons (PAH), as well as other closely related species, are widely assumed to be the carriers of ubiquitous interstellar (IS) emission features known as aromatic infrared bands (AIBs; Leger & Puget 1984; Allamandola et al. 1985; Tielens 2008). However, the detection of individual PAHs in the interstellar medium (ISM) has proven a major challenge. It is only recently that an individual PAH molecule, namely, indene, has been identified in the ISM. This bicyclic molecule, consisting of a six-membered and a five-membered ring, has been found almost simultaneously in the course of the QUI-JOTE (Cernicharo et al. 2021a) and GOTHAM (Burkhardt et al. 2021) surveys of the cold dense cloud TMC-1. An abundance of 1-1.6 × 10⁻⁹ relative to H2 was derived for indene in these observations. This means that indene is exceptionally abundant for its large size, only a factor of five less abundant than the ubiquitous cyclic hydrocarbon c-C3H2. Other small related species like benzyne (Cernicharo et al. 2021b) and cyclopenta-diene (Cernicharo et al. 2021a,c), as well as the cyano derivatives of benzene (C6H5CN), indene (C9H7CN), and naphthalene (C10H7CN) were also found in TMC-1 (McGuire et al. 2018, 2021).
The formation pathway of indene is still a mystery. Gas-phase routes that could be relevant for in situ formation in TMC-1 have been proposed. Doddipatla et al. (2021) suggested that indene can be formed in the gas phase through the barrier-less reaction between the CH radical and styrene (c-C6H5C2H3), but the presence of a sufficient quantity of the styrene precursor is dubious in cold and dense environments. McCabe et al. (2020) reported the formation of indene via the reaction of the resonance stabilized allyl radical with o-benzyne. The possible generation of aromatic species from simple precursors in the ice mantles of dust grains has also been proposed by Abplanalp et al. (2019) based on their experimental results on the processing of acetylene ices with high energy electrons. However, current chemical models of TMC-1 including gas-phase and gas-grain reactions yield too low concentrations of indene as compared with observations (Doddipatla et al. 2021; Burkhardt et al. 2021). Ex situ formation and transfer of PAHs to TMC-1 is also a possibility, but it is unlikely for indene and other small PAHs that will be destroyed by the strong UV galactic field during the evolution of the diffuse to the dense stages of the clouds. Gas-phase models lack a significant number of ion-neutral and radical-radical reactions that could participate in the formation and growth of cycles in cold environments (Cernicharo et al. 2022). Recently, it has been proven that the cyanide derivative of benzene coexists spatially with cyanopolyynes (HC2n+1N) and other hydrocarbons, which gives strong support to the formation of these aromatics in situ through gas phase or ice grain processes (Cernicharo et al. 2023). Ion-neutral reactions have been also proposed to explain the formation of cyclopentadi-ene from C2H4 and l-C3H3+, which leads to the formation of C5H7+ and of C5H6 through dissociative recombination of the cation (Cernicharo et al. 2022). It is generally assumed that polyaromatic compounds are mostly formed in the outflows of carbon-rich asymptotic giant branch (AGB) stars (Frenklach & Feigelson 1989; Cherchneff 2012) or, more likely, at later stages of stellar evolution like protoplanetary and planetary nebulae (Kwok 2004) through UV processing of the amorphous carbon nanograins and C/H clusters originally formed in the stellar envelopes (Martínez et al. 2020; Santoro et al. 2020), but only large PAHs, with more than ≈50 carbon atoms, are expected to withstand the intense UV fields in the transition from the ejecta of evolved star environments to the interstellar medium and later to prestellar cores (Tielens 2008).
At the low temperatures (≈10 K) estimated for TMC-1, indene – and complex organic molecules (COMs) overall – are expected to freeze readily on dust grains. Nonthermal desorp-tion mechanisms have been proposed and are being currently investigated to account for their presence in the gas phase. These mechanisms include electron promoted desorption (Marchione & McCoustra 2016), X ray induced desorption (Torres-Díaz et al. 2023; Kalvans 2021), desorption induced by exothermic reactions (Garrod et al. 2007; Vasyunin & Herbst 2013) and, notably, UV photodesorption (Öberg et al. 2009; Cruz-Diaz et al. 2017) and cosmic ray (CR) sputtering (Dartois et al. 2017, 2022; Pino et al. 2019). Overall, COMs are expected to be highly diluted in the ice mantles of dust grains and on many occasions their gas-phase concentrations should thus be given by the desorption rate of the dominant ice molecules. A recent model estimation by Dartois et al. (2022), assuming pure water ice as well as CR sputtering as the prevailing desorption mechanism, suggests that for the typical conditions of a dense cloud like TMC-1 the gas-to-solid fraction of a typical small aromatic hydrocarbon (they used naphtalene in their calculations) would be just ≈10−3–10−4. In the case of TMC-1, which is a comparatively young object of 0.5-1 Myr (Navarro-Almaida et al. 2021; Chen et al. 2022; Cernicharo et al. 2022), the depletion of hypothetical indene formed in the gas phase might not be so high, but it is still expected to be significant. The stability and chemistry of indene in ice mantles can thus be crucial to understand the global behavior of indene in TMC-1 and this is the subject of the present work. Moreover, the detection of ice-processed indene molecules released to the gas-phase could provide excellent insights into our understanding of the chemistry of small PAHs in these environments.
A large number of studies of PAH photo-processing on ices (usually with VUV photons generated by H2 lamps), mostly devoted to photochemistry, have been performed over the last two decades (Bernstein et al. 1999; Bouwman et al. 2011; Cuylle et al. 2014; Cook et al. 2015; Noble et al. 2017; de Barros et al. 2017; Radhakrishnan et al. 2018). In the work by Bernstein et al. (1999) it was observed that the photo processing of PAHs of sizes between those of naphthalene (C10H8) and coronene (C24H12) diluted in water ice leads to the formation of alcohols, quinones, and ethers. The non-volatile products were identified via microprobe laser desorption laser ionization mass spec-trometry. Other works have employed mid-IR (MIR) or UV-VIS absorption spectroscopy to analyse the products formed after the VUV-photolysis of PAHs in water ice (Bouwman et al. 2011; Cuylle et al. 2014; Cook et al. 2015; Noble et al. 2017, 2020; de Barros et al. 2017; Radhakrishnan et al. 2018). Compared with the available spectra of PAH cations in argon matrices, it has been observed that photochemical reaction products result from direct photoionization of the PAHs. More recently, experiments have been performed that compare the different products produced by photolysis or radiolysis of PAHs (Cruz-Diaz et al. 2017). However, no information has been given in the previously mentioned works about PAH destruction kinetics.
On the other hand, the radiolysis via keV electron or high-energy ions of PAHs on ices has not received so much attention. In the study by Barnett et al. (2012) ices containing pyrene were bombarded with electrons of energies below 2 keV and the damage of the PAH was used to estimate the penetration depths of the electrons. Again, however, no information about destruction kinetics or destruction products was given.
In the previous paper published by our group (Maté et al. 2023), we reported the IR spectroscopy of amorphous and crystalline indene in a study supported by DFT calculations. In this second part, we address the stability of solid phases of indene at low temperature. Pure indene and its mixtures with amorphous solid water (ASW) at 10 K have been processed with VUV photons and 5 keV electrons, to mimic the effect of the secondary interstellar UV field present in dense clouds, and of cosmic rays, respectively. Moreover, a 130 K pure polycrystalline indene layer has also been energetically processed to simulate its behaviour in warmer astrophysical environments. From the IR spectra and thermal programmed desorption experiments of the processed samples, some reaction products have been identified, offering insights into the solid phase low temperature dissociation chemistry of this species. Also, estimates of VUV and CR destruction cross-sections of indene (pure and in ASW) are given. These data can help in the interpretation of recent indene observations and guide elucubrations about its possible formation mechanisms.
2 Experimental setup
The experiments were performed in a high vacuum (HV) setup described previously (Maté et al. 2021; Timón et al. 2021), with a background pressure in the 10−8 mbar range. The chamber is provided with a closed-cycle He cryostat and coupled to a FTIR spectrometer through KBr windows. Solid indene layers were grown by vapor deposition on a cold infrared transparent Si substrate placed in thermal contact with the cold head of the cryostat. Indene is a commercial liquid (Sigma Aldrich, ≥99%) with 1 mbar vapor pressure at 20°C. To grow low temperature solid indene layers, the liquid was placed in a Pyrex tube and its vapor introduced into the vacuum chamber through a needle valve. An independent water line, also provided with a needle valve, was employed to generate indene:water ice mixtures. In order to control the stoichiometry of the mixtures it was experimentally convenient to increase the indene vapor pressure; for that purpose, the Pyrex tube was immersed in a silicone oil bath at 60 °C and the line heated. Pure ices were grown at 10 K and at 130 K, while ice mixtures were grown only at 10 K. Typical deposition pressures varied between 4 ×10⁻⁶ mbar for pure deposits and 4 × 10⁻⁵ mbar in the case of the mixtures, and typical deposition times were 5–30 min. In the high-vacuum chamber, the port for the gas lines is located in a plane about 15 cm below the cold head of the cryostat, between the cold head and the pumping system. This configuration guarantees the backfilling of the chamber with a homogeneous gas pressure and to grow ice layers of equal thickness at each side of the substrate. The deposited indene ice samples and their evolution with processing time were monitored with IR spectroscopy. Normal incidence transmission spectra, with 4 cm−1 resolution and 100 scans accumulation were recorded with a Vertex 70 FTIR spectrometer provided with a MCT detector. A quadrupole mass spectrometer (QMS; Hiden200) directly connected to the HV chamber allows for the gas phase composition in the chamber to be monitored during the experiments.
UV irradiation of the ice layers was carried out with a Hamamatsu L10706 D2 lamp (Maté et al. 2018) that provides a photon flux on the sample, estimated from the data given by the manufacturer, of ϕ0 = 7.5×l013 photons cm−2 s−1. Its emission has a maximum at 165 nm and is largely concentrated in the 120–180 nm range. Electron irradiation was performed with the electron gun described in previous works (Maté et al. 2016). The electron energy was fixed at 5 keV and the flux at ϕe = 4 × 10¹² electrons cm−2 s−1.
As in our previous works, the processing methodology applied here is to alternatively rotate the cryostat under vacuum to face the ice sample to the VUV (or electrons) beam or the IR beam. In one position, the sample is processed a controlled amount of time and in the other, the IR spectrum is taken in a normal transmission configuration. First, the ice on one side of the Si substrate is processed in this way and then the other. We performed a total of 50 min processing of each side, recod-ing spectra at time intervals that vary between 1 and 20 min. The evolution of the IR spectra versus processing time shows the decay of the indene features and the growth of new ones.
After energetic processing, we carried out thermal programmed desorption (TPD) experiments of the ice layers. Ramps of 1 K min−1 from 10 K to 300 K were used, while repetitively recording in the Scan Profile mode of the QMS, scans from 1 to 200 amu at a rate of 1 scan/68 s.
3 Results
3.1 Deposited samples
Amorphous and polycrystalline indene solid layers, grown by vapor deposition at 10 K and 130 K, respectively, and 10 K indene:water ice mixtures, with a very small number molecule fraction of indene (between 1 and 3%) were studied. The fresh deposited samples were characterized by their IR absorbance spectra. Typical spectra of amorphous and crystalline indene solids are shown in Maté et al. (2023). Spectral assignments and band strengths of the absorption features in the 4000–500 cm−1 interval are also given in Maté et al. (2023). Examples of the IR spectra of the ices grown in this work are shown as black traces in Figs. 1 and 2. Providing the IR band strength (A) is known, the column densities of the deposited indene samples can be estimated. We have taken in all cases the band at 768 cm−1 (out-of-plane in-phase CH bending) with A of 2.0 × 10⁻¹⁷ cm molecule−1 and 2.3 × 10⁻¹⁷ cm molecule−1 for amorphous and crystalline samples, respectively. This band is the most intense absorption feature in the indene spectra and although it overlaps with the libration mode of water at approx. 800 cm−1, its smaller FWHM allows for a proper separation of the indene absorption contribution. The column densities of amorphous solid water (ASW) in the indene-water ice mixtures were calculated from the v OH band taken a band strength of 2 × 10⁻¹⁶ cm molecule−1 for ASW at 10 K (Mastrapa et al. 2009). Possible modifications of indene or water band strengths in the indene:water mixtures have not been considered. The column densities of indene and water estimated in this way for the samples used in the processing experiments are listed in Table 1.
3.2 Products of energetic processing
3.2.1 Infrared spectra
Looking at the IR spectra of the processed samples, it is possible to extract some information about the species that form after the destruction of indene. Figure 1 shows photolysis experiments and Fig. 2 radiolysis experiments. The spectra at the end of the processing time are presented for the pure indene at 10 K, and indene diluted in ASW at 10 K, together with the initial ones. For a clear identification of the new emerging features, and for a better comparison of radiolysis versus photolysis chemistry, in Fig. 3 we present the difference, final minus initial, spectra of the spectra shown in Figs. 1 and 2. The main new features are listed in Table 2. In the discussion below, we provide possible destruction products that could be the carriers of the new IR features. The processing experiments could lead to the ionization of the indene molecule, as observed for larger PAHs. The ionization energy of indene is 8.16 eV (Zhou et al. 2009) in the gas phase. Woon & Park (2004) reported that the ionization energies of PAHs embedded in ice decrease with respect to those of the gas phase (for benzene, naphthalene, anthracene, and pyrene). A decrease in the ionization cross section with increasing cluster size was also observed for larger PAHs than indene (Joblin et al. 2017). Therefore, it is probable that the indene molecule, both in the pure solid form or diluted in water ice, will be easier to ionize than in the gas phase, and that both processing agents (VUV photons or keV electrons) employed in this work will cause some ionization. Unfortunately, the IR spectrum of the indene ion has only been reported theoretically and for the gas phase and therefore it is difficult to establish its presence in the processed ices of this work.
Most of the new peaks in the IR spectra are common to photolysis and radiolysis, both in pure and water-diluted samples. In the 3000 cm−1 region, new broad unresolved features appear at ≈2950 cm−1 and 2850 cm−1. These bands can be assigned to -sp3 hybridized C-H stretching vibrations. They could be due to −CH3 or −CH2 groups linked to a phenyl group, suggesting the formation of species like toluene or styrene, after the breaking of the five-member ring of indene (Pitzer & Scott 1943; Wilmshurst & Bernstein 1957).
A broad new absorption appears around ≈1660 cm−1 that is stronger in the samples containing water. For the pure indene samples, styrene and toluene C–C stretching can contribute in this region. In particular the C=C stretching of the vinyl group of styrene appears at 1650 cm−1 (Hermán et al. 2015). For indene:water samples, the broad strong absorption at 1700– 1550 cm−1 is most probably due to C=0 stretching group vibrations of aromatic ketones. The formation of these species in the photolysis of PAHs diluted in water ice has been stated in previous literature studies (Bernstein et al. 1999; Cook et al. 2015). In the pure indene experiments, oxygen could be also present in small amounts, due to residual H2O contamination in the high vacuum chamber. The CO vibration has a strong band strength as compared to C=C, and even a small fraction of oxygen could give a significant IR absorption.
New bands are observed at 1474 cm−1 and at 1438 cm−1 as shoulders at the high and low wavenumber wing of the 1458 cm−1 in-phase in-plane hexa-ring CH bending indene mode, and at 753 cm−1, in the low wavenumber wing of the strong in-phase out-of-plane CH bending of indene at 768 cm−1 (an assignment of the main solid indene modes is given in our previous paper; Maté et al. 2023). The new features are clearly seen in the pure species experiments but not so clearly in the indene:water ones; this is likely due to the fact that the bands get broader in the water ice matrix. It is plausible that the new bands will be associated with the same kind of motions but for species that have suffered some modifications, as in the previously mentioned ketones or alcohols. The indene cation is also a candidate, its calculated spectrum is provided in the NASA PAH database (Bauschlicher et al. 2018) and has a quite strong peak at 770 cm−1.
Other weak features at 1270 cm−1, 1248 cm−1, 1189 cm−1, and 1154 cm−1 are observed in the spectrum of pure indene processed with electrons and have been listed in Table 2. Their presence in electron processing and not in VUV processing is attributed to the smaller amount of indene processed in the later experiment, not to differences in the chemistry. No clear candidate is suggested for these absorptions.
In the low wavenumber region, a new band at 650 cm−1 is observed in the experiments with water, however, it is not present in pure indene experiments. It could be tentatively assigned to the 6 in-phase-out-of-plane CH bending of some O-containing benzene derivative (Socrates 2001). This band, together with the intense and broad band at 1700–1550 cm−1 suggest that a different chemistry takes place when indene is diluted in a water ice matrix (compare top and bottom panels in Fig. 3). This has indeed been observed and a quantification to support it is given below, namely, that indene destruction is much more efficient in water ices than in pure samples, both by radiolysis or photolysis.
Apart from the new bands associated tentatively to new aromatic species, in the 2500–2000 cm−1 region, we observe a set of new features which carriers are most likely lighter species as CO2 (2337 cm−1) or CO (2133 cm−1). The weak bands that appear in the 2256–2277 cm−1 range depending on the experiment could be assigned to the CO stretching in N-C-O groups, where the N atom must come from a nitrogen impurity in the high vacuum chamber. Finally, an unidentified new absorption is observed at about 2110 cm−1.
An inspection of the data in the bottom panel of Fig. 3 hints at some differences in the chemistry induced either by VUV photons or by electrons in the indene:water samples. First, a larger amount of CO2 is formed in the electron radiolysis as compared with the VUV photolysis. For a given number of destroyed indene molecules, radiolysis yields three times more CO2 molecules. Some of the C atoms can come from CO2 impurities in the vacuum chamber, but this fraction is almost the same for both processing agents when no water is present (see top panel of Fig. 3). Therefore, this observation indicates that in the water ice electron processing experiments a larger fraction of the indene destruction leads to the formation of CO2 and suggests a higher degree of fragmentation. Second, a band at 1036 cm−1 appears in the photolysis experiment and not in the radiolysis one. Finally, for a similar destruction fraction, the strength of the 650 cm−1 band is larger in the electron processing experiment. A probable carrier of the 1036 cm−1 band is phenylethyl alcohol (C8H10O), which appears at about 1046 cm−1 in the CO stretching mode (Badawi 2011). This appears to be a reasonable candidate for the molecule that can form after the breaking of the penta-ring, maintaining two of the C atoms in an aliphatic chain where some H and an OH group have been added. The lack of this alcohol in the electron processing experiment indicates a larger erosion of the indene destruction products, which leads to the formation of small molecules such as CO2. The carrier of the 650 cm−1 band must be therefore a more resistant, most likely aromatic, species.
Some additional information about the chemistry can be extracted from the kinetics. Comparing the decay of specific indene bands as a function of processing time, some differences are observed, as illustrated in Fig. 4. A faster decay and a larger destruction fraction is observed for the 768 cm−1 CH bending that involves the eight CH bonds, as compared with the three CH hexa-ring bending mode at 1458 cm−1 (see Fig. 4). This behaviour suggests that changes in the penta-ring are more likely. The decay of the 768 cm−1 band could be due either to H substitutions or losses in the penta-ring or directly to a breaking of this ring. The different decay speeds of these two bands are observed only in the pure-indene experiment. In the case of indene diluted in water ice, the possible differences lie within the experimental error.
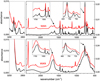 |
Fig. 1 MIR spectra of indene ices before (black traces) and after (red traces) UV irradiation (50 min each face). Spectra of the processed ices (red traces) have been displaced in the vertical axis for better visualization. Top and bottom panels correspond to the VUV1 and VUV3 samples listed in Table 1. |
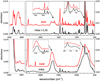 |
Fig. 2 MIR spectra of indene ices before (black traces) and after (red traces) high energy (5 keV) electron bombardment (50 min each face). Spectra of the processed ices (red traces) have been displaced in the vertical axis for better visualization. Top and bottom panels correspond to the ELE1 and ELE4 samples listed in Table 1. |
Ice samples used in the processing experiments.
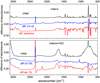 |
Fig. 3 Difference spectra, final processing minus initial, of the spectra shown in Figs. 1 and 2. A pure indene and an indene+water spectra, corresponding to samples VUV1 and VUV3 are also shown in black. Spectra have been displaced in the vertical axis for better visualization. |
New absorption peaks observed in the processed ices at 10 K and tentative assignment to molecular group vibrations.
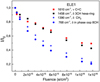 |
Fig. 4 Normalized decay of selected IR absorption bands of pure indene at 10 K versus fluence of 5 keV electrons (experiment ELE1). |
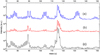 |
Fig. 5 Mass spectra recorded when a temperature of 270 K has been reached in the TPD processes, of indene processed with 5 keV electrons for pure indene (ELE2) (b) and indene:water (ELE4) (a). For comparison, trace (c) represents the mass spectrum of pure not processed indene taken at the same temperature during its thermal desorption. |
3.2.2 Thermal programed desorption
Infrared spectroscopy allows for the detection of functional groups, but unfortunately it is neither very sensitive nor selective enough for the identification of the specific molecular carriers of the observed absorption bands, especially for species of relatively large masses. To obtain complementary information, we have also performed thermal programmed desorption experiments involving the mass spectrometric detection of the desorbed molecules.
Figure 5 displays the TPD mass spectra of indene samples processed with 5 keV electrons. It presents scans recorded after reaching a temperature of 270 K for an 1.5% indene in water mixture (trace a), for pure indene (trace b), and for pure unprocessed indene (trace c) as a reference. This temperature has been selected because at 270 K the products of irradiation, especially those less volatile, reach their maximum signals. In contrast, indene and water have already evaporated to a great extent, as well as lighter products such as H2, CO2, light aliphatic species, and so on, which can also contribute significantly to the background signal. Therefore, the displayed mass range, between 70 and 152 amu, provides the most interesting parts of the three mass spectra, which have been displaced along the vertical axis for the sake of clarity.
Over the mass range shown, we see that indene has a complex mass spectrum, with plenty of peaks spanning up to 118 u. The highest intensities correspond to the peaks at 115 and 116 u (Fig. 5c). When pure indene is processed, traces of some other peaks begin to appear (Fig. 5b), which indicate the formation in small proportions of the products of pure indene destruction chemistry, as well as (conceivably) products of the destruction of indene plus background water trapped in the sample during the whole deposition and irradiation process at 10 K. At the same time, indene is lost during irradiation as shown by the appreciable decay of the corresponding peaks in the spectrum.
In the co-deposited water-and-indene sample, (Fig. 5a), the formation of new products is clearly seen in the growth of peaks in the mass intervals 75–80 u, 91 u, 100–105 u, 129–134 u, and 145–150 u. The identification of the new products is difficult due to the overlapping of fragment peaks from different species, but the sets of peaks observed are consistent with expected processing products and with the data from IR spectra. Under 5 keV electron bombardment the indene molecules in the ice can be directly destroyed leading to the formation of benzene (with a maximum peak at 78 u), toluene (with a maximum peak at 91 u), and styrene (with a maximum peak at 104 u). Note, that for all these species the more stable six-membered aromatic ring is preserved. Besides the product of direct fragmentation, indene can react with OH and H atoms resulting from the destruction of the water molecules. Reactions with OH will likely give rise to alcohols like indanole, C9H10O, (with a maximum peak at 105 u) and ketones such as indanone, C9H8O (with peak maxima at 104 and 132 u ). These molecules have isomers that can slightly change the fragmentation pattern within the mentioned sets of peaks. Products of double oxygenation, such as hydroxy-indanone, C9H8O2, are also possible and would be responsible for the smaller set of peaks at 145–150 u.
A study of the evolution of some of the main mass peaks with temperature in the TPD experiments can shed some light about the different volatility of possible processing products. Figure 6 shows results of the TPD experiments for the mixtures of indene and water ices processed, both with electrons (Fig. 6a), and with UV photons (Fig. 6b). The signals at 115 and 116 u correspond to the highest peaks of indene, which shows a maximum sublimation around 180 K. For the other signals, different behaviour can be appreciated among the masses 104 (pink colour in Fig. 6), 133–134 (green), and 120–148 u (blue). The three groups sublimate with a different profile and reach the sublimation maximum at a different temperature. It seems that the heaviest species sublimate later. We note that mass 120 u is likely a fragment of one of the compounds with their maximum mass peaks at 148 amu. This behavior can be observed, both with electrons and with UV processing, although the efficiency of the UV irradiation is noticeably lower.
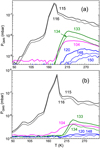 |
Fig. 6 Thermal programmed desorption curves of indene:water ices warmed at 1 K min−1 for the electron processing experiment ELE4 (a) and for the VUV processing experiment VUV3. The number for each curve indicates the corresponding mass peak. |
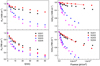 |
Fig. 7 Evolution of the intensity of the 1458 cm-1 and 768 cm-1 bands of indene under VUV (120–180 nm) photolysis. Left column: evolution of the band intensities normalized to the initial value (I/I0) as a function of time. Right column: logarithmic representation of the same decays shown in the left panels but versus fluence (estimated with assuming |

3.3 Kinetics
Indene destruction under irradiation with VUV photons or high energy electrons will be assumed to follow first-order destruction kinetics, characterized by a destruction cross-section, σdes:
 (1)
(1)
where N represents the concentration of indene and F is the fluence, usually expressed in photons or electrons cm-2. Since the concentration of indene is proportional to the intensity of its absorption bands in the absorbance spectrum, Eq. (1) can be transformed into:
 (2)
(2)
where I0 and IF represent the initial intensity and the intensity at fluence F of a particular indene absorption band. During the irradiation process, the decomposition products might react back to form the precursor or evolve giving secondary species. These effects will lead to a deviation from the linear behavior expressed by Eq. (2). With the aim of extracting a destruction cross-section, we assume that the equation describes the destruction at least at the beginning of energetic processing.
Since the different bands correspond to different molecular vibrations and involve different bonds, it is possible that they evolve differently with time leading to different destruction cross-sections. We have analyzed all the indene bands with a high-enough signal-to-noise ratio (S/N) in the IR spectrum to be able to follow their evolution with processing time. Differences are observed both in the decay speed and in attenuation fraction, mostly in the pure indene experiments. Roughly, they can be grouped in two sets, an example of some of the decays is given in Fig. 7.
We decided to extract destruction cross-sections from two of the strongest indene bands, at 1458 cm-1 and at 768 cm-1, that are representative of the fast and slow destruction tendencies observed. Both bands are assigned to a CH bending modes, but they will be sensitive to modifications of the aromatic structure of the indene molecule and also to H substitutions by other groups. To follow the destruction of one of the indene rings more directly, it would be necessary to monitor the decay of the band assigned to a C=C mode, which appears about 1610 cm-1. However, except for the pure indene electron processing experiment, the absolute intensity and the decay of this band is very weak, and we could not extract reliable destruction cross-sections from it.
3.3.1 VUV photolysis
Ices usually absorb a large fraction of VUV radiation. For that reason, in many cases, the ice samples grown in the laboratory cannot be considered to be optically thin. When that happens, the attenuation of the initial photon flux, ϕ0, during the passage of the VUV beam through the ice layer has to be taken into account. An approximation that can be made is to consider an average photon flux, ϕav, that will be estimated as (Maté et al. 2021):
 (3)
(3)
where σa is the ice VUV absorption cross-section. For a binary mixture the absorption cross-section can be roughly approximated by σmix ≈ f1σ1 + /2σ2, where fi is the molecular fraction and σi; the absorption cross-section of component i. This average flux is employed to estimate the fluence as: F = ϕav At, where ∆t is the processing time. However, in order to perform these calculations, the VUV absorption cross-section of the ice is needed. The average absorption cross-section of water ice over the 120–180 nm range, σa(H2O) ≈ 3 × 10-18 cm2, was taken from Cruz-Diaz et al. (2014). For indene, the experimental literature data available are for the species in solution and show that the absorption grows to lower wavelengths, the maximum being about 3 × 10-17 cm2 at 200 nm, the lower wavelength measured (Garratt 1993; Rambart-Lucas 1950). The gas-phase VUV absorption cross-sections measured from benzene, naphthalene, and cyclopentene (Keller-Rudek et al. 2013) have maximum values that vary between 2.6 × 10⁻¹⁷ cm2 and 4 × 10-16 cm2, located between 180 nm and 200 nm, depending on the species. Calculations for the indene molecule performed by Borin & Serrano-Andrés (1999) found that the UV indene spectrum has two strong absorptions at 5.0 eV (248 nm) and 5.9 eV (210 nm), with the second one being the strongest. Combining the experimental and theoretical information available, it seems reasonable to assume 3 × 10-17–3 × 10-16 cm2 as lower and upper limits for the indene average absorption cross-section over the wavelength range of the D2 VUV lamp. In the present work, these two limiting values are considered to estimate the average flux via Eq. (3), that is then used to estimate F and subsequently derive the indene destruction cross-sections via Eq. (2).
The decay versus processing time of the bands at 1458 cm-1 and at 768 cm-1 for the four VUV experiments listed in Table 1 are shown in the left panels of Fig. 7. Fitting the linear part of the logarithmic representation of those decays versus fluence gives the cross-sections that are listed in Table 3. It can be seen that the linear behavior extends up to 30 min processing for the 130 K experiment. For pure indene at 10 K and indene:water ices the linear behavior is observed only for the first ≈10 min of processing, corresponding to fluences up to 1–2 × 10¹⁶ ph cm-2.
From Fig. 7 and the cross sections listed in Table 3 it can be seen that indene photolysis is very much enhanced by the water ice environment, with band intensities decaying faster in the water ice mixtures. This large enhancement of the photolysis caused by water ice was not observed for other species investigated in our group. For example, methylisocyanate when diluted at 4% in water ice shows a moderate decay in the photolysis cross-section as compared with that of the pure species (Maté et al. 2018). In the case of 2-aminooxazole (Maté et al. 2021), no effect of the water ice matrix was observed on the VUV destruction cross-section. Regarding the absolute cross-section values, indene is more labile versus photolysis at 10 K, both pure or mixed with water, than other COMs like urea (Herrero et al. 2022) or methylisocyanate.
In relation with the different decays of the two indene modes chosen, for the pure species the destruction of the molecular groups responsible for the in-phase out-of-plane CH bending (768 cm-1) is faster than that associated with the in-plane hexa-ring CH bending (1458 cm-1). The differences, if they exist, are smaller in water diluted samples, where the two cross-sections are equal, within the mutual experimental uncertainty (see Table 3). This can be an indication of a different destruction chemistry in the two kinds of ices (pure versus mixed with water).
VUV destruction cross-sections for pure indene and indene/water ice samples.
3.3.2 Electron radiolysis
Figure 8 shows the evolution of the bands at 1478 cm-1 and 768 cm-1 of indene for the electron processing experiments listed in Table 1. The linear behavior extends up to 30–40 min, corresponding to fluences of 1 × 10¹⁶ e cm-2, in the pure species experiments. In contrast, the linear behavior is not clearly seen in the water mixture experiment, where the criterion was to fit the first 5 min of the decay. The destruction cross-sections for electron bombardment are listed in Table 4. In analogy with the VUV photolysis experiments, indene destruction is enhanced by the water ice matrix.
As for the comparison of the decays of the two bands, for pure indene ices the tendency is similar to that observed for VUV processing, the 768 cm-1 mode decays faster than the 1458 cm-1 mode. And for mixtures, again in agreement with VUV experiments, the difference of the destruction cross-sections of the two bands lies within experimental error, that is large in these very diluted samples.
3.3.3 Energetic destruction yields
The energetic cost for the destruction of indene ices with UV photons and 5 keV electrons can be estimated with the cross-sections derived in the previous section. The amount of energy needed to reduce by one half the initial number of indene molecules, known as half-life dose, can be estimated from Eq. (2). The half-life fluence is defined as:
 (4)
(4)
And the half-life dose is then given by:
 (5)
(5)
where fE is the fraction of energy deposited by the photons or electrons in the sample, E is the photon (average, 8.1 eV in this work), or electron energy and N0 is the initial column density. In the electron processing experiments, the energy is deposited in an approximately homogeneous way throughout the sample that can be quantified by means of a linear energy transfer, LET, and Eq. (5) is then expressed as:
 (6)
(6)
where ρ is the volume density. For a binary mixture it can be roughly approximated by ρ ≈ f1 ρ1 + f2 ρ2, where fi is the fraction of the ith component. The linear energy transfer for our experiments were calculated with the CASINO code Drouin et al. (2007). The LET values are listed in Table 4.
In the photolysis experiments, due to indene absorption, the incident radiation can be significantly attenuated within the sample and, therefore, the absorption of energy is not homogeneous thorough the sample thickness. For this case, the optically thin limit (N → 0) has to be considered (Maté et al. 2021) and within this limit:
 (7)
(7)
where σa is the absorption cross section. Then, for each component in a mixture, the half-life dose is given by (Maté et al. 2021):
 (8)
(8)
where σa is the absorption cross-section of the mixture and fi the molecular fraction of component i. The D½ obtained for the photolysis and electron radiolysis of the various ices studied in this work are listed in Tables 3 and 4.
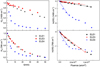 |
Fig. 8 Evolution of the intensity of the 1458 cm-1 and 768 cm-1 bands of indene under 5 keV electrons radiolysis. Left column: evolution of the band intensities normalized to the initial value (I/I0) as a function of time. Right column: logarithmic representation of the decays shown in the left panels versus fluence, and fits (straight lines) of the linear decay interval to Eq. (2). |
Destruction cross-section of 5 keV electrons for pure indene and indene-water ice samples.
Lifetimes of indene in astrophysical environments.
4 Astrophysical implications
Indene, if indeed present on the surface of ice grains, is expected to be at most a minor component in ice mixtures dominated by water and with a significant proportion of CO and CO2. We have thus taken the half-life doses of the indene-water mixtures for the calculation of the half-lives of indene in space ices. From the two half-life doses available, corresponding to the different decay rates of the CH bending bands, we have chosen the lowest one, since it gives the lower limit for bond breaking in indene.
The properties of cold molecular clouds show large variations between the diffuse and the dense medium (Snow & McCall 2006). With increasing density, the VUV field and, to a lesser extent, the CR flow become appreciably attenuated. Approximate values of the energy dose rates imparted by VUV photons and CRs on the ice mantles of dust grains have been provided by Moore et al. (2001) for the two extreme cases of diffuse and dense molecular clouds. We have used these values and the experimental half-life doses of indene in water ice determined in this work, to estimate the half-life of indene in these two environments (see Table 5). Considering the approximations made in Moore et al. (2001) and the experimental uncertainty of the present measurements the derived half-lives must be considered as order of magnitude estimates.
The composition and properties of the prototypical dark cloud TMC-1 have recently been the subject of thorough studies combining observations with the discovery of a plethora of new molecules with the QUIJOTE and GOTHAM line surveys (see Cernicharo et al. 2021a,b,c, 2022, 2023; Cabezas et al. 2023; McGuire et al. 2018, 2021; Remijan et al. 2023 and references therein) and chemical models (Fuente et al. 2019; Navarro-Almaida et al. 2021; Chen et al. 2022; Cernicharo et al. 2022). As mentioned in the introduction, gas-phase indene was recently detected in TMC-1 and, more specifically, in the starless core TMC-1CP (Cernicharo et al. 2021a; Burkhardt et al. 2021). Evolutionary chemical models of TMC-1CP yield a best-fit time in the range 0.5–1 Myr (Navarro-Almaida et al. 2021; Chen et al. 2022; Cernicharo et al. 2022). The derived lifetime for indene in ice mantels (Table 5) is appreciably larger. In contrast, indene in ice mantles toward the diffuse cloud region would be readily destroyed (in hundreds of years) by the intense VUV field.
As discussed above, the presence of water ice enhances the destruction of indene under energetic processing and leads to the production of alcohols and ketones. Pure indene is somewhat more resilient toward photolysis and radiolysis. Nevertheless, the lower destruction cross-section measured for pure indene ice cannot compensate the strong VUV field of the diffuse medium and hypothetical indene on the surface of bare grains would also be immediately destroyed.
Some COMs typical of hot cores and corinos such as C2H3CHO, C2H3OH, HCOOCH3, CH3OCH3, CH3CH2OH, CH3COCH3, CH3CH2CHO, and CH3CHCO have been found in TMC-1 (Agúndez et al. 2021,2023; Fuentetaja et al. 2023) which suggests a possible release of molecules to the gas phase from the surface of the grains. However, their abundances in TMC-1 are rather low compared with the carbon-bearing species formed in the gas-phase.
The release of ice-processed indene products to the gas phase could be studied through sensitive line surveys such as QUIJOTE (Cernicharo et al. 2021b). So far, only CCH and CN derivatives of benzene, indene and naphthalene have been observed. Most of the large cycles produced in the gas phase (Cernicharo et al. 2023) and detected towards TMC-1 are being incorporated into the grain surfaces during the chemical and dynamical evolution of the cloud. These species will be well protected against UV radiation during most of the cloud evolution. Hence, deposited indene and other small PAHs could survive UV destruction, thereby providing time for its reaction with H2O and to the production of PAH-based COMs. In the future, improved QUIJOTE data could enable the detection of some O and OH derivatives of these species (as those found in our experiments), which will certainly provide additional insights into the chemistry of cold dark clouds.
5 Summary and conclusions
Motivated by the recent detection of indene in the gas phase in cold regions in the ISM and with the aim to help understand the chemistry of this aromatic molecule, we have investigated the stability of indene and indene/water ice mixtures under VUV (120-180 nm) irradiation and high energy (5 keV) electron bombardment under conditions relevant for the ISM. IR spectroscopy was used to follow in situ the effects of irradiation. The main findings of this work are listed here:
- 1.
Toluene and styrene are identified in the IR spectra. The formation of more complex species, like ketones and alcohols is also evidenced in the IR spectra and detected in the thermal programed desorption of the processed ices. Compounds with the chemical formula (C9H8O) with a maximum peak at 132 u, (C8H6O2) with a maximum peak at 134 u, and C9H8O2 with a maximum peak at 149 u are plausible candidates;
- 2.
The decomposition products in photolysis and radioly-sis experiments are mostly the same. When processing indene:water ices, it is observed that the electrons cause a larger erosion of the indene products than VUV photons, leading to the formation of a larger fraction of small molecules such as CO2;
- 3.
The photolysis and radiolysis cross-sections for the pure indene solid do not strongly depend on the temperature, between 10 K and 130 K;
- 4.
Water ice does not protect indene versus VUV or CR effects. On the contrary, fragments from the processing of water participate in the chemistry and enhance indene destruction;
- 5.
Indene could survive in the ice mantles of cold dense clouds for more than 10 Myr. In contrast, indene in ice mantles toward the diffuse cloud region would be readily destroyed (in hundreds of years) by the intense VUV field.
Chemical models are not yet capable of accounting for the observed abundance of gas-phase indene in TMC-1. Given the very low temperature in the detection region, a very large fraction of the indene molecules is likely present in the ice mantles of dust grains and the role of these molecules in the overall chemistry ought to be considered. The results of the present work indicate that the indene reservoir in the ice mantles should be stable against VUV radiation and cosmic rays for a time longer than that estimated for the present chemical evolution in TMC-1.
Acknowledgements
B.M., I.T., R.J.P., V.J.H. and J.C. acknowledge support from the Ministerio de Economia y Competitividad (MINECO) and the Ministerio de Ciencia e Innovation (MiCiNN) of Spain under grants PID2020-113084GB-100/AEI/10.13039/501100011033 and PID2019-107115GB-C21/AEI/10.13039/501100011033, and from the European Union under grant ERC-2013-Syg-210656-NANOCOSMOS.
References
- Abplanalp, M. J., Frigge, R., & Kaiser, R. I. 2019, Sci. Adv., 5, eaaw5841 [NASA ADS] [CrossRef] [Google Scholar]
- Agúndez, M., Marcelino, N., Tercero, B., et al. 2021, A&A, 649, A4 [NASA ADS] [CrossRef] [EDP Sciences] [Google Scholar]
- Agúndez, M., Loison, J.-C., Hickson, K. M., et al. 2023, A&A, 673, A34 [NASA ADS] [CrossRef] [EDP Sciences] [Google Scholar]
- Allamandola, L. J., Tielens, A. G. G. M., & Barker, J. R. 1985, ApJ, 290, L25 [Google Scholar]
- Badawi, H. M. 2011, Spectroch. Acta A: Mol. Biomol. Spectrosc., 82, 63 [NASA ADS] [CrossRef] [Google Scholar]
- Barnett, I. L., Lignell, A., & Gudipati, M. S. 2012, ApJ, 747, 13 [NASA ADS] [CrossRef] [Google Scholar]
- Bauschlicher, C. W., Ricca, A., Boersma, C., & Allamandola, L. J. 2018, ApJSS, 234, 32 [NASA ADS] [CrossRef] [Google Scholar]
- Bernstein, M. P., Sandford, S. A., Allamandola, L. J., et al. 1999, Science, 283, 1135 [NASA ADS] [CrossRef] [Google Scholar]
- Borin, A. C., & Serrano-Andrés, L. 1999, J. Mol. Struct.: THEOCHEM, 464, 121 [Google Scholar]
- Bouwman, J., Cuppen, H. M., Steglich, M., Allamandola, L. J., & Linnartz, H. 2011, A&A, 529, A46 [NASA ADS] [CrossRef] [EDP Sciences] [Google Scholar]
- Burkhardt, A. M., Lee, K. L. K., Changala, P. B., et al. 2021, ApJ, 913, L18 [Google Scholar]
- Cabezas, C., Tang, J., Agúndez, M., et al. 2023, A&A, 676, A5 [NASA ADS] [CrossRef] [EDP Sciences] [Google Scholar]
- Cernicharo, J., Agúndez, M., Cabezas, C., et al. 2021a, A&A, 649, A15 [Google Scholar]
- Cernicharo, J., Agúndez, M., Kaiser, R. I., et al. 2021b, A&A, 652, A9 [Google Scholar]
- Cernicharo, J., Agúndez, M., Kaiser, R. I., et al. 2021c, A&A, 655, A1 [NASA ADS] [CrossRef] [EDP Sciences] [Google Scholar]
- Cernicharo, J., Fuentetaja, R., Agúndez, M., et al. 2022, A&A, 663, A9 [NASA ADS] [CrossRef] [EDP Sciences] [Google Scholar]
- Cernicharo, J., Tercero, B., Marcelino, N., Agúndez, M., & de Vicente, P. 2023, A&A, 674, A4 [NASA ADS] [CrossRef] [EDP Sciences] [Google Scholar]
- Chen, L.-F., Li, D., Quan, D., et al. 2022, ApJ, 928, 175 [NASA ADS] [CrossRef] [Google Scholar]
- Cherchneff, I. 2012, A&A, 545, A12 [NASA ADS] [CrossRef] [EDP Sciences] [Google Scholar]
- Cook, A. M., Ricca, A., Mattioda, A. L., et al. 2015, ApJ, 799, 14 [NASA ADS] [CrossRef] [Google Scholar]
- Cruz-Diaz, G. A., Muñoz Caro, G. M., Chen, Y.-J., & Yih, T.-S. 2014, A&A, 562, A119 [NASA ADS] [CrossRef] [EDP Sciences] [Google Scholar]
- Cruz-Diaz, G. A., Martín-Doménech, R., Moreno, E., Muñoz Caro, G. M., & Chen, Y.-J. 2017, MNRAS, 474, 3080 [Google Scholar]
- Cuylle, S. H., Allamandola, L. J., & Linnartz, H. 2014, A&A, 562, A22 [NASA ADS] [CrossRef] [EDP Sciences] [Google Scholar]
- Dartois, E., Chabot, M., Pino, T., et al. 2017, A&A, 599, A130 [Google Scholar]
- Dartois, E., Chabot, M., Koch, F., et al. 2022, A&A, 663, A25 [NASA ADS] [CrossRef] [EDP Sciences] [Google Scholar]
- de Barros, A. L. F., Mattioda, A. L., Ricca, A., Cruz-Diaz, G., & Allamandola, L. J. 2017, ApJ, 848, 112 [NASA ADS] [CrossRef] [Google Scholar]
- Doddipatla, S., Galimova, G. R., Wei, H., et al. 2021, Sci. Adv., 7, eabd4044 [Google Scholar]
- Dohnálek, Z., Kimmel, G. A., Ayotte, P., Smith, R. S., & Kay, B. D. 2003, J. Chem. Phys., 118, 364 [CrossRef] [Google Scholar]
- Drouin, D., Couture, A. R., Joly, D., et al. 2007, Scanning, 29, 92 [CrossRef] [PubMed] [Google Scholar]
- Frenklach, M., & Feigelson, E. D. 1989, ApJ, 341, 372 [NASA ADS] [CrossRef] [Google Scholar]
- Fuente, A., Navarro, D. G., Caselli, P., et al. 2019, A&A, 624, A105 [NASA ADS] [CrossRef] [EDP Sciences] [Google Scholar]
- Fuentetaja, R., Bermúdez, C., Cabezas, C., et al. 2023, A&A, 671, L6 [NASA ADS] [CrossRef] [EDP Sciences] [Google Scholar]
- Garratt, P. J. 1993, Adv. Mater., 5, 770 [NASA ADS] [CrossRef] [Google Scholar]
- Garrod, R. T., Wakelam, V., & Herbst, E. 2007, A&A, 467, 1103 [NASA ADS] [CrossRef] [EDP Sciences] [Google Scholar]
- Hermán, V., Takacs, H., Duclairoir, F., et al. 2015, RSC Adv., 5, 51371 [CrossRef] [Google Scholar]
- Herrero, V. J., Tanarro, I., Jimenez-Serra, I., et al. 2022, MNRAS, 517, 1058 [NASA ADS] [CrossRef] [Google Scholar]
- Joblin, C., Dontot, L., Garcia, G. A., et al. 2017, J. Phys. Chem. Lett., 8, 3697 [NASA ADS] [CrossRef] [Google Scholar]
- Kalvans, J. 2021, ApJ, 910, 54 [CrossRef] [Google Scholar]
- Keller-Rudek, H., Moortgat, G. K., Sander, R., & Sorensen, R. 2013, Earth Syst. Sci. Data, 5, 365 [NASA ADS] [CrossRef] [Google Scholar]
- Kwok, S. 2004, Nature, 430, 985 [NASA ADS] [CrossRef] [Google Scholar]
- Leger, A., & Puget, J. L. 1984, A&A, 137, L5 [Google Scholar]
- Marchione, D., & McCoustra, M. R. S. 2016, Phys. Chem. Chem. Phys., 18, 29747 [NASA ADS] [CrossRef] [Google Scholar]
- Martínez, L., Santoro, G., Merino, P., et al. 2020, Nat. Astron., 4, 97 [Google Scholar]
- Mastrapa, R. M., Sandford, S. A., Roush, T. L., Cruikshank, D. P., & Ore, C. M. D. 2009, ApJ, 701, 1347 [NASA ADS] [CrossRef] [Google Scholar]
- Maté, B., Molpeceres, G., Jiménez-Redondo, M., Tanarro, I., & Herrero, V. J. 2016, ApJ, 831, 51 [CrossRef] [Google Scholar]
- Maté, B., Molpeceres, G., Tanarro, I., et al. 2018, ApJ, 861, 61 [Google Scholar]
- Maté, B., Carrasco-Herrera, R., Timon, V., et al. 2021, ApJ, 909, 123 [CrossRef] [Google Scholar]
- Maté, B., Tanarro, I., Timon, V., Cernicharo, J., & Herrero, V. J. 2023, MNRAS, 523, 5887 [CrossRef] [Google Scholar]
- McCabe, M. N., Hemberger, P., Reusch, E., Bodi, A., & Bouwman, J. 2020, J. Phys. Chem. Lett., 11, 2859 [CrossRef] [Google Scholar]
- McGuire, B. A., Burkhardt, A. M., Kalenskii, S., et al. 2018, Science, 359, 202 [Google Scholar]
- McGuire, B. A., Loomis, R. A., Burkhardt, A. M., et al. 2021, Science, 371, 1265 [Google Scholar]
- Moore, M., Hudson, R., & Gerakines, P. 2001, Spectrochim. Acta A: Mol. Biomol. Spectrosc., 57, 843 [NASA ADS] [CrossRef] [Google Scholar]
- Navarro-Almaida, D., Fuente, A., Majumdar, L., et al. 2021, A&A, 653, A15 [NASA ADS] [CrossRef] [EDP Sciences] [Google Scholar]
- Noble, J. A., Jouvet, C., Aupetit, C., Moudens, A., & Mascetti, J. 2017, A&A, 599, A124 [NASA ADS] [CrossRef] [EDP Sciences] [Google Scholar]
- Noble, J. A., Michoulier, E., Aupetit, C., & Mascetti, J. 2020, A&A, 644, A22 [NASA ADS] [CrossRef] [EDP Sciences] [Google Scholar]
- Öberg, K. I., Linnartz, H., Visser, R., & Dishoeck, E. F. V. 2009, ApJ, 693, 1209 [CrossRef] [Google Scholar]
- Pino, T., Chabot, M., Beroff, K., et al. 2019, A&A, 623, A134 [NASA ADS] [CrossRef] [EDP Sciences] [Google Scholar]
- Pitzer, K. S., & Scott, D. W. 1943, J. Am. Chem. Soc., 65, 803 [CrossRef] [Google Scholar]
- Radhakrishnan, S., Gudipati, M. S., Sander, W., & Lignell, A. 2018, ApJ, 864, 151 [NASA ADS] [CrossRef] [Google Scholar]
- Rambart-Lucas, M., & Grumes, M. 1950, Bull. Soc. Chim. Fr., 17, 317 [Google Scholar]
- Remijan, A., Scolati, H. N., Burkhardt, A. M., et al. 2023, ApJ, 944, L45 [NASA ADS] [CrossRef] [Google Scholar]
- Santoro, G., Martinez, L., Lauwaet, K., et al. 2020, ApJ, 895, 97 [CrossRef] [Google Scholar]
- Snow, T. P., & McCall, B. J. 2006, ARA&A, 44, 367 [NASA ADS] [CrossRef] [Google Scholar]
- Socrates, G. 2001, Infrared and Raman Characteristic Group Frequencies. Tables and Charts (Wiley) [Google Scholar]
- Tielens, A. G. 2008, ARA&A, 46, 289 [NASA ADS] [CrossRef] [Google Scholar]
- Timón, V., Maté, B., Herrero, V. J., & Tanarro, I. 2021, Phys. Chem. Chem. Phys., 23, 22344 [CrossRef] [Google Scholar]
- Torres-Diaz, D., Basalgète, R., Bertin, M., et al. 2023, Chem. Phys. Chem., 24, e202200912 [Google Scholar]
- Vasyunin, A. I., & Herbst, E. 2013, ApJ, 769, 34 [Google Scholar]
- Wilmshurst, J. K., & Bernstein, H. J. 1957, Can. J. Chem., 35, 911 [NASA ADS] [CrossRef] [Google Scholar]
- Woon, D. E., & Park, J. 2004, ApJ, 607, 342 [NASA ADS] [CrossRef] [Google Scholar]
- Zhou, Z., Xie, M., Wang, Z., & Qi, F. 2009, Rapid Commun. Mass Spectrom., 23, 3994 [CrossRef] [Google Scholar]
All Tables
New absorption peaks observed in the processed ices at 10 K and tentative assignment to molecular group vibrations.
Destruction cross-section of 5 keV electrons for pure indene and indene-water ice samples.
All Figures
|
Fig. 1 MIR spectra of indene ices before (black traces) and after (red traces) UV irradiation (50 min each face). Spectra of the processed ices (red traces) have been displaced in the vertical axis for better visualization. Top and bottom panels correspond to the VUV1 and VUV3 samples listed in Table 1. |
| In the text | |
|
Fig. 2 MIR spectra of indene ices before (black traces) and after (red traces) high energy (5 keV) electron bombardment (50 min each face). Spectra of the processed ices (red traces) have been displaced in the vertical axis for better visualization. Top and bottom panels correspond to the ELE1 and ELE4 samples listed in Table 1. |
| In the text | |
|
Fig. 3 Difference spectra, final processing minus initial, of the spectra shown in Figs. 1 and 2. A pure indene and an indene+water spectra, corresponding to samples VUV1 and VUV3 are also shown in black. Spectra have been displaced in the vertical axis for better visualization. |
| In the text | |
|
Fig. 4 Normalized decay of selected IR absorption bands of pure indene at 10 K versus fluence of 5 keV electrons (experiment ELE1). |
| In the text | |
|
Fig. 5 Mass spectra recorded when a temperature of 270 K has been reached in the TPD processes, of indene processed with 5 keV electrons for pure indene (ELE2) (b) and indene:water (ELE4) (a). For comparison, trace (c) represents the mass spectrum of pure not processed indene taken at the same temperature during its thermal desorption. |
| In the text | |
|
Fig. 6 Thermal programmed desorption curves of indene:water ices warmed at 1 K min−1 for the electron processing experiment ELE4 (a) and for the VUV processing experiment VUV3. The number for each curve indicates the corresponding mass peak. |
| In the text | |
|
Fig. 7 Evolution of the intensity of the 1458 cm-1 and 768 cm-1 bands of indene under VUV (120–180 nm) photolysis. Left column: evolution of the band intensities normalized to the initial value (I/I0) as a function of time. Right column: logarithmic representation of the same decays shown in the left panels but versus fluence (estimated with assuming |
| In the text | |
|
Fig. 8 Evolution of the intensity of the 1458 cm-1 and 768 cm-1 bands of indene under 5 keV electrons radiolysis. Left column: evolution of the band intensities normalized to the initial value (I/I0) as a function of time. Right column: logarithmic representation of the decays shown in the left panels versus fluence, and fits (straight lines) of the linear decay interval to Eq. (2). |
| In the text | |
Current usage metrics show cumulative count of Article Views (full-text article views including HTML views, PDF and ePub downloads, according to the available data) and Abstracts Views on Vision4Press platform.
Data correspond to usage on the plateform after 2015. The current usage metrics is available 48-96 hours after online publication and is updated daily on week days.
Initial download of the metrics may take a while.