Fig. 7
Download original image
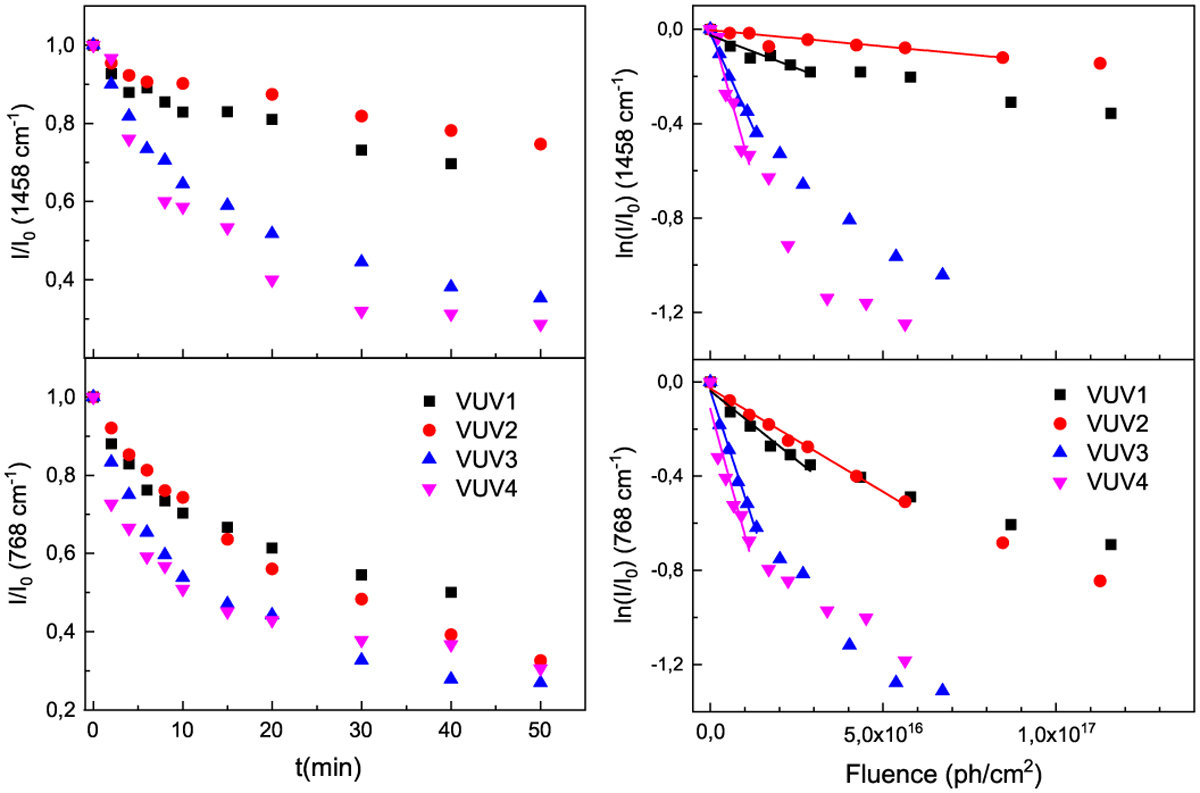
Evolution of the intensity of the 1458 cm-1 and 768 cm-1 bands of indene under VUV (120–180 nm) photolysis. Left column: evolution of the band intensities normalized to the initial value (I/I0) as a function of time. Right column: logarithmic representation of the same decays shown in the left panels but versus fluence (estimated with assuming ![]() ), and fits (straight lines) of the linear decay interval to Eq. (2).
), and fits (straight lines) of the linear decay interval to Eq. (2).
Current usage metrics show cumulative count of Article Views (full-text article views including HTML views, PDF and ePub downloads, according to the available data) and Abstracts Views on Vision4Press platform.
Data correspond to usage on the plateform after 2015. The current usage metrics is available 48-96 hours after online publication and is updated daily on week days.
Initial download of the metrics may take a while.