Open Access
Fig. 2
Download original image
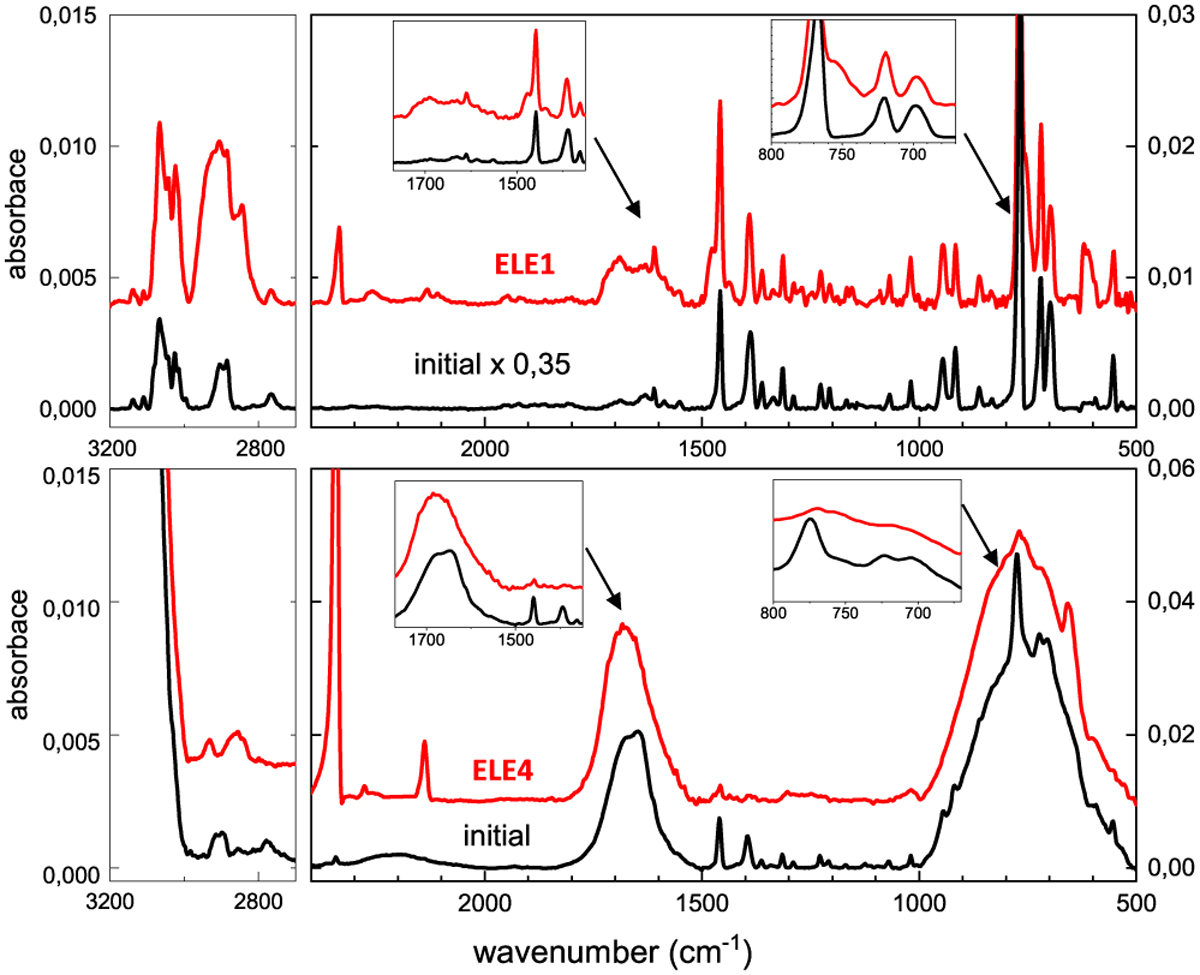
MIR spectra of indene ices before (black traces) and after (red traces) high energy (5 keV) electron bombardment (50 min each face). Spectra of the processed ices (red traces) have been displaced in the vertical axis for better visualization. Top and bottom panels correspond to the ELE1 and ELE4 samples listed in Table 1.
Current usage metrics show cumulative count of Article Views (full-text article views including HTML views, PDF and ePub downloads, according to the available data) and Abstracts Views on Vision4Press platform.
Data correspond to usage on the plateform after 2015. The current usage metrics is available 48-96 hours after online publication and is updated daily on week days.
Initial download of the metrics may take a while.