Fig. 3
Download original image
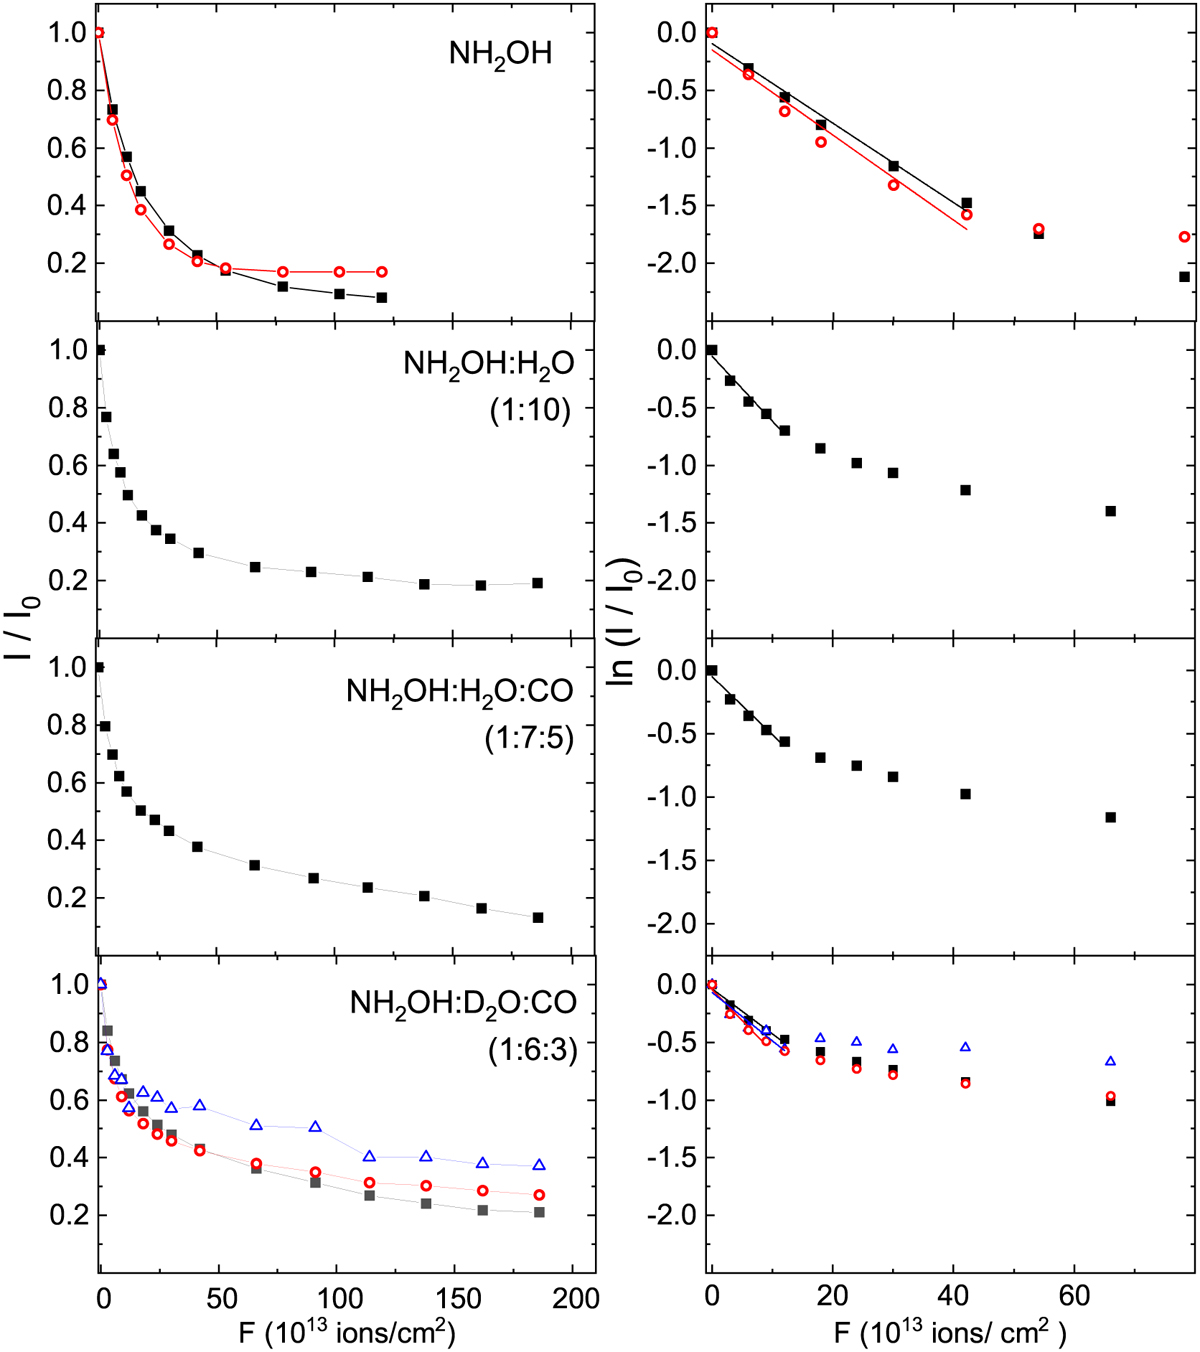
Hydroxylamine IR band decay as a function of proton fluence. Left panels: normalised absorption band area decay for three distinct IR vibrational modes (black squares: NH2 wagging mode; red circles: OH stretching mode; blue triangles: NO stretching mode). We note that lines between the individual data points are not fits and are plotted solely to guide the eye. Right panels: natural logarithmic representation of data plotted in the left panels. We note that, in this case, the straight lines are linear trend lines fitted to data points at low proton fluences.
Current usage metrics show cumulative count of Article Views (full-text article views including HTML views, PDF and ePub downloads, according to the available data) and Abstracts Views on Vision4Press platform.
Data correspond to usage on the plateform after 2015. The current usage metrics is available 48-96 hours after online publication and is updated daily on week days.
Initial download of the metrics may take a while.