| Issue |
A&A
Volume 695, March 2025
|
|
|---|---|---|
| Article Number | A12 | |
| Number of page(s) | 9 | |
| Section | The Sun and the Heliosphere | |
| DOI | https://doi.org/10.1051/0004-6361/202453282 | |
| Published online | 26 February 2025 | |
Radio dimming associated with filament eruptions in the meter and decimeter wavebands
1
School of Earth and Space Sciences, Peking University, Beijing 100871, China
2
Key Laboratory of Space Weather, Chinese Academy of Sciences, Beijing 100871, China
3
National Space Science Center, Chinese Academy of Sciences, Beijing 100871, China
4
Radio Science and Technology Center ( π Center), Chengdu 610041, China
5
Korea Astronomy and Space Science Institute, 34055 Daejeon, Republic of Korea
6
Max Planck Institute for Solar System Research, Justus-von-Liebig-Weg 3, 37077 Göttingen, Germany
7
Space Research and Technology Institute, Bulgarian Academy of Sciences, Acad. Georgy Bonchev Str., Bl. 1, 1113 Sofia, Bulgaria
8
School of Physics and Astronomy, Yunnan University, Kunming 650050, China
9
School of Space Science and Technology, Shandong University, Weihai 264209, China
10
Key Laboratory of Dark Matter and Space Astronomy, Purple Mountain Observatory, CAS, Nanjing 210023, China
11
School of Astronomy and Space Science, Nanjing University, Nanjing 210023, China
⋆ Corresponding authors; This email address is being protected from spambots. You need JavaScript enabled to view it.
, This email address is being protected from spambots. You need JavaScript enabled to view it.
Received:
4
December
2024
Accepted:
17
January
2025
Abstract
Filament eruptions are considered to be a common phenomenon on the Sun and other stars, yet they are rarely directly imaged in the meter and decimeter wavebands. Using imaging data from the DAocheng solar Radio Telescope (DART) in the 150−450 MHz frequency range, we present two eruptive filaments that manifest as radio dimmings (i.e., emission depressions). Simultaneously, portions of these eruptive filaments are discernible as dark features in the chromospheric images. The sun-as-a-star flux curves of brightness temperature, derived from the DART images, exhibit obvious radio dimmings. The dimming depths range from 1.5% to 8% of the background level and show a negative correlation with radio frequencies and a positive correlation with filament areas. Our investigation suggests that radio dimming is caused by free-free absorption during filament eruptions obscuring the solar corona. This may provide a new method for detecting stellar filament eruptions.
Key words: Sun: activity / Sun: corona / Sun: filaments / prominences / Sun: radio radiation
© The Authors 2025
 Open Access article, published by EDP Sciences, under the terms of the Creative Commons Attribution License (https://creativecommons.org/licenses/by/4.0), which permits unrestricted use, distribution, and reproduction in any medium, provided the original work is properly cited.
This article is published in open access under the Subscribe to Open model. This email address is being protected from spambots. You need JavaScript enabled to view it. to support open access publication.
1. Introduction
Solar filament eruptions have been extensively studied through observations in the extreme-ultraviolet (EUV) and Hα wavebands (e.g., Jiang et al. 2007; Nagashima et al. 2007; Li et al. 2008, 2011; Yan et al. 2011; Karpen et al. 2012; Xu et al. 2022; Lu et al. 2023; Wang et al. 2023a), as well as through magnetohydrodynamic simulations (e.g., Török & Kliem 2005; Yamasaki et al. 2022; Guo et al. 2023a,b). When a filament successfully erupts from the Sun, it evolves into a coronal mass ejection (CME, e.g., Zhou et al. 2006; Schrijver et al. 2008; Gosain et al. 2009; Chen et al. 2020a), which is the primary driver of solar storms that significantly affect the space environment throughout the Solar System. Conversely, if a filament eruption fails due to an interaction with overlying magnetic fields, it returns to the solar surface without producing a CME (e.g., Ji et al. 2003; Liu et al. 2009; Yang et al. 2014; Ding et al. 2022). Filament eruptions vary in scale, ranging from a few to thousands of megameters (e.g., Chen et al. 2020b; Madjarska et al. 2022; Qiu et al. 2024; Sun et al. 2024; Song et al. 2024; Wang et al. 2024a; Sterling et al. 2024), and they are often associated with other phenomena such as EUV waves (e.g., Zheng et al. 2020; Devi et al. 2022; Zhou et al. 2024) and type II radio bursts (e.g., Kouloumvakos et al. 2014; Duan et al. 2022). Magnetic reconnection plays a critical role in these eruptions (e.g., Lin & Forbes 2000; Xue et al. 2016; Hou et al. 2023; Wang et al. 2024b; Hou et al. 2024). Similar to the Sun, filament eruptions have also been found on other stars (e.g., Chen et al. 2022; Tian et al. 2023; Namekata et al. 2024; Lu et al. 2022, 2025). However, observational evidence for stellar filament eruptions and CMEs remains limited.
Solar filaments have also been observed in the millimeter and centimeter wavebands. In these wavebands, filaments exhibit a similar shape and position to those in Hα images but appear broader and longer (e.g., Hanaoka et al. 1994; Gopalswamy et al. 1996). Both quiescent and eruptive filaments manifest as emission depressions on the solar disk, while they appear as bright features above the solar optical limb (e.g., Gopalswamy & Hanaoka 1998; Hanaoka & Shinkawa 1999; Gopalswamy & Yashiro 2013). Studies have shown that eruptive filaments have an emission enhancement after the beginning of the eruptions in the images of the millimeter and centimeter wavebands (Hanaoka & Shinkawa 1999; Gopalswamy & Yashiro 2013). Grechnev et al. (2008) conducted a sun-as-a-star analysis of an eruptive filament and found radio dimming associated with the eruption in the 1−5 GHz frequency range. The dimming duration and depth increased toward lower frequencies. However, to our knowledge, in the meter and decimeter wavebands, only Marqué et al. (2001) and Marqué et al. (2002) have reported two events related to filament eruptions using imaging data taken by the Nançay Radioheliograph (NRH, Kerdraon & Delouis 1997), and they did not perform a detailed analysis of the emission depression in the radio images.
Using imaging data in the meter and decimeter wavebands from the DAocheng solar Radio Telescope (DART, Yan et al. 2023), we investigated two events of obscuration dimmings caused by filament eruptions. The sun-as-a-star flux curves in the frequency range of 150−450 MHz show a significant depression of brightness temperature (Tb) below the pre-eruption levels during the filament eruptions. This indicates that radio dimming in the meter and decimeter wavebands could be a useful tool for detecting stellar filament eruptions. We describe the observations in Section 2, explain the methodology of the analysis in Section 3, present the analysis results in Section 4, discuss the results in Section 5, and summarize our findings in Section 6.
2. Observations
The data used in this study were taken by DART, an instrument of the Meridian Project of China (Wang et al. 2024c) designed to detect solar radio emission from the high corona through imaging and spectral observations. DART detected two large filament eruptions originating from quiet Sun regions on 2024 March 17 and 2024 April 11, respectively. We analyzed DART imaging data in 16 wavebands (i.e., 149, 164, 190, 205, 223, 238, 285, 300, 309, 324, 366, 381, 399, 414, 432, and 447 MHz) within the frequency range of 150−450 MHz. The time cadences of the imaging observations for the events on 2024 March 17 and 2024 April 11 are 10 s and 3 minutes, respectively. The angular resolution of the radio images changes from ∼100″ at 447 MHz to ∼300″ at 149 MHz.
We also analyzed simultaneous observations from other instruments, including the Atmospheric Imaging Assembly (AIA, Lemen et al. 2012) on board the Solar Dynamics Observatory (SDO, Pesnell et al. 2012), the Solar Disk Imager (SDI) of the Lyman alpha (Lyα) Solar Telescope (LST, Li et al. 2019; Chen et al. 2024) on board the Advanced Space-based Solar Observatory (ASO-S, Gan et al. 2023) mission, and the Hα Imaging Spectrograph (HIS, Qiu et al. 2022) on board the Chinese Hα Solar Explorer (CHASE, Li et al. 2022). The AIA 304 Å images used to examine the eruptive filaments have a 12 s cadence and a 0.6″ pixel size. The SDI Lyα images that also recorded the eruptive filament have a time cadence of 3 minutes and a pixel size of 0.5″. We also analyzed CHASE Hα line-center images with a time cadence of 1−2 minutes and a pixel size of 1.0″ to identify the quiescent filaments prior to their eruptions.
3. Methodology
For this study, we analyzed two filament eruptions and the associated radio dimmings using the DART imaging data at 150−450 MHz. To conduct a detailed investigation, we performed a sun-as-a-star flux analysis across all wavebands.
3.1. Sun-as-a-star emission flux
Using radio images at a specific frequency, we calculated the sun-as-a-star flux curve (Ftotal(Tb)) by integrating the Tb values of all pixels within a circular region centered on the solar disk with a radius of 1300″ (marked by the solid green lines in Figures 1 and 2) at each observation time. To compare with a background, we defined the pre-eruption period as the time preceding the eruption. We used the average value from this period as the pre-eruption level of radio emission (Ftotal(Tb0)).
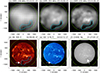 |
Fig. 1. Overview of the filament eruption on 2024 March 17. (a)–(c) DART images at 149 MHz, 300 MHz, and 432 MHz, respectively. (d)–(f) Images of the AIA 304 Å, SDI Lyα, and CHASE Hα line-center wavebands, respectively. The solid green lines outline the integration circle with a radius of 1300″ for obtaining the radio flux curves, while the dotted green lines indicate the solar optical limb in the Lyα waveband. The cyan contours in (a)–(e) outline the eruptive filament in the 432 MHz images. The white arrows in (d) and (e) indicate the dark regions associated with the eruptive filament, while the white arrow in (f) marks the quiescent filament before the eruption. An online animation illustrates the eruptive filament over a duration of ∼2 hours, from 02:01 UT to 03:58 UT. |
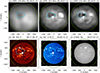 |
Fig. 2. Similar to Figure 1 but for the filament eruption on 2024 April 11. The box in (b) outlines a bright region covering several patches of plage areas. An online animation illustrates the eruptive filament over a duration of ∼3.5 hours, from 04:00 UT to 07:30 UT. |
Numerous spikes appear in the sun-as-a-star flux curves (Ftotal(Tb)). They are caused by the plage emission (see the bright region marked by the box in Figure 2) or other solar activities. To remove these spikes, we first applied a smoothing window of 30 minutes to the flux curves (Ftotal(Tb, smooth30)) and calculated the relative deviations between the smoothed and original flux curves through (Ftotal(Tb, smooth30) − Ftotal(Tb))/Ftotal(Tb0). Then, we excluded the observational times when the absolute values of the relative deviations exceed 0.01.
We then applied a smoothing window of 10 minutes to the despiked radio flux curves (Ftotal(Tb, smooth10)) to mitigate fluctuations in the flux curves. After dividing Ftotal(Tb, smooth10) by Ftotal(Tb0), we derived the temporal variations of the normalized total fluxes (Fnorm(Tb), see the green lines in Figure 3). For further analysis, we defined the dimming depth (see the vertical red lines in Figure 3) as the percentage decrease of the flux depression relative to the pre-eruption level by 1–Fnorm(Tb). Using the same method, we also calculated the temporal variations of the normalized AIA 304 Å intensity, but with an integration circle of 1200″ radius.
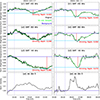 |
Fig. 3. Temporal evolution of the normalized sun-as-a-star fluxes. The black lines represent the original flux curves, while the green lines show the flux curves smoothed over a 10-minute interval. The vertical blue lines indicate the pre-eruption period, with the horizontal blue lines marking the pre-eruption levels. The cyan lines denote the minimum flux values, and the vertical red lines highlight the dimming depths. |
3.2. Identification of the eruptive filaments
For the subsequent analysis, we also examined the relationship between the dimming depth and the filament area. The DART 432 MHz images were used to measure the filament areas, as this waveband clearly captured the eruptive filaments. For each event, we enhanced the signal-to-noise ratio by applying a temporal smoothing window of 10 minutes to the 432 MHz radio images. A series of base-difference images were then produced by subtracting the background image from the smoothed images. To identify the filament regions, we applied a threshold value to the base-difference images. Examples of these filament regions are shown in Figures 1 and 2, marked by cyan contours. These contours outline the filament regions well across all frequencies, confirming that the filament pixels identified at 432 MHz can be used to measure the filament areas.
4. Results
Figures 1 and 2 provide an overview of these two filament eruptions. The eruptive filaments are clearly visible in the DART images, particularly at higher frequencies, where they appear as flux depressions both on the solar disk and slightly above the solar optical limb (also see the associated animations of Figures 1 and 2). The DART radio images at higher frequencies can reveal fine structures of the eruptive filament. For example, on 2024 April 11, two different components of the eruptive filament appear successively in the radio images at higher frequencies as seen in Figures 2b and 2c (also see the associated animations). Falling plasma following the second component near the foot of the eruptive filament is also detected in the radio images. These two events are not associated with obvious flares. Some dark structures related to the eruptive filaments, indicated by the white arrows in Figures 1d–e and 2d–e, are also detected in the AIA 304 Å and the SDI Lyα wavebands. This suggests that the eruptive filaments primarily consist of cool plasma that may not undergo heating during the eruption. The CHASE Hα line-center images reveal the pre-eruption filaments located in quiet Sun regions (see Figures 1h and 2h). The lengths of these quiescent filaments, as measured from the Hα line-center images, are 210−230 Mm. To identify the associated CMEs, we checked the coronagraph images from the JHelioviewer (Müller et al. 2017) taken by the Large Angle Spectroscopic Coronagraph (LASCO, Brueckner et al. 1995) on board the Solar and Heliospheric Observatory (SOHO, Thompson et al. 1998), and confirmed that both events are associated with a CME.
4.1. Sun-as-a-star dimming
The DART images and movies reveal radio dimmings caused by the eruptive filaments in the meter and decimeter wavebands. These radio dimmings are also evident in the sun-as-a-star flux curves, as explained in Section 3.1 and shown in Figure 3, where the normalized Tb values just after the eruptions fall below the pre-eruption levels. For the event on 2024 March 17 (2024 April 11), compared to the pre-eruption levels, the dimming depths at 432 MHz, 300 MHz, and 149 MHz were measured as 0.023 (0.045), 0.046 (0.05), and 0.082 (0.072), respectively. The radio dimmings have a larger dimming depth and last longer at lower frequencies. This trend is further illustrated in Figure 4, which shows the normalized radio dynamic spectra as a combination of the normalized sun-as-a-star flux curves across all frequencies.
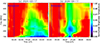 |
Fig. 4. DART radio dynamic spectra combining the normalized sun-as-a-star flux curves in the meter and decimeter wavebands. The blue lines mark the pre-eruption period. The flux curve at each frequency has been normalized to the corresponding pre-eruption level. |
As mentioned in Section 3.1, we also examined the sun-as-a-star flux curves in the AIA 304 Å waveband, shown in the bottom row of Figure 3. However, despite the presence of dark structures associated with the eruptive filaments in this waveband, the emission levels after the eruptions remain above the pre-eruption values. This could be attributed to the relatively weak obscuration of bright active regions by the eruptive filaments.
4.2. Relationship between the dimming depth and the radio frequency
Here, we analyze the relationship between dimming depths and radio frequencies, as shown in Figure 5. Figures 5a and 5b display scatter plots of the maximum dimming depths (Dmax) against the frequencies. We note that Dmax refers to the maximum dimming depth observed during the dimming period at each frequency and it appears to exhibit a negative correlation with frequency in the range of 150−450 MHz. For the event on 2024 March 17, the DART imaging data with a 3-minute time cadence were utilized. A power-law function, expressed as Dmax = a ⋅ fα + b, where f is the frequency in units of hertz, was applied to model the relationship between the maximum dimming depths and the frequencies. The correlation coefficient between Dmax and fα was maximized when the power-law index α was 0.3 for the 2024 March 17 event and 0.2 for the 2024 April 11 event.
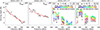 |
Fig. 5. Scatter plots illustrating the relationship between radio frequency and dimming depth. (a)–(b) Scatter plots for Dmax. The red lines indicate the linear fits between fα and Dmax. (c)–(d) Scatter plots for dimming depth over time. |
Figures 5c and 5d illustrate the relationship between dimming depths and frequencies over time. The relationships for both events are similar, showing a negative correlation between dimming depths and frequencies. The power-law index α varies from −0.4 to 1.3 for the 2024 March 17 event and from −0.7 to 2.2 for the 2024 April 11 event.
4.3. Evolution of the brightness temperature
To examine the Tb evolution in the eruptive filaments, we placed two cuts along the propagation paths of the filaments and generated the corresponding time-distance diagrams from the DART images at 432 MHz. The results are presented in Figure 6.
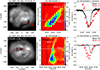 |
Fig. 6. Evolution of the normalized flux at 432 MHz. Left: DART 432 MHz images of the two eruptions. Middle: The time-distance diagrams along the cuts are shown in the left column. Right: Normalized flux variations along the slices indicated in the middle column. |
For the filament eruption on 2024 March 17, Cut A–B was placed along the propagation path of its western part. Figure 6b presents the resulting time-distance diagram, where the Tb value at each position was normalized to the pre-eruption level. The propagation of the eruptive filament is clearly visible in the time-distance diagram, with a velocity of ∼110 km s−1. Two slices were selected (indicated by the white lines in Figure 6b), and the variations of the normalized Tb along these slices are displayed in Figure 6c. The black line shows the Tb variation along slice-1 for a fixed pixel on the solar disk, revealing a rapid on-off-on pattern. At this fixed pixel, the Tb remains stable before the eruption, corresponding to the pre-eruption level. During the eruption, the eruptive filament moves quickly across this pixel, leading to a rapid Tb decrease and recovery. The Tb variation along slice-2 reveals a pattern similar to the sun-as-a-star flux curve. During the eruption, the Tb rapidly decreases to well below the pre-eruption level and gradually returns to the pre-eruption level. Figures 6d–f presents analogous results for the eruption on 2024 April 11. The Tb evolution in the eruptive filaments at other frequencies exhibits a similar behavior.
The upward ejecting and falling components of the eruptive filament on 2024 April 11 also appear in the time-distance diagram as shown in Figure 6e. These components were also captured by the AIA 304 Å images, but not as clear as in the radio images.
4.4. Relationship between the dimming depth and the filament area
We also analyzed the relationship between the dimming depths and filament areas for both events. First, we determined the filament areas during the eruptions using the method described in Section 3.2. For the 2024 March 17 event, data with a 3-minute cadence were utilized. The measured filament areas for both events are shown in Figures 7a and 7b, where the filament area can reach up to 13% of the solar disk area. Figures 7c and 7d present scatter plots illustrating the relationship between filament areas and dimming depths at different frequencies. The results indicate a positive correlation between dimming depths and filament areas for both events.
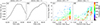 |
Fig. 7. Relationship between the filament area and dimming depth. (a)–(b) Temporal variations of the filament areas at 432 MHz. (c)–(d) Scatter plots between filament areas and dimming depths at different frequencies represented by different colors. The color bar illustrates the frequency variations. |
For the 2024 March 17 event, the filament areas exceeded 13% of the solar disk area between 03:05 and 03:27 UT. This period corresponds to the maximum dimming depths at higher frequencies (350–450 MHz), but it occurs before the maximum dimming depths at lower frequencies (150−200 MHz), as shown in Figure 4a. This suggests that the changes in the filament area may not be the sole factor influencing the variations of the dimming depths. For example, as mentioned in Section 3.1, bright regions (caused by plage regions or solar activities) within the integration circle in the radio images affects the measurements of the dimming depths. In addition, Figures 7c and 7d demonstrate that radio dimmings of these two events are observable in the sun-as-a-star flux curves when the expanding filaments occupy more than ∼2% of the solar disk area.
5. Discussion
In non-flaring regions of the solar corona, radio emission is primarily generated by free-free emission in the meter and decimeter wavebands. The optical depth τ for thermal electrons can be expressed as (e.g., Dulk 1985; Nindos 2020)
where κ is the free-free absorption coefficient, dlos is the line of sight (LOS) thickness of the source, ne is the electron number density, f is the frequency in units of hertz, and Te is the electron temperature. Here, we present two eruptive filaments observed in the DART imaging data in the meter and decimeter wavebands, covering a frequency range of 150−450 MHz. These wavebands image the solar corona. For one eruptive filament with ne ≈ 1010 cm−3, Te ≈ 8000 K, and dlos ≈ 50 Mm observed at 432 MHz, we got τ = 7.5 × 10⁵ ≫ 1, indicating that the filament is optically thick. In contrast, considering one coronal structure with ne ≈ 108 cm−3, Te ≈ 106 K, and dlos ≈ 50 Mm observed at 432 MHz, the coronal structure was found to be optically thin, as its τ was measured to be 0.054 ≪1. These results suggest that as the filament expands into the corona, and that it obscures and absorbs radio emission from the underlying corona. Meanwhile, the eruptive filament, composed of cooler and denser plasma, emits weakly, resulting in a flux depression in radio images across the 150−450 MHz frequency range. This process is referred to as free-free absorption. When the expanding filament occupies more than 2% of the solar disk area, radio dimming becomes detectable in the sun-as-a-star fluxes.
The optical depth is inversely proportional to the square of frequency, that is, τ ∼ f−2. For the lower frequency, it corresponds to a larger optical depth, suggesting that the imaged filament can be more efficient to obscure background emission at lower frequencies. This indicates that the variation of the optical depth across different frequencies may, to some extent, explain the negative relationship between the dimming depth and the frequency.
In this study, we present significant radio dimmings observed in both the imaging data and the sun-as-a-star flux curves in the 150−450 MHz frequency range. This is the first demonstration of radio dimming using the sun-as-a-star analysis in the meter and decimeter wavebands. Marqué et al. (2001) and Marqué et al. (2002) previously reported two eruptive filaments observed in this frequency range using NRH imaging data. However, they did not employ a sun-as-a-star analysis or examine the properties of the emission depression caused by the eruptive filaments.
Previous studies have reported quiescent and eruptive filaments and prominences in the millimeter and centimeter wavebands. These filaments typically appear as emission depressions on the solar disk but as bright features above the solar optical limb (e.g., Gopalswamy & Hanaoka 1998; Hanaoka & Shinkawa 1999; Gopalswamy & Yashiro 2013). While eruptive filaments have been observed to be heated during the eruptions, exhibiting an emission value higher than that of quiescent filaments (Hanaoka & Shinkawa 1999; Gopalswamy & Yashiro 2013), the eruptive filaments in our study display different characteristics. Specifically, they show no signs of heating and appear as depressions above the solar optical limb. Grechnev et al. (2008) conducted a sun-as-a-star analysis of an eruptive filament, identifying radio dimming in the 1−5 GHz frequency range. Similar to our findings, the duration and depth of the dimming increased toward lower frequencies.
Coronal dimmings are typically observed as reduced emission in the EUV and soft X-ray wavebands (e.g., Sterling & Hudson 1997; Zhou et al. 2003; McIntosh et al. 2007; Dissauer et al. 2018; Zhang & Zheng 2020; Chikunova et al. 2023; Wang et al. 2023b), and they are often interpreted as mass depletion caused by escaping CMEs (e.g., Hudson et al. 1996; Jin et al. 2009; Tian et al. 2012). Their chromospheric counterparts, such as Hα dimmings, have also been reported (Jiang et al. 2003, 2007). However, the radio dimmings observed in our study arise from a different mechanism. In this case, the eruptive filaments propagate across the solar disk and absorb background emission, a process known as obscuration dimming (Mason et al. 2014). This mechanism can occasionally produce dimming in sun-as-a-star fluxes in the AIA 304 Å waveband (Xu et al. 2024).
In our study, we found a positive correlation between the dimming depths and the filament areas. An additional factor affecting the variations of the dimming depths is opacity. This is because the absorption depth we observe is likely a trade-off between the filament’s expansion and its transparency changes. As the filament erupts, it expands and covers a larger region, causing stronger background absorption. On the other hand, the filament also grows less dense, changing its optical depth from τ ≫ 1 to τ ∼ 1 or < 1 and reducing absorption. Figure 8 illustrates the radio dimming linked to changes in the obscuration area (A), optical depth τ, and LOS depth dlos during the filament eruptions. For example, the sun-as-a-star flux curve (Fnorm(Tb)) at 324 MHz on 2024 March 17 is shown in Figure 8a, with five time markers (t0 − t4) corresponding to the changes of A, τ, and dlos depicted in Figures 8b–f. The flux enhancement after t0 is caused by the flare associated with the eruptive filament. At t0 in Figure 8b, prior to the eruption, τ is much less than one, indicating that the region is optically thin and allows for the capture of coronal emission (T0). At the onset of the eruption (t1 in Figure 8c), the eruptive filament expands into the corona with the obscuration area of A1. The filament density is high, and τ is much greater than one, rendering it optically thick. The thickness of the layerτ = 1 in the filament (dlos, τ = 1) equals d1, allowing us to observe a shallow region (see the green part in Figure 8c) beneath the upper layer of the filament with a filament temperature of T1 (≪T0). This observation corresponds to the brightness temperature at t1 in Figure 8a. At t2 in Figure 8d, the filament continues to expand with the obscuration area of A2 (> A1). The τ is still much greater than one, although the filament density decreases. However, dlos, τ = 1 increases to d2 due to the relationship  . Consequently, we can observe a deeper region within the filament with a brightness temperature of T2 (< T1), which corresponds to the brightness temperature at t2 in Figure 8a. At t3 in Figure 8e, the filament continues to expand with τ still much greater than one, and its density continues to decrease. Meanwhile, dlos, τ = 1 increases to d3, corresponding to the center of the filament with the lowest temperature T3. The obscuration area (A3) by the filament may have reached its maximum value at this time. These may contribute to the maximum dimming depth observed at t3 in Figure 8a. As time goes to t4, at the end of or after the eruption, the filament density has significantly decreased due to extensive expansion, and τ drops below 1.0 again. At this stage, we can observe a position below the filament with coronal emission, corresponding to t4 in Figure 8a. Furthermore, the process illustrated from Figures 8b–8f may also influence the variations of the brightness temperature as shown by the red symbols in Figures 6c and 6f. The variation of the optical depth from an optically thick regime to an optically thin one during a filament eruption is similar to the model results in the synthetic Lyα waveband by Zhao et al. (2022).
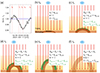 |
Fig. 8. Cartoon illustrating a possible connection between a radio dimming and filament eruption. (a) Evolution of the normalized flux at 324 MHz on 2024 March 17, representing both the sun-as-a-star flux curves in Figure 3 and the flux variations in the right column of Figure 6. In (a), the blue line marks the pre-eruption level. (b)–(f) The filament eruption process and the changes of the dlos, τ = 1 (indicated by the red arrows) and the obscuration area (A). The times t0–t4 correspond to the times shown in (a). In (b)–(f), “cor” and “fil” represent “corona” and “filament”, respectively. |
Filament eruptions are believed to occur frequently on other stars (e.g., Namekata et al. 2024). However, observational evidence for stellar filament eruptions and their associated CMEs remains limited (e.g., Chen et al. 2022; Lu et al. 2022, 2025). Conducting a radio dimming investigation with a sun-as-a-star analysis may offer a viable method for detecting stellar filament eruptions.
6. Summary
In the present paper, we present radio dimmings associated with two filament eruptions using the high-quality DART imaging observations in the meter and decimeter wavebands. These dimmings manifest as significant emission depressions in the radio images in the frequency range of 150−450 MHz. The observed radio dimmings are likely attributed to free-free absorption resulting from the obscuration of the solar corona by the eruptive filaments. Additionally, in the AIA 304 Å images, portions of the eruptive filaments appear as dark structures, indicating that they are predominantly composed of cool plasma.
The derived sun-as-a-star flux curves of the normalized brightness temperature across all frequencies also exhibit clear radio dimmings. The dimming depths range from 1.5% to 8% of the pre-eruption level and show a negative correlation with frequencies and a positive correlation with filament areas. In these two events, radio dimming becomes detectable in the sun-as-a-star flux curves when the eruptive filaments occupy more than 2% of the solar disk area. Our findings suggest that radio dimmings could serve as a new method for detecting stellar filament eruptions. However, whether this method can distinguish between successful and failed filament eruptions requires further investigation.
Data availability
Movies associated to Figs. 1 and 2 are available at https://www.aanda.org
Acknowledgments
This work was supported by the National Key R&D Program of China No. 2021YFA0718600, NSFC grants 12425301, 12250006, 12303057, and China Postdoctoral Science Foundation No. 2021M700246. H.C.C. was supported by NSFC grant 12103005. M.M. acknowledges DFG grant WI 3211/8-1 and 3211/8-2, project number 452856778, and was supported by the Brain Pool program funded by the Ministry of Science and ICT through the National Research Foundation of Korea (RS-2024-00408396). H.T. also acknowledges support from the New Cornerstone Science Foundation through the Xplorer Prize. The authors thank Peijin Zhang for useful discussions. AIA is an instrument onboard the Solar Dynamics Observatory, a mission for NASA’s Living With a Star program. CHASE mission is supported by the China National Space Administration. ASO-S mission is supported by the Strategic Priority Research Program on Space Science, the Chinese Academy of Sciences, Grant No. XDA15320000. We thank DART, SDO/AIA, CHASE, ASO-S, and SOHO/LASCO for providing data.
References
- Brueckner, G. E., Howard, R. A., Koomen, M. J., et al. 1995, Sol. Phys., 162, 357 [NASA ADS] [CrossRef] [Google Scholar]
- Chen, P.-F., Xu, A.-A., & Ding, M.-D. 2020a, RAA, 20, 166 [NASA ADS] [Google Scholar]
- Chen, H., Hong, J., Yang, B., Xu, Z., & Yang, J. 2020b, ApJ, 902, 8 [NASA ADS] [CrossRef] [Google Scholar]
- Chen, H., Tian, H., Li, H., et al. 2022, ApJ, 933, 92 [NASA ADS] [CrossRef] [Google Scholar]
- Chen, B., Feng, L., Zhang, G., et al. 2024, Sol. Phys., 299, 118 [NASA ADS] [CrossRef] [Google Scholar]
- Chikunova, G., Podladchikova, T., Dissauer, K., et al. 2023, A&A, 678, A166 [NASA ADS] [CrossRef] [EDP Sciences] [Google Scholar]
- Devi, P., Chandra, R., Awasthi, A. K., Schmieder, B., & Joshi, R. 2022, Sol. Phys., 297, 153 [NASA ADS] [CrossRef] [Google Scholar]
- Ding, T., Zhang, J., & Hong, J. 2022, ApJ, 933, L38 [NASA ADS] [CrossRef] [Google Scholar]
- Dissauer, K., Veronig, A. M., Temmer, M., Podladchikova, T., & Vanninathan, K. 2018, ApJ, 855, 137 [NASA ADS] [CrossRef] [Google Scholar]
- Duan, Y., Shen, Y., Zhou, X., et al. 2022, ApJ, 926, L39 [NASA ADS] [CrossRef] [Google Scholar]
- Dulk, G. A. 1985, ARA&A, 23, 169 [Google Scholar]
- Gan, W., Zhu, C., Deng, Y., et al. 2023, Sol. Phys., 298, 68 [NASA ADS] [CrossRef] [Google Scholar]
- Gopalswamy, N., & Hanaoka, Y. 1998, ApJ, 498, L179 [NASA ADS] [CrossRef] [Google Scholar]
- Gopalswamy, N., & Yashiro, S. 2013, PASJ, 65, S11 [NASA ADS] [CrossRef] [Google Scholar]
- Gopalswamy, N., Kundu, M. R., Hanaoka, Y., et al. 1996, New Astron., 1, 207 [NASA ADS] [CrossRef] [Google Scholar]
- Gosain, S., Schmieder, B., Venkatakrishnan, P., Chandra, R., & Artzner, G. 2009, Sol. Phys., 259, 13 [NASA ADS] [CrossRef] [Google Scholar]
- Grechnev, V. V., Uralov, A. M., Slemzin, V. A., et al. 2008, Sol. Phys., 253, 263 [NASA ADS] [CrossRef] [Google Scholar]
- Guo, J. H., Ni, Y. W., Zhong, Z., et al. 2023a, ApJS, 266, 3 [NASA ADS] [CrossRef] [Google Scholar]
- Guo, Y., Guo, J., Ni, Y., et al. 2023b, ApJ, 958, 25 [NASA ADS] [CrossRef] [Google Scholar]
- Hanaoka, Y., & Shinkawa, T. 1999, ApJ, 510, 466 [NASA ADS] [CrossRef] [Google Scholar]
- Hanaoka, Y., Kurokawa, H., Enome, S., et al. 1994, PASJ, 46, 205 [NASA ADS] [Google Scholar]
- Hou, Y., Li, C., Li, T., et al. 2023, ApJ, 959, 69 [NASA ADS] [CrossRef] [Google Scholar]
- Hou, Z., Tian, H., Madjarska, M. S., et al. 2024, A&A, 687, A190 [NASA ADS] [CrossRef] [EDP Sciences] [Google Scholar]
- Hudson, H. S., Lemen, J. R., & Webb, D. F. 1996, ASP Conf. Ser., 111, 379 [NASA ADS] [Google Scholar]
- Ji, H., Wang, H., Schmahl, E. J., Moon, Y. J., & Jiang, Y. 2003, ApJ, 595, L135 [NASA ADS] [CrossRef] [Google Scholar]
- Jiang, Y., Ji, H., Wang, H., & Chen, H. 2003, ApJ, 597, L161 [NASA ADS] [CrossRef] [Google Scholar]
- Jiang, Y., Chen, H., Shen, Y., Yang, L., & Li, K. 2007, Sol. Phys., 240, 77 [NASA ADS] [CrossRef] [Google Scholar]
- Jin, M., Ding, M. D., Chen, P. F., Fang, C., & Imada, S. 2009, ApJ, 702, 27 [Google Scholar]
- Karpen, J. T., Antiochos, S. K., & DeVore, C. R. 2012, ApJ, 760, 81 [NASA ADS] [CrossRef] [Google Scholar]
- Kerdraon, A., & Delouis, J. M. 1997, in Coronal Physics from Radio and Space Observations, ed. G. Trottet, 483, 192 [Google Scholar]
- Kouloumvakos, A., Patsourakos, S., Hillaris, A., et al. 2014, Sol. Phys., 289, 2123 [NASA ADS] [CrossRef] [Google Scholar]
- Lemen, J. R., Title, A. M., Akin, D. J., et al. 2012, Sol. Phys., 275, 17 [Google Scholar]
- Li, Y., Lynch, B. J., Stenborg, G., et al. 2008, ApJ, 681, L37 [NASA ADS] [CrossRef] [Google Scholar]
- Li, T., Zhang, J., Zhang, Y., & Yang, S. 2011, ApJ, 739, 43 [CrossRef] [Google Scholar]
- Li, H., Chen, B., Feng, L., et al. 2019, RAA, 19, 158 [Google Scholar]
- Li, C., Fang, C., Li, Z., et al. 2022, Sci. China Phys. Mech. Astron., 65, 289602 [NASA ADS] [CrossRef] [Google Scholar]
- Lin, J., & Forbes, T. G. 2000, J. Geophys. Res., 105, 2375 [Google Scholar]
- Liu, Y., Su, J., Xu, Z., et al. 2009, ApJ, 696, L70 [NASA ADS] [CrossRef] [Google Scholar]
- Lu, H.-P., Tian, H., Zhang, L.-Y., et al. 2022, A&A, 663, A140 [NASA ADS] [CrossRef] [EDP Sciences] [Google Scholar]
- Lu, H.-P., Tian, H., Chen, H.-C., et al. 2023, ApJ, 953, 68 [NASA ADS] [CrossRef] [Google Scholar]
- Lu, H.-P., Tian, H., Zhang, L.-Y., et al. 2025, ApJ, 978, L32 [NASA ADS] [CrossRef] [Google Scholar]
- Madjarska, M. S., Mackay, D. H., Galsgaard, K., Wiegelmann, T., & Xie, H. 2022, A&A, 660, A45 [NASA ADS] [CrossRef] [EDP Sciences] [Google Scholar]
- Marqué, C., Lantos, P., Klein, K. L., & Delouis, J. M. 2001, A&A, 374, 316 [NASA ADS] [CrossRef] [EDP Sciences] [Google Scholar]
- Marqué, C., Lantos, P., & Delaboudinière, J. P. 2002, A&A, 387, 317 [NASA ADS] [CrossRef] [EDP Sciences] [Google Scholar]
- Mason, J. P., Woods, T. N., Caspi, A., Thompson, B. J., & Hock, R. A. 2014, ApJ, 789, 61 [NASA ADS] [CrossRef] [Google Scholar]
- McIntosh, S. W., Leamon, R. J., Davey, A. R., & Wills-Davey, M. J. 2007, ApJ, 660, 1653 [NASA ADS] [CrossRef] [Google Scholar]
- Müller, D., Nicula, B., Felix, S., et al. 2017, A&A, 606, A10 [Google Scholar]
- Nagashima, K., Isobe, H., Yokoyama, T., et al. 2007, ApJ, 668, 533 [NASA ADS] [CrossRef] [Google Scholar]
- Namekata, K., Airapetian, V. S., Petit, P., et al. 2024, ApJ, 961, 23 [Google Scholar]
- Nindos, A. 2020, Front. Astron. Space Sci., 7, 57 [NASA ADS] [CrossRef] [Google Scholar]
- Pesnell, W. D., Thompson, B. J., & Chamberlin, P. C. 2012, Sol. Phys., 275, 3 [Google Scholar]
- Qiu, Y., Rao, S., Li, C., et al. 2022, Sci. China Phys. Mech. Astron., 65, 289603 [NASA ADS] [CrossRef] [Google Scholar]
- Qiu, Y., Li, C., Guo, Y., et al. 2024, ApJ, 961, L30 [NASA ADS] [CrossRef] [Google Scholar]
- Schrijver, C. J., Elmore, C., Kliem, B., Török, T., & Title, A. M. 2008, ApJ, 674, 586 [NASA ADS] [CrossRef] [Google Scholar]
- Song, Y., Su, J., Zhang, Q., et al. 2024, Sol. Phys., 299, 85 [NASA ADS] [CrossRef] [Google Scholar]
- Sterling, A. C., & Hudson, H. S. 1997, ApJ, 491, L55 [Google Scholar]
- Sterling, A. C., Moore, R. L., & Panesar, N. K. 2024, ArXiv e-prints [arXiv:2410.01123] [Google Scholar]
- Sun, Z., Tian, H., Li, T., Liu, R., & Duan, Y. 2024, ApJ, 974, 205 [NASA ADS] [CrossRef] [Google Scholar]
- Thompson, B. J., Plunkett, S. P., Gurman, J. B., et al. 1998, Geophys. Res. Lett., 25, 2465 [Google Scholar]
- Tian, H., McIntosh, S. W., Xia, L., He, J., & Wang, X. 2012, ApJ, 748, 106 [NASA ADS] [CrossRef] [Google Scholar]
- Tian, H., Xu, Y., Chen, H., et al. 2023, Scientia Sinica Technologica, 53, 2021 [NASA ADS] [CrossRef] [Google Scholar]
- Török, T., & Kliem, B. 2005, ApJ, 630, L97 [Google Scholar]
- Wang, X., Song, H., Chen, Y., et al. 2023a, ApJ, 957, 58 [NASA ADS] [CrossRef] [Google Scholar]
- Wang, R., Liu, Y. D., Zhao, X., & Hu, H. 2023b, ApJ, 952, L29 [NASA ADS] [CrossRef] [Google Scholar]
- Wang, J., Lee, J., Chae, J., Cao, W., & Wang, H. 2024a, ApJ, 974, 123 [NASA ADS] [CrossRef] [Google Scholar]
- Wang, J., Yan, X., Cai, Q., et al. 2024b, A&A, 684, A14 [NASA ADS] [CrossRef] [EDP Sciences] [Google Scholar]
- Wang, C., Xu, J., Chen, Z., et al. 2024c, Space Weather, 22, e2024SW003972 [NASA ADS] [CrossRef] [Google Scholar]
- Xu, Y., Tian, H., Hou, Z., et al. 2022, ApJ, 931, 76 [NASA ADS] [CrossRef] [Google Scholar]
- Xu, Y., Tian, H., Veronig, A. M., & Dissauer, K. 2024, ApJ, 970, 60 [NASA ADS] [CrossRef] [Google Scholar]
- Xue, Z., Yan, X., Cheng, X., et al. 2016, Nat. Commun., 7, 11837 [Google Scholar]
- Yamasaki, D., Inoue, S., Bamba, Y., Lee, J., & Wang, H. 2022, ApJ, 940, 119 [NASA ADS] [CrossRef] [Google Scholar]
- Yan, X. L., Qu, Z. Q., & Kong, D. F. 2011, MNRAS, 414, 2803 [NASA ADS] [CrossRef] [Google Scholar]
- Yan, J., Wu, J., Wu, L., et al. 2023, Nat. Astron., 7, 750 [NASA ADS] [CrossRef] [Google Scholar]
- Yang, S., Zhang, J., Liu, Z., & Xiang, Y. 2014, ApJ, 784, L36 [NASA ADS] [CrossRef] [Google Scholar]
- Zhang, Q. M., & Zheng, R. S. 2020, A&A, 633, A142 [EDP Sciences] [Google Scholar]
- Zhao, J., Zhang, P., Gibson, S. E., et al. 2022, A&A, 665, A39 [NASA ADS] [CrossRef] [EDP Sciences] [Google Scholar]
- Zheng, R., Chen, Y., Wang, B., & Song, H. 2020, ApJ, 894, 139 [NASA ADS] [CrossRef] [Google Scholar]
- Zhou, G., Wang, J., & Cao, Z. 2003, A&A, 397, 1057 [NASA ADS] [CrossRef] [EDP Sciences] [Google Scholar]
- Zhou, G. P., Wang, J. X., Zhang, J., et al. 2006, ApJ, 651, 1238 [NASA ADS] [CrossRef] [Google Scholar]
- Zhou, X., Shen, Y., Yan, Y., et al. 2024, ApJ, 968, 85 [NASA ADS] [CrossRef] [Google Scholar]
All Figures
|
Fig. 1. Overview of the filament eruption on 2024 March 17. (a)–(c) DART images at 149 MHz, 300 MHz, and 432 MHz, respectively. (d)–(f) Images of the AIA 304 Å, SDI Lyα, and CHASE Hα line-center wavebands, respectively. The solid green lines outline the integration circle with a radius of 1300″ for obtaining the radio flux curves, while the dotted green lines indicate the solar optical limb in the Lyα waveband. The cyan contours in (a)–(e) outline the eruptive filament in the 432 MHz images. The white arrows in (d) and (e) indicate the dark regions associated with the eruptive filament, while the white arrow in (f) marks the quiescent filament before the eruption. An online animation illustrates the eruptive filament over a duration of ∼2 hours, from 02:01 UT to 03:58 UT. |
| In the text | |
|
Fig. 2. Similar to Figure 1 but for the filament eruption on 2024 April 11. The box in (b) outlines a bright region covering several patches of plage areas. An online animation illustrates the eruptive filament over a duration of ∼3.5 hours, from 04:00 UT to 07:30 UT. |
| In the text | |
|
Fig. 3. Temporal evolution of the normalized sun-as-a-star fluxes. The black lines represent the original flux curves, while the green lines show the flux curves smoothed over a 10-minute interval. The vertical blue lines indicate the pre-eruption period, with the horizontal blue lines marking the pre-eruption levels. The cyan lines denote the minimum flux values, and the vertical red lines highlight the dimming depths. |
| In the text | |
|
Fig. 4. DART radio dynamic spectra combining the normalized sun-as-a-star flux curves in the meter and decimeter wavebands. The blue lines mark the pre-eruption period. The flux curve at each frequency has been normalized to the corresponding pre-eruption level. |
| In the text | |
|
Fig. 5. Scatter plots illustrating the relationship between radio frequency and dimming depth. (a)–(b) Scatter plots for Dmax. The red lines indicate the linear fits between fα and Dmax. (c)–(d) Scatter plots for dimming depth over time. |
| In the text | |
|
Fig. 6. Evolution of the normalized flux at 432 MHz. Left: DART 432 MHz images of the two eruptions. Middle: The time-distance diagrams along the cuts are shown in the left column. Right: Normalized flux variations along the slices indicated in the middle column. |
| In the text | |
|
Fig. 7. Relationship between the filament area and dimming depth. (a)–(b) Temporal variations of the filament areas at 432 MHz. (c)–(d) Scatter plots between filament areas and dimming depths at different frequencies represented by different colors. The color bar illustrates the frequency variations. |
| In the text | |
|
Fig. 8. Cartoon illustrating a possible connection between a radio dimming and filament eruption. (a) Evolution of the normalized flux at 324 MHz on 2024 March 17, representing both the sun-as-a-star flux curves in Figure 3 and the flux variations in the right column of Figure 6. In (a), the blue line marks the pre-eruption level. (b)–(f) The filament eruption process and the changes of the dlos, τ = 1 (indicated by the red arrows) and the obscuration area (A). The times t0–t4 correspond to the times shown in (a). In (b)–(f), “cor” and “fil” represent “corona” and “filament”, respectively. |
| In the text | |
Current usage metrics show cumulative count of Article Views (full-text article views including HTML views, PDF and ePub downloads, according to the available data) and Abstracts Views on Vision4Press platform.
Data correspond to usage on the plateform after 2015. The current usage metrics is available 48-96 hours after online publication and is updated daily on week days.
Initial download of the metrics may take a while.