Fig. 1.
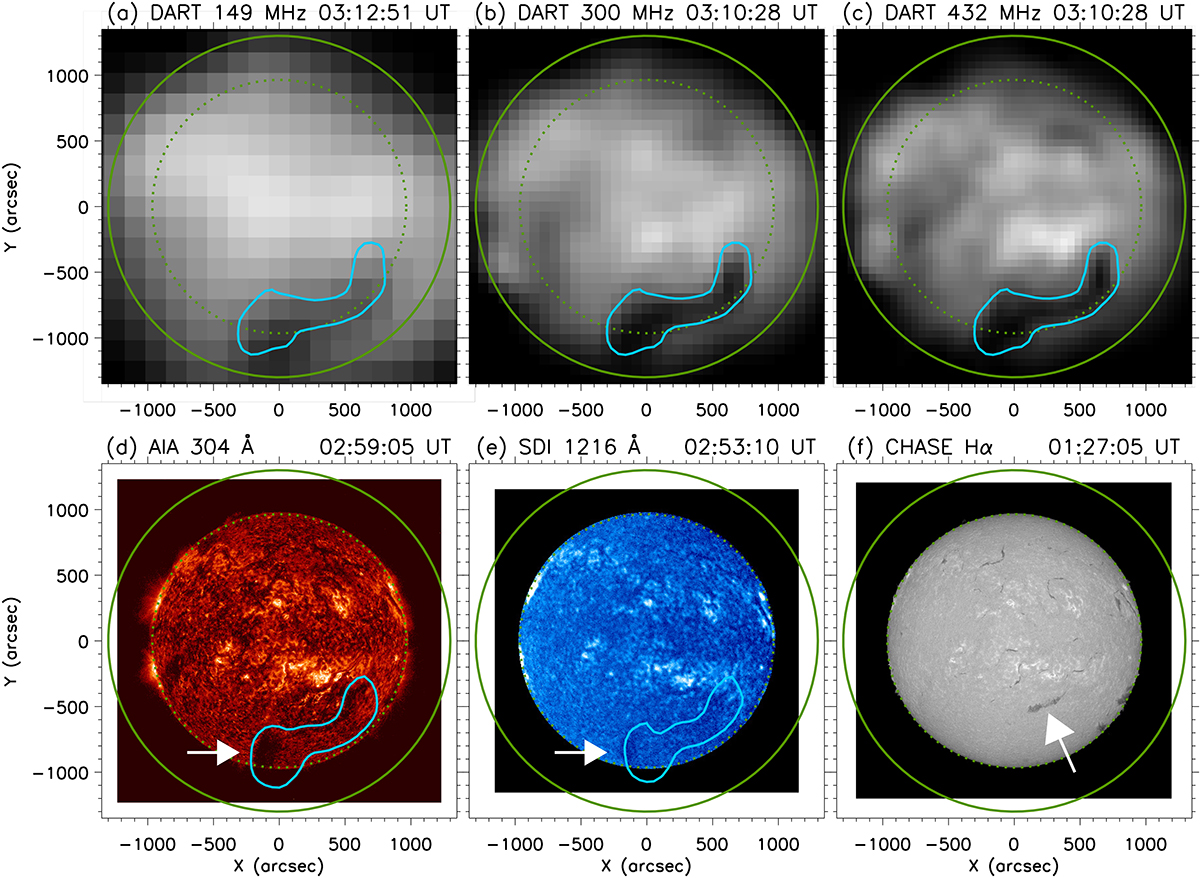
Download original image
Overview of the filament eruption on 2024 March 17. (a)–(c) DART images at 149 MHz, 300 MHz, and 432 MHz, respectively. (d)–(f) Images of the AIA 304 Å, SDI Lyα, and CHASE Hα line-center wavebands, respectively. The solid green lines outline the integration circle with a radius of 1300″ for obtaining the radio flux curves, while the dotted green lines indicate the solar optical limb in the Lyα waveband. The cyan contours in (a)–(e) outline the eruptive filament in the 432 MHz images. The white arrows in (d) and (e) indicate the dark regions associated with the eruptive filament, while the white arrow in (f) marks the quiescent filament before the eruption. An online animation illustrates the eruptive filament over a duration of ∼2 hours, from 02:01 UT to 03:58 UT.
Current usage metrics show cumulative count of Article Views (full-text article views including HTML views, PDF and ePub downloads, according to the available data) and Abstracts Views on Vision4Press platform.
Data correspond to usage on the plateform after 2015. The current usage metrics is available 48-96 hours after online publication and is updated daily on week days.
Initial download of the metrics may take a while.