Open Access
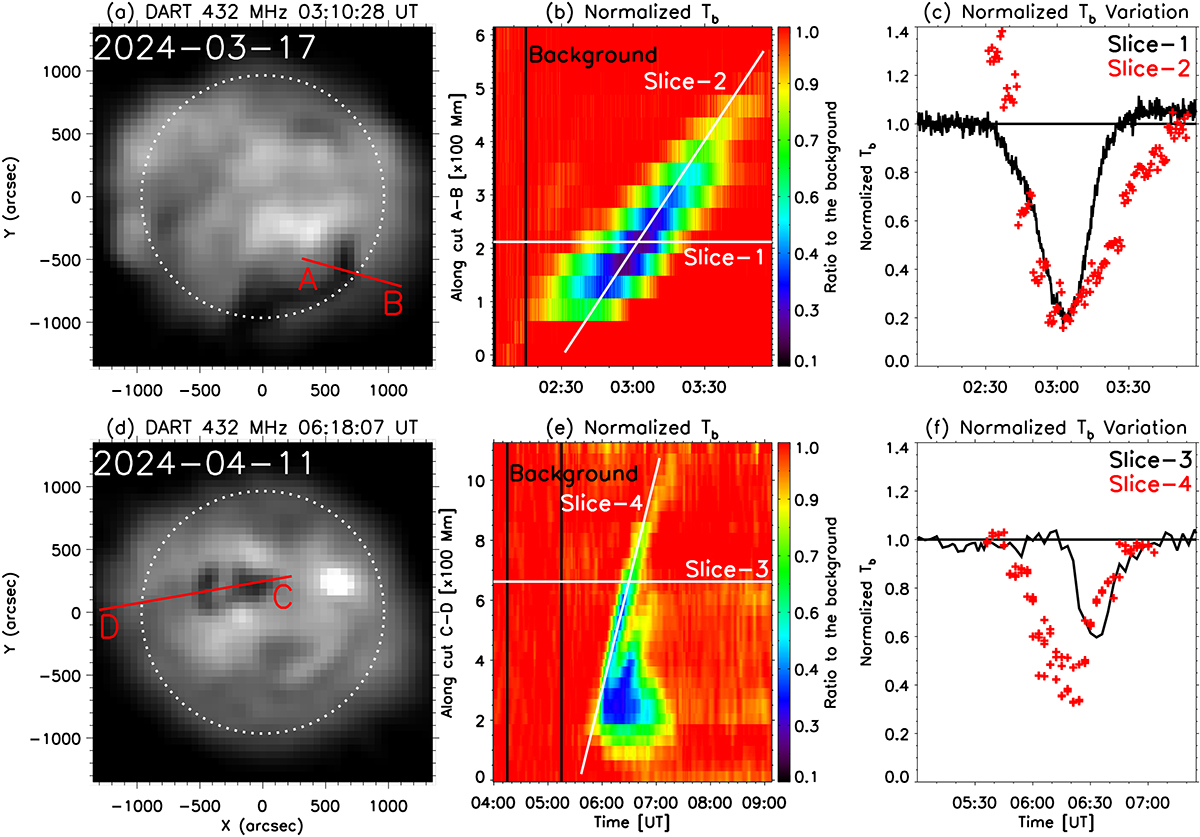
Fig. 6.
Download original image
Evolution of the normalized flux at 432 MHz. Left: DART 432 MHz images of the two eruptions. Middle: The time-distance diagrams along the cuts are shown in the left column. Right: Normalized flux variations along the slices indicated in the middle column.
Current usage metrics show cumulative count of Article Views (full-text article views including HTML views, PDF and ePub downloads, according to the available data) and Abstracts Views on Vision4Press platform.
Data correspond to usage on the plateform after 2015. The current usage metrics is available 48-96 hours after online publication and is updated daily on week days.
Initial download of the metrics may take a while.