Fig. 8.
Download original image
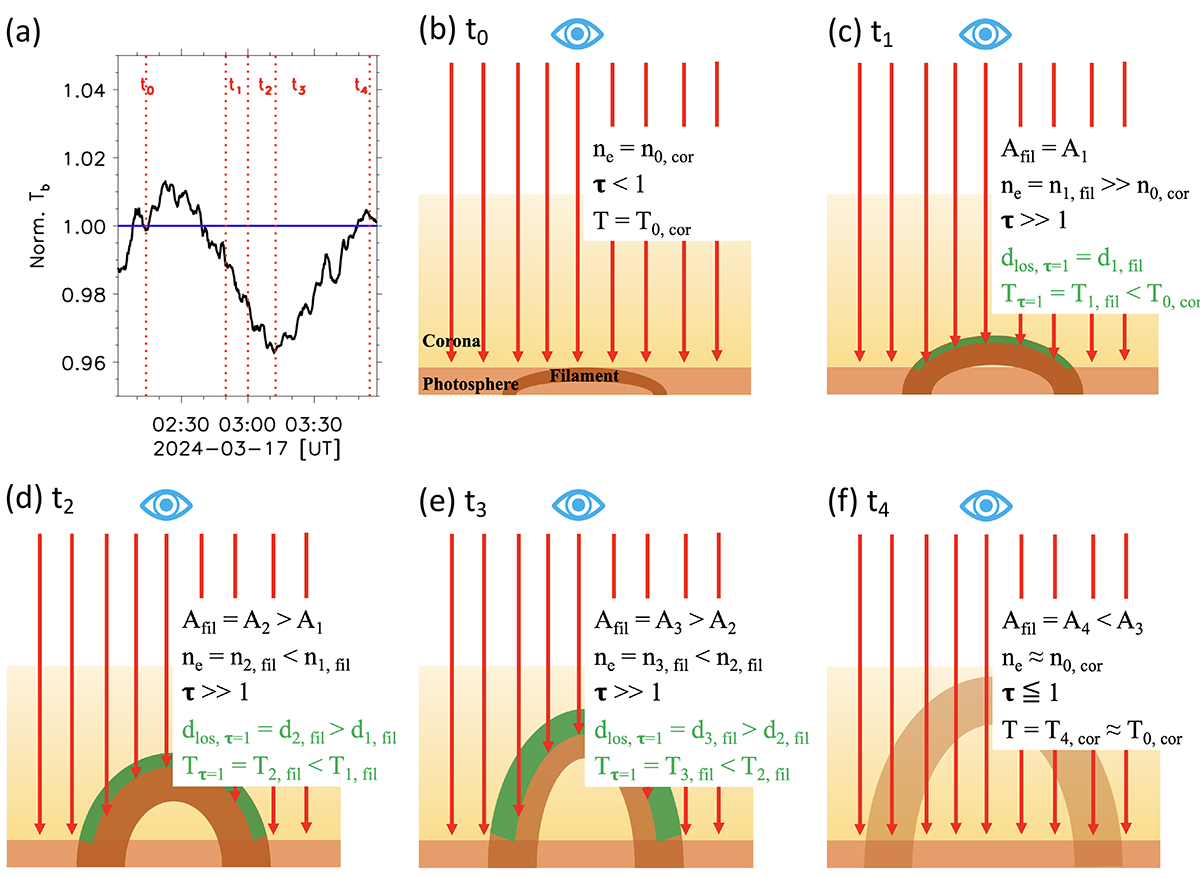
Cartoon illustrating a possible connection between a radio dimming and filament eruption. (a) Evolution of the normalized flux at 324 MHz on 2024 March 17, representing both the sun-as-a-star flux curves in Figure 3 and the flux variations in the right column of Figure 6. In (a), the blue line marks the pre-eruption level. (b)–(f) The filament eruption process and the changes of the dlos, τ = 1 (indicated by the red arrows) and the obscuration area (A). The times t0–t4 correspond to the times shown in (a). In (b)–(f), “cor” and “fil” represent “corona” and “filament”, respectively.
Current usage metrics show cumulative count of Article Views (full-text article views including HTML views, PDF and ePub downloads, according to the available data) and Abstracts Views on Vision4Press platform.
Data correspond to usage on the plateform after 2015. The current usage metrics is available 48-96 hours after online publication and is updated daily on week days.
Initial download of the metrics may take a while.