Fig. 3.
Download original image
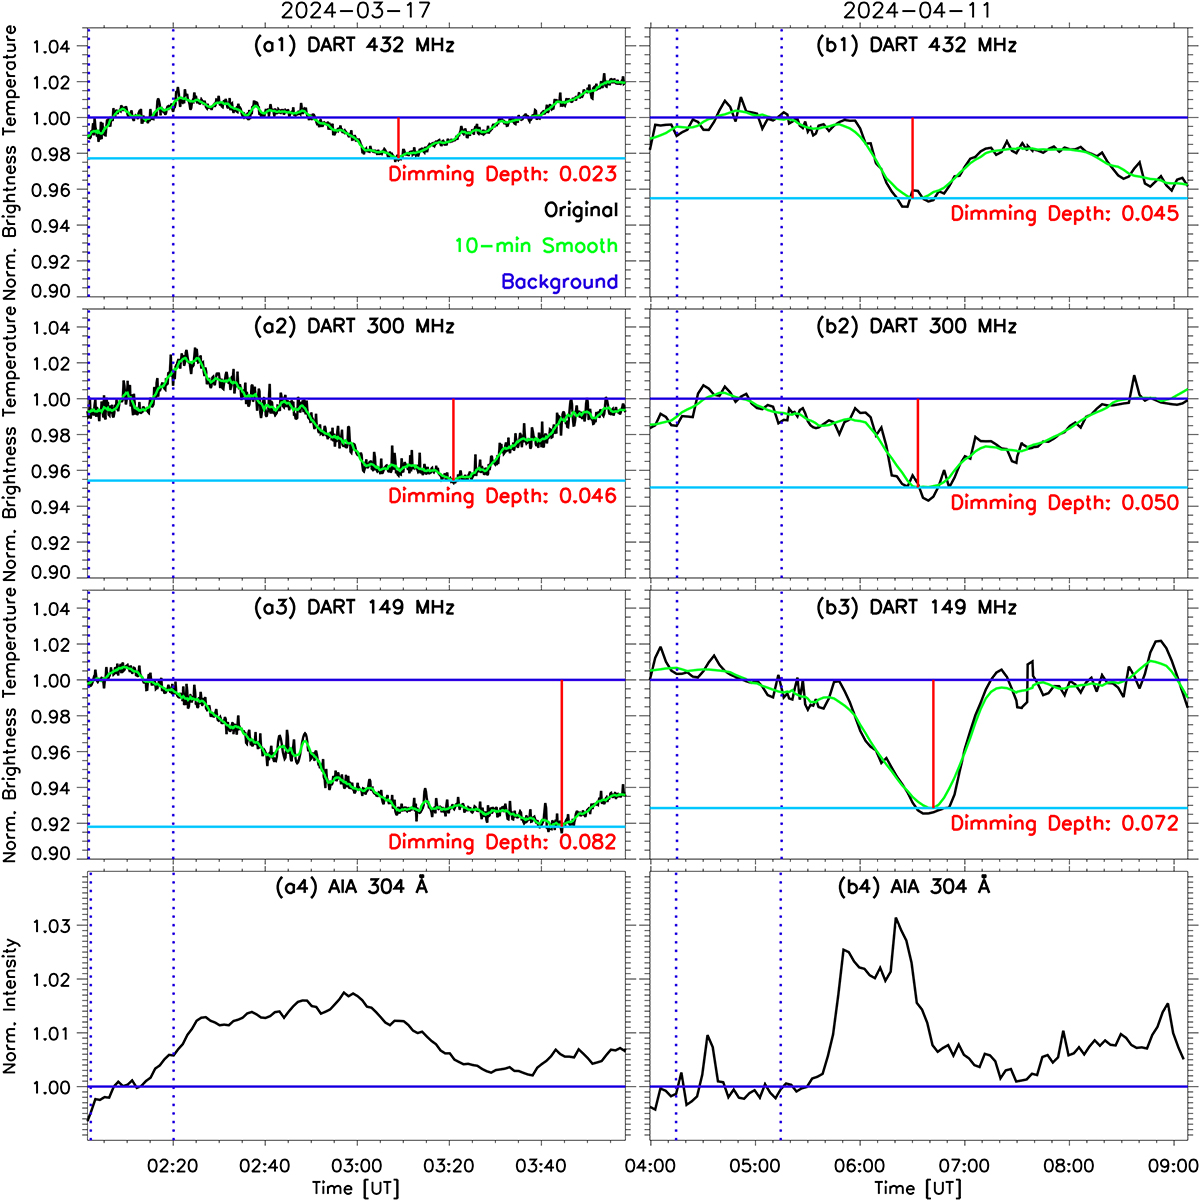
Temporal evolution of the normalized sun-as-a-star fluxes. The black lines represent the original flux curves, while the green lines show the flux curves smoothed over a 10-minute interval. The vertical blue lines indicate the pre-eruption period, with the horizontal blue lines marking the pre-eruption levels. The cyan lines denote the minimum flux values, and the vertical red lines highlight the dimming depths.
Current usage metrics show cumulative count of Article Views (full-text article views including HTML views, PDF and ePub downloads, according to the available data) and Abstracts Views on Vision4Press platform.
Data correspond to usage on the plateform after 2015. The current usage metrics is available 48-96 hours after online publication and is updated daily on week days.
Initial download of the metrics may take a while.