| Issue |
A&A
Volume 694, February 2025
|
|
|---|---|---|
| Article Number | C1 | |
| Number of page(s) | 5 | |
| Section | Extragalactic astronomy | |
| DOI | https://doi.org/10.1051/0004-6361/202453513e | |
| Published online | 04 February 2025 | |
Clumpy star formation and an obscured nuclear starburst in the luminous dusty z = 4 galaxy GN20 seen by MIRI/JWST (Corrigendum)
1
Department of Astronomy, Stockholm University, Oscar Klein Centre, AlbaNova University Centre, 106 91 Stockholm, Sweden
2
Centro de Astrobiología (CAB), CSIC-INTA, Ctra. de Ajalvir km 4, Torrejón de Ardoz, E-28850 Madrid, Spain
3
I. Physikalisches Institut der Universität zu Köln, Zülpicher Str. 77, 50937 Köln, Germany
4
Max-Planck-Institut für Astronomie, Königstuhl 17, 69117 Heidelberg, Germany
5
DTU Space, Technical University of Denmark, Elektrovej 327, 2800 Kgs. Lyngby, Denmark
6
Cosmic Dawn Centre (DAWN), Copenhagen, Denmark
7
Department of Physics and Astronomy, University College London, Gower Place, London WC1E 6BT, UK
8
UK Astronomy Technology Centre, Royal Observatory Edinburgh, Blackford Hill, Edinburgh EH9 3HJ, UK
9
, Camino Viejo del Castillo s/n, 28692 Villanueva de la Cañada, Madrid, Spain
10
Kapteyn Astronomical Institute, University of Groningen, PO Box 800 9700 AV Groningen, The Netherlands
11
DARK, Niels Bohr Institute, University of Copenhagen, Jagtvej 128, 2200 Copenhagen, Denmark
12
Telespazio UK for the European Space Agency, ESAC, Camino Bajo del Castillo s/n, 28692 Villanueva de la Cañada, Spain
13
School of Physics & Astronomy, Space Park Leicester, University of Leicster, 92 Corporation Road, Leicester LE4 5SP, UK
14
Leiden Observatory, Leiden University, PO Box 9513 2300 RA Leiden, The Netherlands
15
University of Vienna, Department of Astrophysics, Türkenschanzstrasse 17, 1180 Vienna, Austria
16
Institute of Particle Physics and Astrophysics, ETH Zurich, Wolfgang-Pauli-Str 27, 8093 Zurich, Switzerland
17
Université Paris-Saclay, Université Paris Cité, CEA, CNRS, AIM, F-91191 Gif-sur-Yvette, France
18
Dublin Institute for Advanced Studies, Astronomy & Astrophysics Section, 31 Fitzwilliam Place, Dublin D02 XF86, Ireland
⋆ Corresponding author; This email address is being protected from spambots. You need JavaScript enabled to view it.
Key words: galaxies: high-redshift / galaxies: ISM / galaxies: individual: GN20 / galaxies: kinematics and dynamics / galaxies: starburst / errata, addenda
1. Introduction
We report an error in the calibration of the MIRI/MRS spectra in Bik et al. (2024). The performed background subtraction resulted in an over-subtraction of the Paα flux. In this erratum we present the re-calibrated data and update the quantities derived from it. The qualitative description, discussion, and conclusions of the original paper do not change.
2. Calibration
In the original paper, the background frame was created by median averaging the object and sky frames. In contrast to what was stated in Bik et al. (2024), the extended source dither pattern of the MRS observations results in flux losses for the Paα emission line, consistent with the findings of Hsiao et al. (2024).
We recalibrated the MIRI/MRS data by only using the (shallower) background observations to create the master background. We also upgraded the JWST calibration pipeline to version 1.16.1 (Bushouse et al. 2023) and used context 1298 of the Calibration Reference Data System (CRDS). The resulting reduced datacube reveals brighter Paα emission. Therefore, all the figures of Bik et al. (2024) have been updated, as well as several quantities measured from the observed Paα spectroscopy.
3. Changed quantities
3.1. Integrated Paα spectrum
The integrated Paα spectrum of GN20 is shown in Fig. 1. To measure the redshift of GN20 from the Paα emission, we fit a single Gaussian profile to the new integrated spectrum (Fig. 1), by fixing the width of the emission line to 300 km s−1, following Hodge et al. (2012). We find zPaα = 4.0557 ± 0.0006, within 1σ from the value derived from the CO(2−1) observations by Carilli et al. (2011). For consistency with the literature, we use z = 4.0548 throughout the paper.
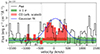 |
Fig. 1. Integrated spectrum of GN20 centered on Paα. Plotted in green is the standard deviation derived from a background aperture of the same size as the galaxy spectrum. The spectrum plotted in red shows the CO(2−1) emission extracted from the data presented in Hodge et al. (2012); overplotted in blue is the single Gaussian fit to derive the redshift (see text). The systemic velocity corresponds to a redshift of z = 4.0548 (Carilli et al. 2011). |
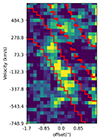 |
Fig. 2. Position-velocity diagram of Paα along the major axis of the galaxy (PA = 25°). The offset is relative to the position of the bright nucleus of GN20 (Colina et al. 2023). The red solid lines show the extraction apertures used for creating the Paα emission line map, while the dashed red lines show the corresponding background map from which we derived the error on the emission line map. |
3.2. RMS emission line maps
The new Paα emission line map is shown in Figure 3, showing a similar clumpy spatial distribution as in Bik et al. (2024). Figure 4 shows the comparison between the Paα linemap and the auxiliary data used in the paper. We derived the error on the detected Paα flux by measuring the standard deviation in a large aperture in the “background” image as described in Bik et al. (2024). For the Paα line map, we find the standard deviation of the background image to be 1.89 × 10⁻¹⁹ erg s−1 cm−2 per pixel, integrated over nine wavelength elements. This would translate to a 3σ detection limit in an extraction aperture equal to the FWHM of the PSF (0.37″) of 2.1 × 10⁻¹⁸ erg s−1 cm−2.
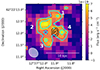 |
Fig. 3. Paα emission line map after extraction based on the PV diagram (Fig. 2, see text). The 2σ, 3σ, and 4σ contours are shown in cyan. The black contours show the bright nucleus of GN20 detected in the F560W image (Colina et al. 2023). The MRS point spread function at 9.47 μm is displayed as a gray ellipse. The PSF is slightly asymmetric and the size shows the FWHM in the α (x) and β (y) direction, rotated according to the observed position angle. The four clumps discussed in Sect. 3.4 are annotated. |
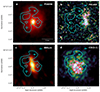 |
Fig. 4. Multiwavelength comparison of GN20 with the Paα emission line map (cyan contours). a: F560W (rest-frame 1.1 μm) image from Colina et al. (2023), b: HST/ACS F814W (rest-frame 0.15 μm) image, c: 880 μm (rest-frame 160 μm) image from Hodge et al. (2015), and d: CO(2−1) emission from Hodge et al. (2012). The red circles show the position of the five CO clumps identified by Hodge et al. (2012). |
For Paβ, we derived a standard deviation of 2.58 × 10⁻¹⁹ erg s−1 cm−2 per pixel, translating to a 3σ detection limit in an aperture equal to the FWHM (0.3″) of the PSF of 3.2 × 10⁻¹⁸ erg s−1 cm−2. For the other potential emission lines, we derive the standard deviation in the same way and find 3σ detection limits of 1.9 × 10⁻¹⁸ erg s−1 cm−2 for [SiVI] and 2.3 × 10⁻¹⁸ erg s−1 cm−2 for both the H2 lines.
3.3. Integrated star formation rate
We recalculated the integrated Paα flux of GN20 and star formation rate as well as the upper limits for Paβ using the new emission line maps. The updated values are reported in Table 1.
Integrated flux measurements.
The new 3σ detection limit of Paβ is 1.08 × 10⁻¹⁷ erg s−1 cm−2, comparing this to the observed Paα flux allowed us to put a constraint on the foreground extinction. We assume an intrinsic Paα over Paβ ratio of 2.075 (Osterbrock & Ferland 2006), for T = 104 K and an electron density (Ne) of 102 cm−3 (for Ne = 104, this value would be 2.051). The observed (3σ lower limit) Paα over Paβ ratio is 2.47; with a factor 1.2 higher than the theoretical ratio, this would result in a lower limit of AV = 5.6 mag, assuming a Cardelli et al. (1989) extinction law with an RV = 4.05. Taking the 1σ error into account, this lower limit in AV would increase to AV = 41.0 mag.
3.4. Paα clumps
We re-extracted the spectra of the four clumps in Fig. 3. The resulting spectra are presented in Fig. 5. Compared to Bik et al. (2024), the positions and derived properties slightly change. Based on the Paα channel maps, we find that clump 3a is related to clump 2b, covering a similar velocity range (Fig. 5). Clump 4 also now shows a double peaked nature, separating in clumps 4a and 4b.
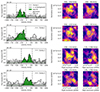 |
Fig. 5. Paα spectra and channel maps of the clumps in GN20. Left column: Integrated spectra of the clumps identified in the Paα line map. The gray histograms represent the 1σ errors. The vertical dotted lines represent the borders in which the flux and integrated star formation rate were calculated (Table 2). The green histograms show the best Gaussian fits to the emission profile, with the dotted lines being the individual Gaussians for clumps 1, 2, 3, and 4. Middle and right columns: Paα channel map for each clump annotated by the blue circle. The two channel maps for each clump show the location of the two different peaks in the Paα spectra. In the emission channel map related to the red peak of clump 3 (row 3, right channel map), emission is visible at the location of clump 4 due to the similar velocity range. The peak at the location of clump 1 is caused by a (2-σ) peak at +125 km s−1 in the spectrum of clump 1. |
Clump properties.
The measured velocity dispersion of the Paα clumps range between 37 and 135 km s−1, in the same range as the velocity dispersion of the CO clumps identified by Hodge et al. (2012).
3.5. Ionized gas kinematics
The new rotation curve is shown in Fig. 6. We measure a  = 589 ± 40 km s−1 and a vrot/σm = 3.9 ± 1.4.
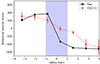 |
Fig. 6. Rotational velocity of GN20 derived from a single Gaussian fit to the Paα PV diagram (Fig. 2) along the semi-major axis compared to the rotation profile from CO(2−1) derived from the velocity map in Hodge et al. (2012). The shaded blue area shows the range affected by beam smearing. |
3.6. Extinction in GN20
Based on the new SFRPaα = 205 ± 15 M⊙ yr−1 (Table 1), we find that the observed Paα emission reveals 11.0 ± 0.5% of the star formation rate derived from the millimeter observations. Using the Cardelli et al. (1989) extinction law with RV, we find a total extinction of AV = 14.8 ± 0.3 mag. Under the assumption that the gas and dust are mixed, we found AV, mixed = 30.5 ± 2 mag using Calabrò et al. (2018).
Based on the standard deviation derived for the Paα image (Sect. 3.3), we derived a 3σ detection limit of 4.4 M⊙ yr−1 per pixel. This allowed us to estimate an upper limit for the UV bright region where no Paα is detected (Fig. 4). Assuming a constant spatial distribution and an MRS pixel size of 0.029 arcsec2 gives a 3σ upper limit of 26 M⊙ yr−1 for a 1 arcsec2 aperture.
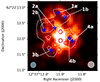 |
Fig. 7. Convolved image of GN20 in F560W. The white contours stand for the contours of the Paα emission line map (Fig. 3). The blue asterisks show the position of the clumps identified in Sect. 3.4. The red circles show the location of the CO clumps identified by Hodge et al. (2012). The beam size of the CO observations is shown in the bottom left and the PSF of the MIRI F560W image on the bottom right. |
References
- Bik, A., Álvarez Márquez, J., Colina, L., et al. 2024, A&A, 686, A3 [NASA ADS] [CrossRef] [EDP Sciences] [Google Scholar]
- Bushouse, H., Eisenhamer, J., Dencheva, N., et al. 2023, https://doi.org/10.5281/zenodo.7577320 [Google Scholar]
- Calabrò, A., Daddi, E., Cassata, P., et al. 2018, ApJ, 862, L22 [Google Scholar]
- Cardelli, J. A., Clayton, G. C., & Mathis, J. S. 1989, ApJ, 345, 245 [Google Scholar]
- Carilli, C. L., Hodge, J., Walter, F., et al. 2011, ApJ, 739, L33 [NASA ADS] [CrossRef] [Google Scholar]
- Colina, L., Gómez, A. C., Álvarez Márquez, J., et al. 2023, A&A, 673, L6 [NASA ADS] [CrossRef] [EDP Sciences] [Google Scholar]
- Hodge, J. A., Carilli, C. L., Walter, F., et al. 2012, ApJ, 760, 11 [Google Scholar]
- Hodge, J. A., Riechers, D., Decarli, R., et al. 2015, ApJ, 798, L18 [Google Scholar]
- Hsiao, T. Y.-Y., Álvarez Márquez, J., Coe, D., et al. 2024, ApJ, 973, 81 [NASA ADS] [CrossRef] [Google Scholar]
- Osterbrock, D. E., & Ferland, G. J. 2006, Astrophysics of Gaseous Nebulae and Active Galactic Nuclei, 2nd edn. (Sausalito: University Science Books) [Google Scholar]
© The Authors 2025
 Open Access article, published by EDP Sciences, under the terms of the Creative Commons Attribution License (https://creativecommons.org/licenses/by/4.0), which permits unrestricted use, distribution, and reproduction in any medium, provided the original work is properly cited.
This article is published in open access under the Subscribe to Open model. This email address is being protected from spambots. You need JavaScript enabled to view it. to support open access publication.
All Tables
All Figures
|
Fig. 1. Integrated spectrum of GN20 centered on Paα. Plotted in green is the standard deviation derived from a background aperture of the same size as the galaxy spectrum. The spectrum plotted in red shows the CO(2−1) emission extracted from the data presented in Hodge et al. (2012); overplotted in blue is the single Gaussian fit to derive the redshift (see text). The systemic velocity corresponds to a redshift of z = 4.0548 (Carilli et al. 2011). |
| In the text | |
|
Fig. 2. Position-velocity diagram of Paα along the major axis of the galaxy (PA = 25°). The offset is relative to the position of the bright nucleus of GN20 (Colina et al. 2023). The red solid lines show the extraction apertures used for creating the Paα emission line map, while the dashed red lines show the corresponding background map from which we derived the error on the emission line map. |
| In the text | |
|
Fig. 3. Paα emission line map after extraction based on the PV diagram (Fig. 2, see text). The 2σ, 3σ, and 4σ contours are shown in cyan. The black contours show the bright nucleus of GN20 detected in the F560W image (Colina et al. 2023). The MRS point spread function at 9.47 μm is displayed as a gray ellipse. The PSF is slightly asymmetric and the size shows the FWHM in the α (x) and β (y) direction, rotated according to the observed position angle. The four clumps discussed in Sect. 3.4 are annotated. |
| In the text | |
|
Fig. 4. Multiwavelength comparison of GN20 with the Paα emission line map (cyan contours). a: F560W (rest-frame 1.1 μm) image from Colina et al. (2023), b: HST/ACS F814W (rest-frame 0.15 μm) image, c: 880 μm (rest-frame 160 μm) image from Hodge et al. (2015), and d: CO(2−1) emission from Hodge et al. (2012). The red circles show the position of the five CO clumps identified by Hodge et al. (2012). |
| In the text | |
|
Fig. 5. Paα spectra and channel maps of the clumps in GN20. Left column: Integrated spectra of the clumps identified in the Paα line map. The gray histograms represent the 1σ errors. The vertical dotted lines represent the borders in which the flux and integrated star formation rate were calculated (Table 2). The green histograms show the best Gaussian fits to the emission profile, with the dotted lines being the individual Gaussians for clumps 1, 2, 3, and 4. Middle and right columns: Paα channel map for each clump annotated by the blue circle. The two channel maps for each clump show the location of the two different peaks in the Paα spectra. In the emission channel map related to the red peak of clump 3 (row 3, right channel map), emission is visible at the location of clump 4 due to the similar velocity range. The peak at the location of clump 1 is caused by a (2-σ) peak at +125 km s−1 in the spectrum of clump 1. |
| In the text | |
|
Fig. 6. Rotational velocity of GN20 derived from a single Gaussian fit to the Paα PV diagram (Fig. 2) along the semi-major axis compared to the rotation profile from CO(2−1) derived from the velocity map in Hodge et al. (2012). The shaded blue area shows the range affected by beam smearing. |
| In the text | |
|
Fig. 7. Convolved image of GN20 in F560W. The white contours stand for the contours of the Paα emission line map (Fig. 3). The blue asterisks show the position of the clumps identified in Sect. 3.4. The red circles show the location of the CO clumps identified by Hodge et al. (2012). The beam size of the CO observations is shown in the bottom left and the PSF of the MIRI F560W image on the bottom right. |
| In the text | |
Current usage metrics show cumulative count of Article Views (full-text article views including HTML views, PDF and ePub downloads, according to the available data) and Abstracts Views on Vision4Press platform.
Data correspond to usage on the plateform after 2015. The current usage metrics is available 48-96 hours after online publication and is updated daily on week days.
Initial download of the metrics may take a while.