Fig. 3.
Download original image
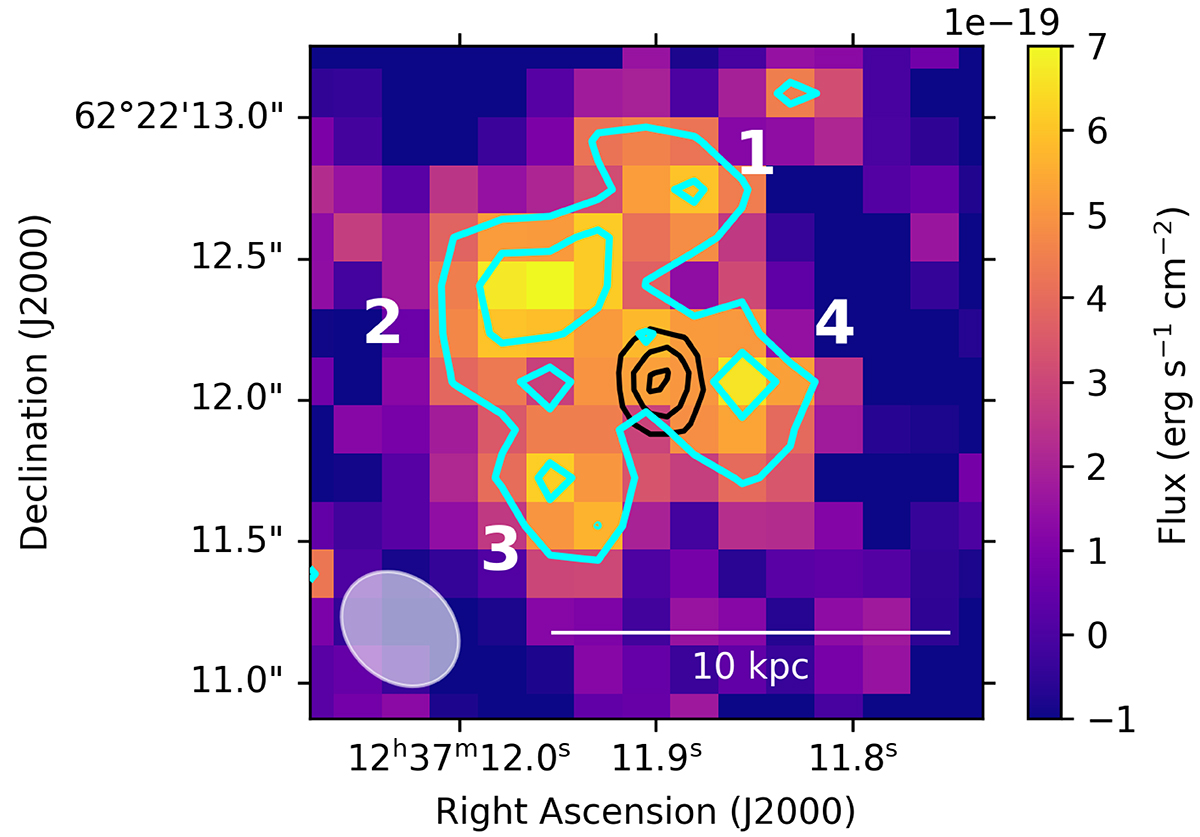
Paα emission line map after extraction based on the PV diagram (Fig. 2, see text). The 2σ, 3σ, and 4σ contours are shown in cyan. The black contours show the bright nucleus of GN20 detected in the F560W image (Colina et al. 2023). The MRS point spread function at 9.47 μm is displayed as a gray ellipse. The PSF is slightly asymmetric and the size shows the FWHM in the α (x) and β (y) direction, rotated according to the observed position angle. The four clumps discussed in Sect. 3.4 are annotated.
Current usage metrics show cumulative count of Article Views (full-text article views including HTML views, PDF and ePub downloads, according to the available data) and Abstracts Views on Vision4Press platform.
Data correspond to usage on the plateform after 2015. The current usage metrics is available 48-96 hours after online publication and is updated daily on week days.
Initial download of the metrics may take a while.