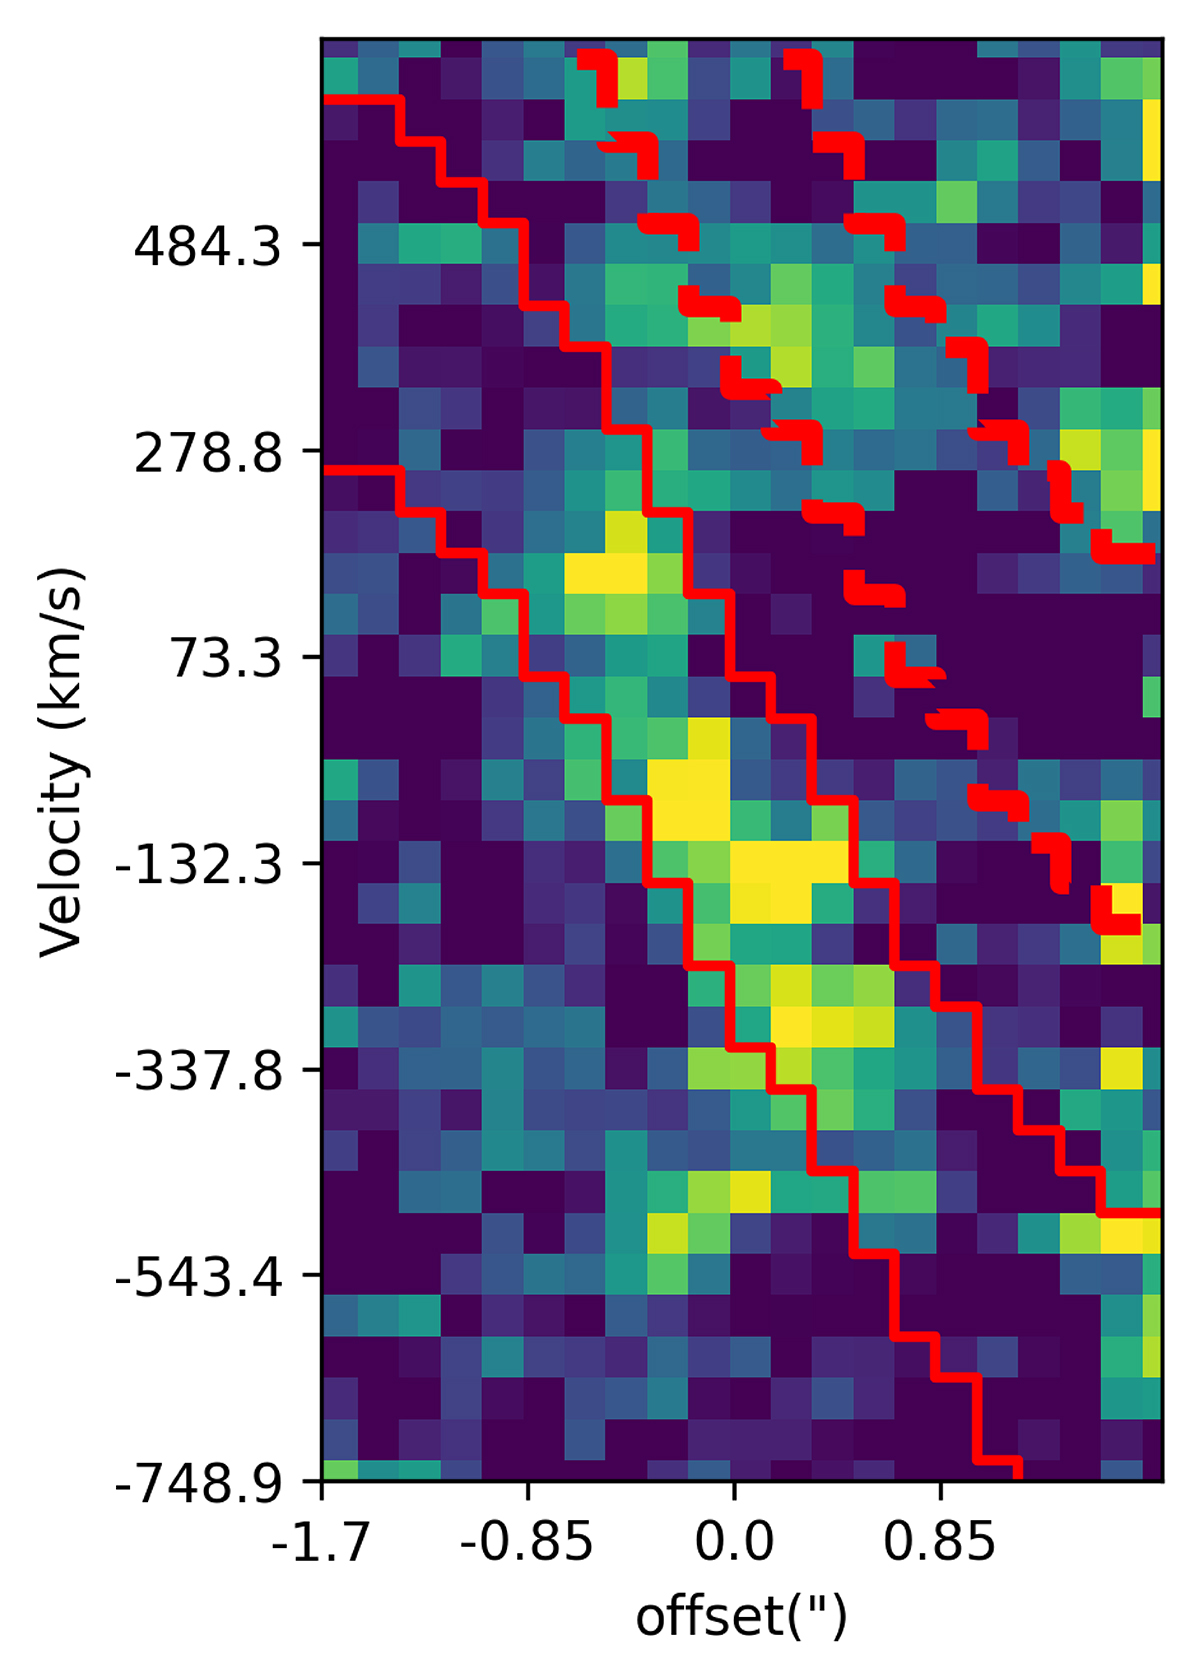
Fig. 2.
Download original image
Position-velocity diagram of Paα along the major axis of the galaxy (PA = 25°). The offset is relative to the position of the bright nucleus of GN20 (Colina et al. 2023). The red solid lines show the extraction apertures used for creating the Paα emission line map, while the dashed red lines show the corresponding background map from which we derived the error on the emission line map.
Current usage metrics show cumulative count of Article Views (full-text article views including HTML views, PDF and ePub downloads, according to the available data) and Abstracts Views on Vision4Press platform.
Data correspond to usage on the plateform after 2015. The current usage metrics is available 48-96 hours after online publication and is updated daily on week days.
Initial download of the metrics may take a while.