Fig. 4.
Download original image
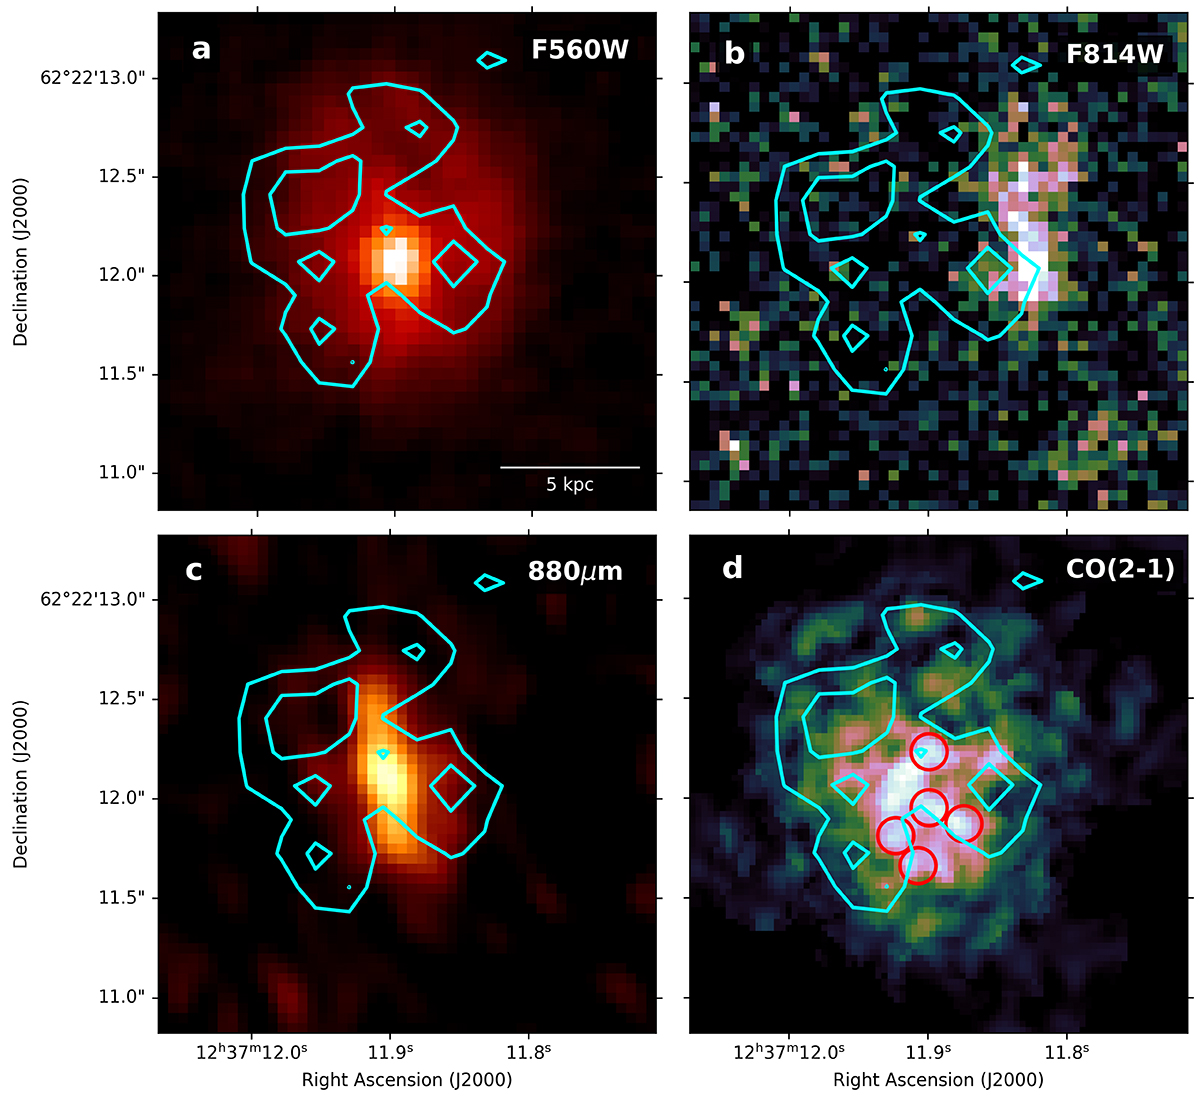
Multiwavelength comparison of GN20 with the Paα emission line map (cyan contours). a: F560W (rest-frame 1.1 μm) image from Colina et al. (2023), b: HST/ACS F814W (rest-frame 0.15 μm) image, c: 880 μm (rest-frame 160 μm) image from Hodge et al. (2015), and d: CO(2−1) emission from Hodge et al. (2012). The red circles show the position of the five CO clumps identified by Hodge et al. (2012).
Current usage metrics show cumulative count of Article Views (full-text article views including HTML views, PDF and ePub downloads, according to the available data) and Abstracts Views on Vision4Press platform.
Data correspond to usage on the plateform after 2015. The current usage metrics is available 48-96 hours after online publication and is updated daily on week days.
Initial download of the metrics may take a while.