Fig. 1.
Download original image
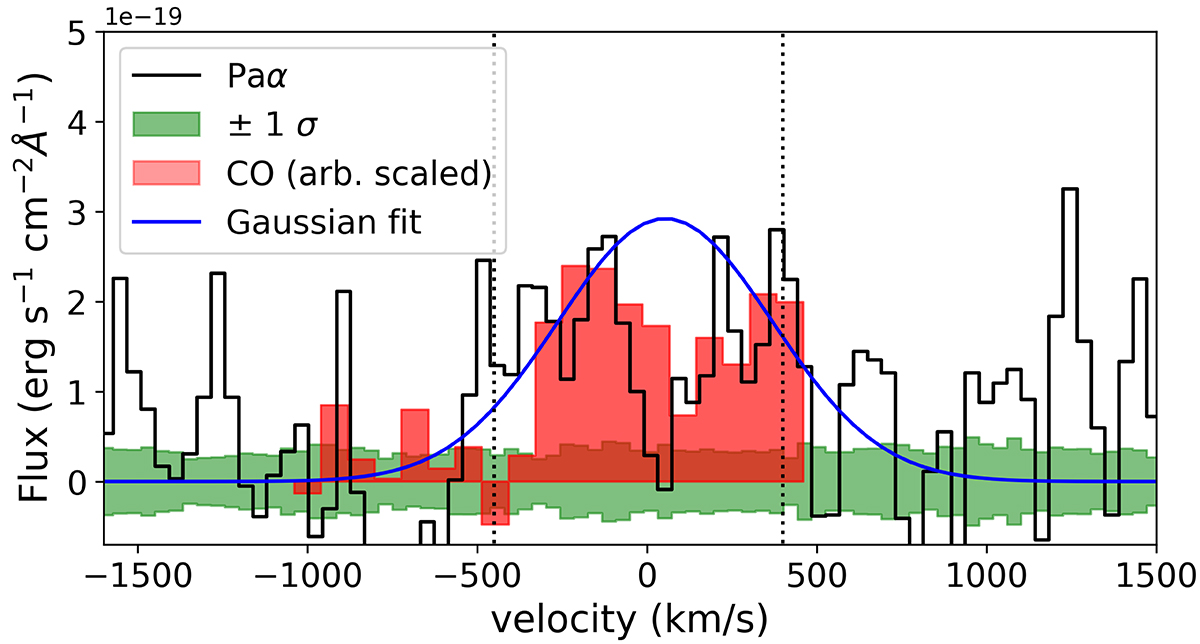
Integrated spectrum of GN20 centered on Paα. Plotted in green is the standard deviation derived from a background aperture of the same size as the galaxy spectrum. The spectrum plotted in red shows the CO(2−1) emission extracted from the data presented in Hodge et al. (2012); overplotted in blue is the single Gaussian fit to derive the redshift (see text). The systemic velocity corresponds to a redshift of z = 4.0548 (Carilli et al. 2011).
Current usage metrics show cumulative count of Article Views (full-text article views including HTML views, PDF and ePub downloads, according to the available data) and Abstracts Views on Vision4Press platform.
Data correspond to usage on the plateform after 2015. The current usage metrics is available 48-96 hours after online publication and is updated daily on week days.
Initial download of the metrics may take a while.