Fig. 7.
Download original image
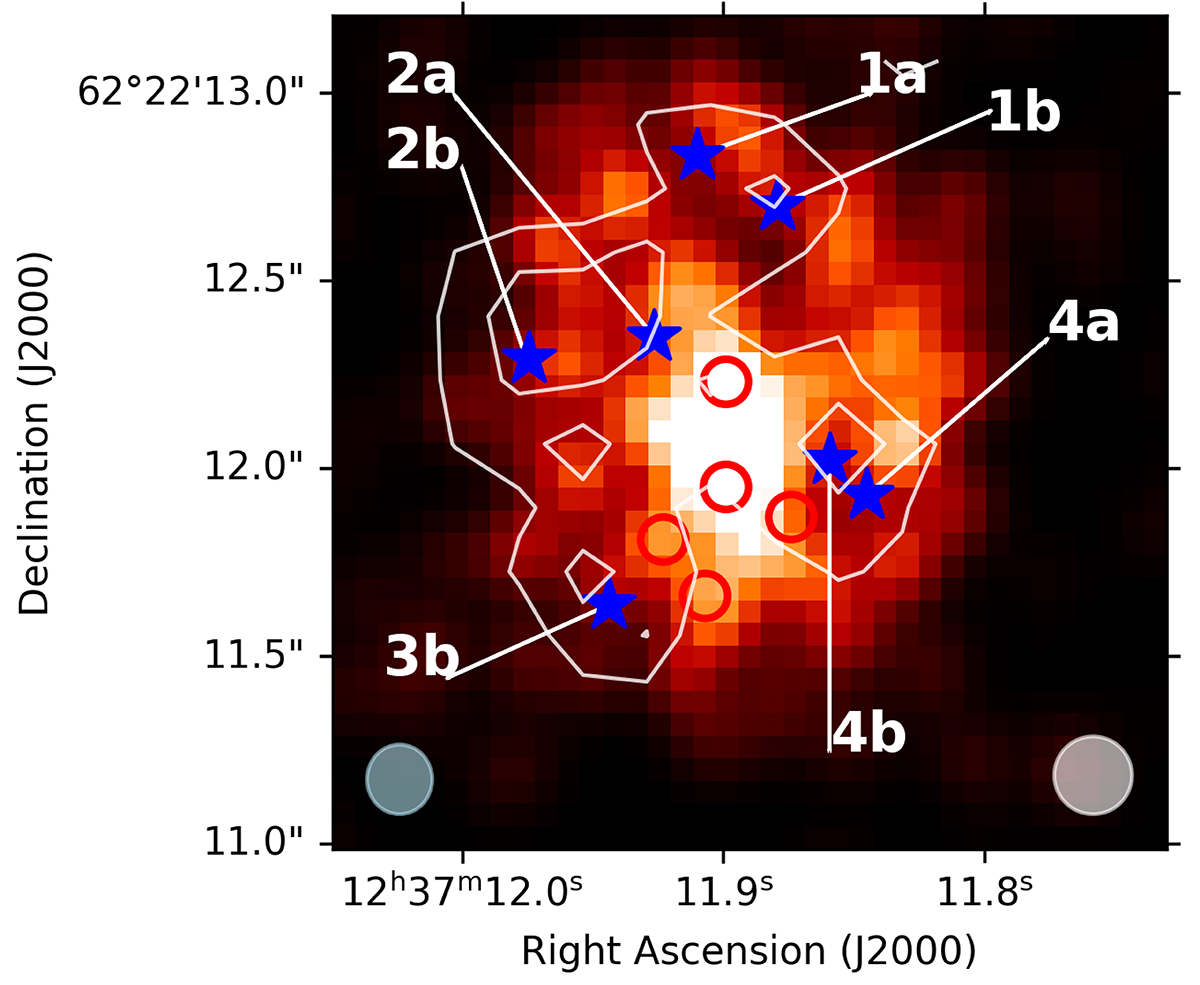
Convolved image of GN20 in F560W. The white contours stand for the contours of the Paα emission line map (Fig. 3). The blue asterisks show the position of the clumps identified in Sect. 3.4. The red circles show the location of the CO clumps identified by Hodge et al. (2012). The beam size of the CO observations is shown in the bottom left and the PSF of the MIRI F560W image on the bottom right.
Current usage metrics show cumulative count of Article Views (full-text article views including HTML views, PDF and ePub downloads, according to the available data) and Abstracts Views on Vision4Press platform.
Data correspond to usage on the plateform after 2015. The current usage metrics is available 48-96 hours after online publication and is updated daily on week days.
Initial download of the metrics may take a while.