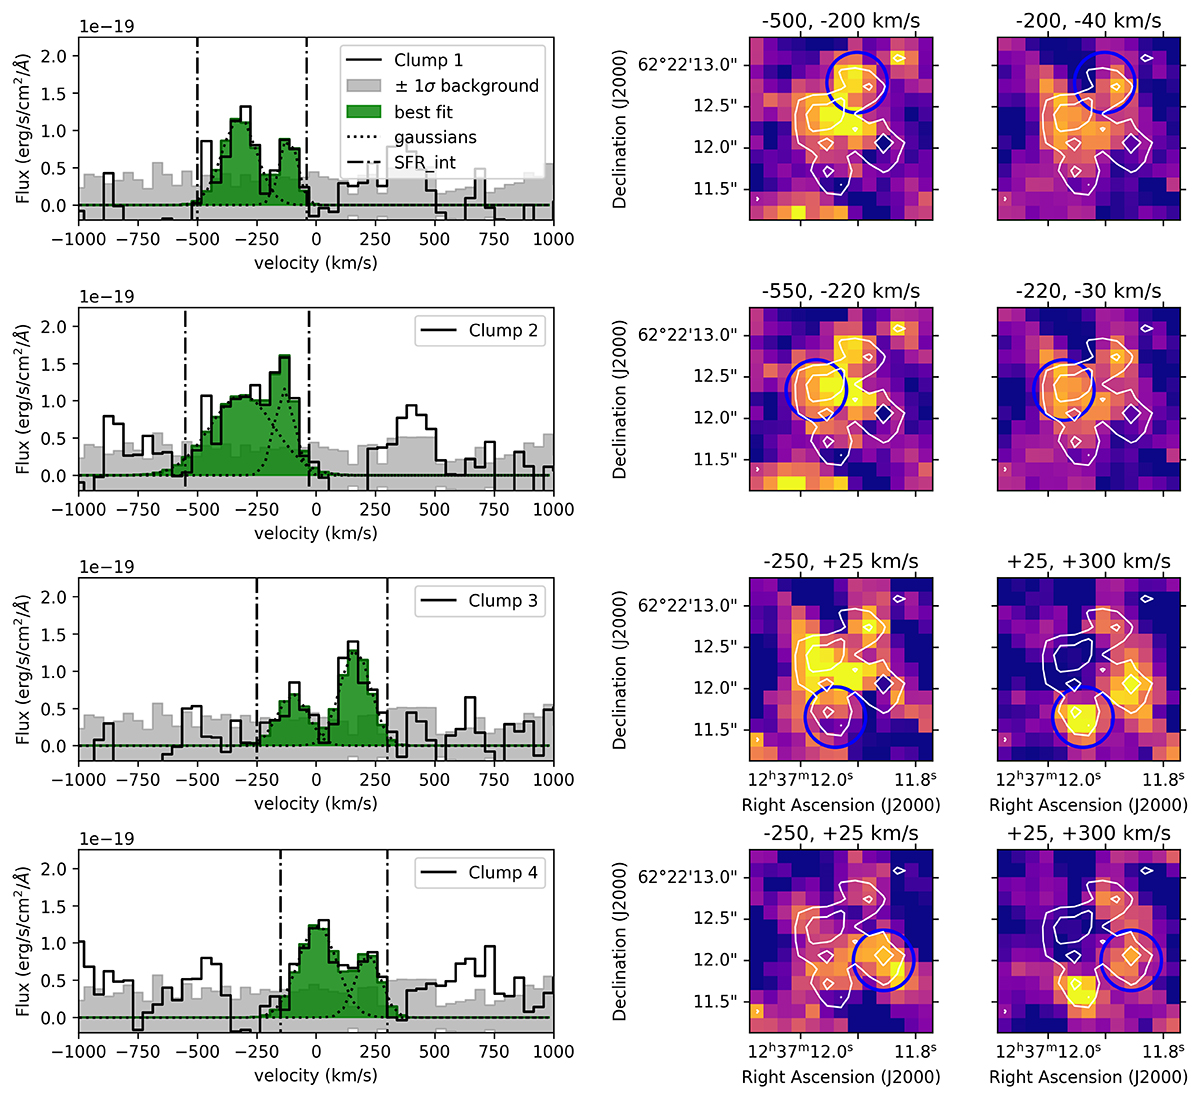
Fig. 5.
Download original image
Paα spectra and channel maps of the clumps in GN20. Left column: Integrated spectra of the clumps identified in the Paα line map. The gray histograms represent the 1σ errors. The vertical dotted lines represent the borders in which the flux and integrated star formation rate were calculated (Table 2). The green histograms show the best Gaussian fits to the emission profile, with the dotted lines being the individual Gaussians for clumps 1, 2, 3, and 4. Middle and right columns: Paα channel map for each clump annotated by the blue circle. The two channel maps for each clump show the location of the two different peaks in the Paα spectra. In the emission channel map related to the red peak of clump 3 (row 3, right channel map), emission is visible at the location of clump 4 due to the similar velocity range. The peak at the location of clump 1 is caused by a (2-σ) peak at +125 km s−1 in the spectrum of clump 1.
Current usage metrics show cumulative count of Article Views (full-text article views including HTML views, PDF and ePub downloads, according to the available data) and Abstracts Views on Vision4Press platform.
Data correspond to usage on the plateform after 2015. The current usage metrics is available 48-96 hours after online publication and is updated daily on week days.
Initial download of the metrics may take a while.