| Issue |
A&A
Volume 694, February 2025
|
|
|---|---|---|
| Article Number | L17 | |
| Number of page(s) | 5 | |
| Section | Letters to the Editor | |
| DOI | https://doi.org/10.1051/0004-6361/202453509 | |
| Published online | 18 February 2025 | |
Letter to the Editor
Three fast-rotating Jovian trojans identified by TESS set new population density limits
1
Konkoly Observatory, HUN-REN Research Centre for Astronomy and Earth Sciences, Konkoly Thege Miklós út 15-17 H-1121 Budapest, Hungary
2
CSFK, MTA Centre of Excellence, Budapest, Konkoly Thege Miklós út 15-17 H-1121, Hungary
3
ELTE Eötvös Loránd University, Institute of Physics and Astronomy, Pázmány Péter sétany 1/A, Budapest, Hungary
4
ELTE Eötvös Loránd University, Gothard Astrophysical Observatory, Szent Imre h. u. 112, 9700 Szombathely, Hungary
5
MTA-ELTE Exoplanet Research Group, Szent Imre h. u. 112, 9700 Szombathely, Hungary
6
Department of Astrophysical Sciences, Princeton University, 4 Ivy Lane, Princeton, NJ 08544, USA
⋆ Corresponding author; This email address is being protected from spambots. You need JavaScript enabled to view it.
Received:
18
December
2024
Accepted:
30
January
2025
Abstract
We report on the identification of the three fastest rotating Jovian trojans with reliable population assignments known to date, discovered using light curve data from the Transiting Exoplanet Satellite Survey mission and confirmed by Zwicky Transient Facility data. For two of our targets the rotation periods are moderately below the previously accepted ∼5 h Jovian trojan breakup limit (4.26 and 4.75 h); however, the rotation period of (13383) was found to be P = 2.926 h, leading to a density estimate of ρ ≈1.6 g cm−3, higher than the generally accepted ≲1 g cm−3 density limit of Jovian trojans. If associated with lower densities, this rotation rate requires considerable cohesion, of the order of a few kilopascals. The relatively high albedo (pV ≈ 0.11) and fast rotation suggest that (13383) may have undergone an energetic collision that spun up the body and exposed bright material to the surface.
Key words: minor planets / asteroids: individual: (13383) / minor planets / asteroids: individual: (38615) / minor planets / asteroids: individual: (288155)
© The Authors 2025
 Open Access article, published by EDP Sciences, under the terms of the Creative Commons Attribution License (https://creativecommons.org/licenses/by/4.0), which permits unrestricted use, distribution, and reproduction in any medium, provided the original work is properly cited.
This article is published in open access under the Subscribe to Open model. This email address is being protected from spambots. You need JavaScript enabled to view it. to support open access publication.
1. Introduction
Jovian trojans (JTs) – asteroids that orbit the Sun at 1:1 mean motion resonance with Jupiter – are the touchstones of Solar System formation and evolution theories. They are generally believed to have originated in the trans-Neptunian region and to have been captured in their current orbits during the giant planet migration era (see e.g. Bottke et al. 2023; Mottola et al. 2024, for recent reviews). However, alternative scenarios may be necessary to explain the difference between the observed colour distribution of Jovian and Neptune trojans and trans-Neptunian objects (Jewitt 2018), however, in situ formation (Pirani et al. 2019) and the effect of stellar flybys (e.g. Ida et al. 2000; Pfalzner et al. 2024) cannot be completely ruled out. The characteristics of JTs, including their surface composition and geology, photometric properties, shape, and the existence and properties of satellites and rings, provide information on the formation and evolution of these bodies (Marchi et al. 2023; Noll et al. 2023). In addition, rotational properties (period and spin axis orientation) provide important constraints on their formation and collisional evolution (Hanuš et al. 2023; Mottola et al. 2024). Assuming a predominantly rubble-pile structure, the rotation period can constrain the bulk density and cohesion necessary to keep the rotating body together via its gravity. In the main belt, this sets a rotational breakup limit of P ≈ 2.2 h, which corresponds to a critical density of ρc ≈ 2.2 g cm−3 for asteroids larger than a few kilometres in size (Pravec & Harris 2000), Asteroids of this density would disintegrate if they rotated faster. Faster-rotating asteroids require higher densities to remain intact, and the breakup limit (spin rate of the fastest rotating asteroids) defines the highest density of a specific population. The previously known fastest-spinning JT with a reliable orbit determination was asteroid (187463) 2005 XX106, with a rotation period of P = 4.84 h, which was identified by French et al. (2015). This rotation period, and those of other JTs with similar spin rates, set a population density limit of ∼0.9 g cm−3 assuming ruble-pile structure (see Mottola et al. 2024, for a summary). This low density also indicates that JTs have icy compositions and a considerable level of porosity.
We have identified three Jovians with even faster (P ≤4.8 h) rotations using Transiting Exoplanet Survey Satellite (TESS) data, the fastest rotators detected so far in this dynamical population. We present our observations and data reduction in Sect. 2 and our results in Sect. 3, and we discuss the implications of the these newly identified fast rotation rates in Sect. 4.
2. Observations and data reduction
In this Letter we present light curves and photometric properties of three fast-rotating JT asteroids, (13383), (38615), and (288155), observed by TESS (Ricker et al. 2015) during Sectors 29, 42, 43, and 44 (see Table 1). Data reduction steps are analogous to those used in the first data release of photometric analysis provided by the TESS observations for small Solar System bodies (TSSYS-DR1), as discussed in Pál et al. (2020). While TSSYS-DR1 contains nearly ten thousand light curves and the derived rotation characteristics (such as accurate periods and amplitudes) from Year 1 of the TESS mission, the second data release is processed with higher accuracy and precision in terms of photometric analysis up to the end of Year 4. Such improvements include the application of a series of elongated apertures – providing optimal overall signal-to-noise ratios for both fainter and brighter asteroids – accurate propagation of noise characteristics from background contamination caused by variable stars, and automatic masking of data points for mutual asteroid crossings. Imaging data are processed exclusively by the tasks of the FITSH package (Pál 2012).
Main results of the asteroid light curve period determination.
During the post-processing of the derived light curves, first we eliminated the remaining obvious outliers using iterative sigma clipping with the LOWESS algorithm (Cleveland 1979). Then, a low-order least-squares polynomial fitting was applied to remove any remaining instrumental trends and phase-angle variations (Pál et al. 2020; Vavilov & Carry 2025). We obtained rotation rates using Lomb-Scargle periodograms, which were validated via visual inspection. We note that for asteroid (228155) we were able to clearly detect the rotational signal not only in Sector 29, but also in Sectors 42 and 43. For asteroid (38615), data from Sector 43 Camera 2 CCD 2 and CCD 3 were combined to derive the rotational period.
We also used sporadic photometry from the Zwicky Transient Facility (ZTF; Bellm et al. 2019). Asteroid detections were identified, and ZTF data were downloaded using the FINK portal1. The ZTF services offer corrections for phase angle and geometrical effects. We utilized the HG1G2 models, which include geocentric and heliocentric photometric corrections and describe the phase function with two parameters. This is the default phase correction model provided by the FINK portal. A total of 90, 155, and 127 data points were downloaded for asteroids (13383), (38615), and (228155), respectively. The observations covered the years 2021–2024, while for asteroid (13383) nine data points from 2020 were also included. Based on these data and the TESS periods, we plotted the phased diagrams shown in the lowest panels of Fig. 1.
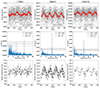 |
Fig. 1. TESS light curves and frequency spectra of (13383), (38615) and (228155). Top: TESS light curves folded with the rotation periods. Grey points are individual observations. We combined the data into 36 phase bins and show the binned rotation curve with large red points. Middle: Power spectra. For (13383) both the rotation frequency and its double are present. For (38615) and (228155), only the double-frequency (half-period) signal is significant, due to their symmetric rotation curves. Bottom: Light curves from the ZTF survey, folded with the same periods. |
3. Results
The power spectra of the asteroids (38615) and (288155) show a single prominent peak, at f = 11.270 and 10.107 cycle/day (c/d) frequencies, respectively (see Fig. 1). When folded with the half frequency (or double period), the light curves show slight asymmetries in the first and second half periods; therefore, we accepted these double-peaked periods of P = 4.259 ± 0.002 for (38615) and P = 4.749 ± 0.001 for (288155).
The light curve of (13383) is sufficiently asymmetric to show both the f = 16.40 c/d peak and its half frequency (f = 8.20 c/d) in the power spectrum, and the latter is clearly the main period. For this target we also checked whether the light curve could be ‘quadruple-peaked’, corresponding to a rotation period of P4 = 5.852 h (double the P = 2.926 h, f = 8.202 c/d) by comparing the binned data of the first and second halves of the light curve folded with P4, using two similar statistical methods described in Pál et al. (2016) and Hromakina et al. (2019). Both methods find that the probability that the two halves of the P4 period light curve are different is p ≤ 0.25; in other words, we see no indication of a quadruple-peaked light curve within the current uncertainties, and we accept the double-peaked period of P2 = 2.926 h as the rotation period. In Fig. 1, the significance levels of each power spectrum are defined by false alarm levels corresponding to probabilities of 0.1, 0.01, and 0.001 (Scargle 1982). The false alarm probability values in the case of (13383) are 0.00328 for the rotational frequency and 0.00018 for its double frequency.
We also tried to verify the identified periods using ZTF data. The tested periodicity is clearly evident in the cases of (38615) and (228155), confirming the period analysis from the TESS data. Additionally, the overall shape of the light curves is also similar. These consistencies strongly support the results for these two fast-rotating trojans. In the case of asteroid (13383), despite the visual impression of the TESS and ZTF data showing similarities, the assumed period could not be unambiguously recovered. We note, however, that this ZTF light curve had the lowest number of data points and signal-to-noise ratio, and the longest overall time coverage, which probably included very different spin axis aspect angles, decreasing the likelihood of a successful period recovery.
4. Discussion and conclusions
In the Formation of the Outer Solar System: An Icy Legacy (FOSSIL) survey sample, Chang et al. (2021) found smaller-diameter JTs with rotation periods shorter than the previously suggested ∼5 h limit, with three having rotation periods of ∼4 h. The diameters of these JTs are around 5 km; therefore, our targets are the first fast-rotating JTs identified in the ∼20 km size range. Mottola et al. (2024) note that these orbital classifications and rotation periods require confirmation, as the objects were previously not classified as trojans, and their assignment is only based on the short-arc determination by FOSSIL.
Assuming a strength-less rubble-pile structure, a lower limit can be estimated for the bulk density from the rotation period and light curve amplitude, following Pravec & Harris (2000). Their model, which uses the previous ∼4.8 h rotation period, led to a density limit of ∼0.9 g cm−3 for JTs (Ryan et al. 2017; Chang et al. 2021; Mottola et al. 2024). The obtained rotation periods and the derived densities of our targets are presented in Fig. 2, along with data from large databases, including JTs and Hildas from the K2 mission (Szabó et al. 2017, 2020; Kalup et al. 2021) and the FOSSIL survey (Chang et al. 2021, 2022). The Pravec & Harris (2000) relation provides critical densities of ∼0.7 g cm−3 for (38615), ∼0.8 g cm−3 for (228155), and ∼1.5 g cm−3 for (13383).
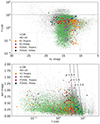 |
Fig. 2. Distribution of basic rotational properties of the inner Solar System asteroid populations. Top panel: Rotational frequency versus absolute magnitude. The dashed horizontal line marks the breakup limit of main belt asteroids, corresponding to a rotational period of 2.2 h (Pravec & Harris 2000). Bottom panel: Light curve amplitude versus rotational frequency. Dashed curves correspond to constant critical densities, as calculated by Pravec & Harris (2000). In both panels, the symbols with different colours correspond to the data sources, as indicated in the legend. The three targets discussed in this paper are marked with large blue symbols. |
Instead of this strength-less rubble-pile approximation, we can use a simple granular material model. Here we assumed that the asteroid has a shape of a triaxial ellipsoid with semi-axes a > b ≥ c, and the rotational breakup limit can be obtained from the Drucker-Prager criterion for failure, following Holsapple (2004, 2007). In their model, the cohesion necessary to keep the rotating body together is obtained from the criterion 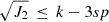 , where J2 is the second invariant of deviator stresses, k is the cohesion (shear stress at zero pressure), s is the slope parameter, and p is the pressure. An approximate shape of our targets can be obtained assuming that we see the system equator-on, and that the ratio of the a and b semi-axes is simply obtained from the observed light curve amplitude (note that a larger maximum light curve amplitude, or a smaller b/a, would lead to a lower cohesion value at a specific density, i.e. this assumption provides an upper limit on the cohesion). Following Holsapple (2007) we also assumed that the b and c semi-axes have equal lengths. For (13383) the absolute magnitude, visible range geometric albedo, and size were obtained from Grav et al. (2012). For the other two targets, the effective diameters were obtained from the HV absolute magnitudes assuming a geometric albedo of pv = 0.07, a typical value among JTs (see also our Table 1, Grav et al. 2012). We assumed an angle of friction of ϕ = 45°, which corresponds to a slope parameter of s = 0.356 (Holsapple 2007), as well the ϕ = 40° (s = 0.315) used in Polishook et al. (2016), which is representative of lunar regolith (Mitchell et al. 1974). The results are presented in Fig. 3.
 |
Fig. 3. Cohesion versus density curves for our three targets obtained using the Drucker-Prager criterion for failure. Red and blue curves correspond to (38615) and (228155), respectively. Dashed and solid curves correspond to friction angles of ϕ = 40 and 45°, respectively. The shaded areas represent the cohesion curves of (13383) allowed by the uncertainties in absolute magnitude and albedo determination: ϕ = 40° (striped) and ϕ = 45° (solid grey). The light grey area represents the typical cohesion range of lunar regolith, while the horizontal dashed line shows the upper limit of the most compacted lunar regolith (≤ 3kPa; Mitchell et al. 1974). Purple and orange symbols represent the densities obtained for the binaries (617) Patroclus-Menoetius and (3548) Eurybates-Queta (Berthier et al. 2020; Brown et al. 2021), but without cohesion estimates. |
The densities associated with zero cohesion (k = 0) are similar to those obtained from the strength-less rubble-pile case if both friction angles are applied (0.65, 0.8, and 1.6 g cm−3 for (13383), (38615), and (228155), respectively). For (38615) and (228155) the rotation periods confine the possible densities to ρ ≤ 0.8 g cm−3, even in the case of zero cohesion. Lunar regolith has cohesion typically between 100 and 1000 Pa (Mitchell et al. 1974), and main belt and near-Earth asteroids typically require cohesion of the order of a few hundred pascals (see e.g. Polishook et al. 2016). Assuming these cohesion values would decrease the obtained lower limit on the allowable densities of these two targets. For (13383), however, a considerable cohesion is required to allow densities below ∼1.5 g cm−3, as shown by the dark grey shaded area in Fig. 3. These cohesion values are notably higher than those of typical lunar cohesion, and may exceed the cohesion of the most compacted lunar regolith (≲3 kPa; Mitchell et al. 1974).
Reliable density estimates exist for the JT binary systems Eurybates-Queta (ρ = 1.1±0.3 g cm−3; Brown et al. 2021) and Patroclus-Menoetius (ρ = 0.81±0.16 g cm−3; Berthier et al. 2020). The likely contact binary (624) Hektor has ambiguous density values ranging from ρ = 1.0±0.3 g cm−3 (Marchis et al. 2014) to ∼2.4 g cm−3 (Lacerda & Jewitt 2007; Descamps 2015). Among the small Kuiper belt objects, (486958) Arrokoth, which has a size of ∼18 km, similar to our targets, has a very low density of 0.16–0.6 g cm−3 (Keane et al. 2022). However, Arrokoth is a cold classical Kuiper belt object whose formation conditions were likely different from those of the objects in other, excited Kuiper belt dynamical populations, the likely source of JTs (Bottke et al. 2023). Grundy et al. (2019) find from binary system data that the densities of D ≲100 km Kuiper belt objects are ∼0.5 g cm−3. From theoretical calculations, Bierson & Nimmo (2019) also estimate densities of 0.5–0.8 g cm−3 for Kuiper belt objects in this size range, suggesting high porosities. While several JTs have densities comparable with those of similar-sized Kuiper belt objects, there are some JT systems whose estimated densities definitely exceed these values, including (13383), suggesting that in these cases the link between Kuiper belt objects and JTs may not be straightforward.
In the discussion above we assumed that our targets are single bodies; however, it is generally accepted that a notable fraction of the JT population may be binaries. Current estimates are mostly based on the fraction of slow rotators (Szabó et al. 2017; Ryan et al. 2017; Kalup et al. 2021) and provide a binary fraction of ∼20%. As shown in, for example, Lacerda & Jewitt (2007), the same system can be modelled assuming a single body (Jacobi ellipsoid) or a Roche binary, and the system, with the actual rotation period, has a significantly smaller rotation parameter, ω2/πGρ ≲ 0.13, than the same system assuming a single body, leading to a higher density in the contact binary case. Similar results have been obtained by Descamps (2015) assuming dumbbell-shaped equilibrium figures. In the case of our targets, this leads to ρ ≳ 5 g cm−3 for (38615) and (288155) and an extremely high density of ρ ≳ 13 g cm−3 for (13383), strongly suggesting that our targets are not contact binaries.
Jovian trojans are mostly D-type asteroids, with a smaller number of P types and a small fraction of C types (see e.g. Barucci et al. 2002). C-type asteroids have typical densities of ρ ≈ 1.5 g cm−3 in the main belt (see e.g. Vernazza et al. 2021), and their albedos are typically low,  = 0.066±0.031, in the D ≥ 20 km size range Usui et al. (2013). The pV = 0.109±0.022 albedo of (13383) is marginally compatible with the typical albedos of C-type asteroids. Dynamically, our targets seem to be stable JTs, as none of them were identified as ‘insecure’ or ‘nonresonant’ in the recent work by Greenstreet et al. (2024), who investigated the stability of JTs and attempted to identify possible interlopers.
Marsset et al. (2014) suggested that the high albedo of some JTs (pV = 0.17±0.07, considering only JTs with reliable albedo estimates) may be due to collision-induced resurfacing that exposed brighter material to the surface. While the albedo of (13383) is at the lower limit of their high albedo sample, it is higher than the typical albedo of C-type (as discussed above) or D-type asteroids ( = 0.077±0.041; Usui et al. 2013). As collisions are expected to be the major influence in setting the rotation rates of JTs, rather than the Yarkovsky-O’Keefe-Radzievskii-Paddack (YORP) effect at this heliocentric distance (Kalup et al. 2021), it is still an interesting possibility that the fast rotation and relatively high albedo of (13383) might be caused by an energetic collision that accelerated the asteroid’s rotation to the present spin rate, and notably modified the surface at the same time.
Acknowledgments
This paper includes data collected by the TESS mission. Funding for the TESS mission is provided by the NASA’s Science Mission Directorate. The research leading to these results has received funding from the K-138962, SNN-147362, KKP-137523 and TKP2021-NKTA-64 grants of the National Research, Development and Innovation Office (NKFIH, Hungary). This work made use of Astropy (http://www.astropy.org) a community-developed core Python package and an ecosystem of tools and resources for astronomy (Astropy Collaboration 2013, 2018, 2022). This work used GNU Parallel (Tange 2022). This research made use of NASA’s Astrophysics Data System Bibliographic Services. We thank our reviewer for the useful comments and suggestions. We also thank the hospitality of Főnix Badacsony where this project was carried out.
References
- Astropy Collaboration (Robitaille, T. P., et al.) 2013, A&A, 558, A33 [NASA ADS] [CrossRef] [EDP Sciences] [Google Scholar]
- Astropy Collaboration (Price-Whelan, A. M., et al.) 2018, AJ, 156, 123 [Google Scholar]
- Astropy Collaboration (Price-Whelan, A. M., et al.) 2022, ApJ, 935, 167 [NASA ADS] [CrossRef] [Google Scholar]
- Barucci, M. A., Cruikshank, D. P., Mottola, S., & Lazzarin, M. 2002, in Asteroids III, eds. W. F. Bottke, Jr., A. Cellino, P. Paolicchi, & R. P. Binzel (University of Arizons Press), 273 [CrossRef] [Google Scholar]
- Bellm, E. C., Kulkarni, S. R., Graham, M. J., et al. 2019, PASP, 131, 018002 [Google Scholar]
- Berthier, J., Descamps, P., Vachier, F., et al. 2020, Icarus, 352, 113990 [CrossRef] [Google Scholar]
- Bierson, C. J., & Nimmo, F. 2019, Icarus, 326, 10 [NASA ADS] [CrossRef] [Google Scholar]
- Bottke, W. F., Marschall, R., Nesvorný, D., & Vokrouhlický, D. 2023, Space Sci. Rev., 219, 83 [NASA ADS] [CrossRef] [Google Scholar]
- Brown, M. E., Levison, H. F., Noll, K. S., et al. 2021, PSJ, 2, 170 [NASA ADS] [Google Scholar]
- Chang, C.-K., Chen, Y.-T., Fraser, W. C., et al. 2021, PSJ, 2, 191 [NASA ADS] [Google Scholar]
- Chang, C.-K., Chen, Y.-T., Fraser, W. C., et al. 2022, ApJS, 259, 7 [NASA ADS] [CrossRef] [Google Scholar]
- Cleveland, W. S. 1979, J. Am. Stat. Assoc., 74, 829 [Google Scholar]
- Descamps, P. 2015, Icarus, 245, 64 [CrossRef] [Google Scholar]
- French, L. M., Stephens, R. D., Coley, D., Wasserman, L. H., & Sieben, J. 2015, Icarus, 254, 1 [NASA ADS] [CrossRef] [Google Scholar]
- Grav, T., Mainzer, A. K., Bauer, J. M., Masiero, J. R., & Nugent, C. R. 2012, ApJ, 759, 49 [NASA ADS] [CrossRef] [Google Scholar]
- Greenstreet, S., Gladman, B., & Jurić, M. 2024, ApJ, 963, L40 [NASA ADS] [CrossRef] [Google Scholar]
- Grundy, W. M., Noll, K. S., Buie, M. W., et al. 2019, Icarus, 334, 30 [CrossRef] [Google Scholar]
- Hanuš, J., Vokrouhlický, D., Nesvorný, D., et al. 2023, A&A, 679, A56 [NASA ADS] [CrossRef] [EDP Sciences] [Google Scholar]
- Holsapple, K. A. 2004, Icarus, 172, 272 [NASA ADS] [CrossRef] [Google Scholar]
- Holsapple, K. A. 2007, Icarus, 187, 500 [NASA ADS] [CrossRef] [Google Scholar]
- Hromakina, T. A., Belskaya, I. N., Krugly, Y. N., et al. 2019, A&A, 625, A46 [NASA ADS] [CrossRef] [EDP Sciences] [Google Scholar]
- Ida, S., Larwood, J., & Burkert, A. 2000, ApJ, 528, 351 [Google Scholar]
- Jewitt, D. 2018, AJ, 155, 56 [NASA ADS] [CrossRef] [Google Scholar]
- Kalup, C. E., Molnár, L., Kiss, C., et al. 2021, ApJS, 254, 7 [NASA ADS] [CrossRef] [Google Scholar]
- Keane, J. T., Porter, S. B., Beyer, R. A., et al. 2022, J. Geophys. Res. (Planets), 127, e07068 [NASA ADS] [Google Scholar]
- Lacerda, P., & Jewitt, D. C. 2007, AJ, 133, 1393 [NASA ADS] [CrossRef] [Google Scholar]
- Marchi, S., Bell, J. F., Bierhaus, B., & Spencer, J. 2023, Space Sci. Rev., 219, 44 [NASA ADS] [CrossRef] [Google Scholar]
- Marchis, F., Durech, J., Castillo-Rogez, J., et al. 2014, ApJ, 783, L37 [NASA ADS] [CrossRef] [Google Scholar]
- Marsset, M., Vernazza, P., Gourgeot, F., et al. 2014, A&A, 568, L7 [NASA ADS] [CrossRef] [EDP Sciences] [Google Scholar]
- Mitchell, J. K., Houston, W. N., Carrier, W. D., & Costes, N. C. 1974, Apollo soil mechanics experiment S-200 final report, Space Sciences Laboratory Series 15, Issue 7 (Berkeley: Univ. California) [Google Scholar]
- Mottola, S., Britt, D. T., Brown, M. E., et al. 2024, Space Sci. Rev., 220, 17 [NASA ADS] [CrossRef] [Google Scholar]
- Noll, K. S., Brown, M. E., Buie, M. W., et al. 2023, Space Sci. Rev., 219, 59 [NASA ADS] [CrossRef] [Google Scholar]
- Pál, A. 2012, MNRAS, 421, 1825 [Google Scholar]
- Pál, A., Kiss, C., Müller, T. G., et al. 2016, AJ, 151, 117 [CrossRef] [Google Scholar]
- Pál, A., Szakáts, R., Kiss, C., et al. 2020, ApJS, 247, 26 [CrossRef] [Google Scholar]
- Pfalzner, S., Govind, A., & Portegies Zwart, S. 2024, Nat. Astron., 8, 1380 [NASA ADS] [CrossRef] [Google Scholar]
- Pirani, S., Johansen, A., & Mustill, A. J. 2019, A&A, 631, A89 [NASA ADS] [CrossRef] [EDP Sciences] [Google Scholar]
- Polishook, D., Moskovitz, N., Binzel, R. P., et al. 2016, Icarus, 267, 243 [NASA ADS] [CrossRef] [Google Scholar]
- Pravec, P., & Harris, A. W. 2000, Icarus, 148, 12 [NASA ADS] [CrossRef] [Google Scholar]
- Ricker, G. R., Winn, J. N., Vanderspek, R., et al. 2015, J. Astron. Telescopes Instrum. Syst., 1, 014003 [Google Scholar]
- Ryan, E. L., Sharkey, B. N. L., & Woodward, C. E. 2017, AJ, 153, 116 [NASA ADS] [CrossRef] [Google Scholar]
- Scargle, J. D. 1982, ApJ, 263, 835 [Google Scholar]
- Szabó, G. M., Pál, A., Kiss, C., et al. 2017, A&A, 599, A44 [NASA ADS] [CrossRef] [EDP Sciences] [Google Scholar]
- Szabó, G. M., Kiss, C., Szakáts, R., et al. 2020, ApJS, 247, 34 [CrossRef] [Google Scholar]
- Tange, O. 2022, GNU Parallel 20221122 [Google Scholar]
- Usui, F., Kasuga, T., Hasegawa, S., et al. 2013, ApJ, 762, 56 [Google Scholar]
- Vavilov, D. E., & Carry, B. 2025, A&A, 693, A66 [NASA ADS] [CrossRef] [EDP Sciences] [Google Scholar]
- Vernazza, P., Ferrais, M., Jorda, L., et al. 2021, A&A, 654, A56 [NASA ADS] [CrossRef] [EDP Sciences] [Google Scholar]
All Tables
All Figures
|
Fig. 1. TESS light curves and frequency spectra of (13383), (38615) and (228155). Top: TESS light curves folded with the rotation periods. Grey points are individual observations. We combined the data into 36 phase bins and show the binned rotation curve with large red points. Middle: Power spectra. For (13383) both the rotation frequency and its double are present. For (38615) and (228155), only the double-frequency (half-period) signal is significant, due to their symmetric rotation curves. Bottom: Light curves from the ZTF survey, folded with the same periods. |
| In the text | |
|
Fig. 2. Distribution of basic rotational properties of the inner Solar System asteroid populations. Top panel: Rotational frequency versus absolute magnitude. The dashed horizontal line marks the breakup limit of main belt asteroids, corresponding to a rotational period of 2.2 h (Pravec & Harris 2000). Bottom panel: Light curve amplitude versus rotational frequency. Dashed curves correspond to constant critical densities, as calculated by Pravec & Harris (2000). In both panels, the symbols with different colours correspond to the data sources, as indicated in the legend. The three targets discussed in this paper are marked with large blue symbols. |
| In the text | |
|
Fig. 3. Cohesion versus density curves for our three targets obtained using the Drucker-Prager criterion for failure. Red and blue curves correspond to (38615) and (228155), respectively. Dashed and solid curves correspond to friction angles of ϕ = 40 and 45°, respectively. The shaded areas represent the cohesion curves of (13383) allowed by the uncertainties in absolute magnitude and albedo determination: ϕ = 40° (striped) and ϕ = 45° (solid grey). The light grey area represents the typical cohesion range of lunar regolith, while the horizontal dashed line shows the upper limit of the most compacted lunar regolith (≤ 3kPa; Mitchell et al. 1974). Purple and orange symbols represent the densities obtained for the binaries (617) Patroclus-Menoetius and (3548) Eurybates-Queta (Berthier et al. 2020; Brown et al. 2021), but without cohesion estimates. |
| In the text | |
Current usage metrics show cumulative count of Article Views (full-text article views including HTML views, PDF and ePub downloads, according to the available data) and Abstracts Views on Vision4Press platform.
Data correspond to usage on the plateform after 2015. The current usage metrics is available 48-96 hours after online publication and is updated daily on week days.
Initial download of the metrics may take a while.