Fig. 3.
Download original image
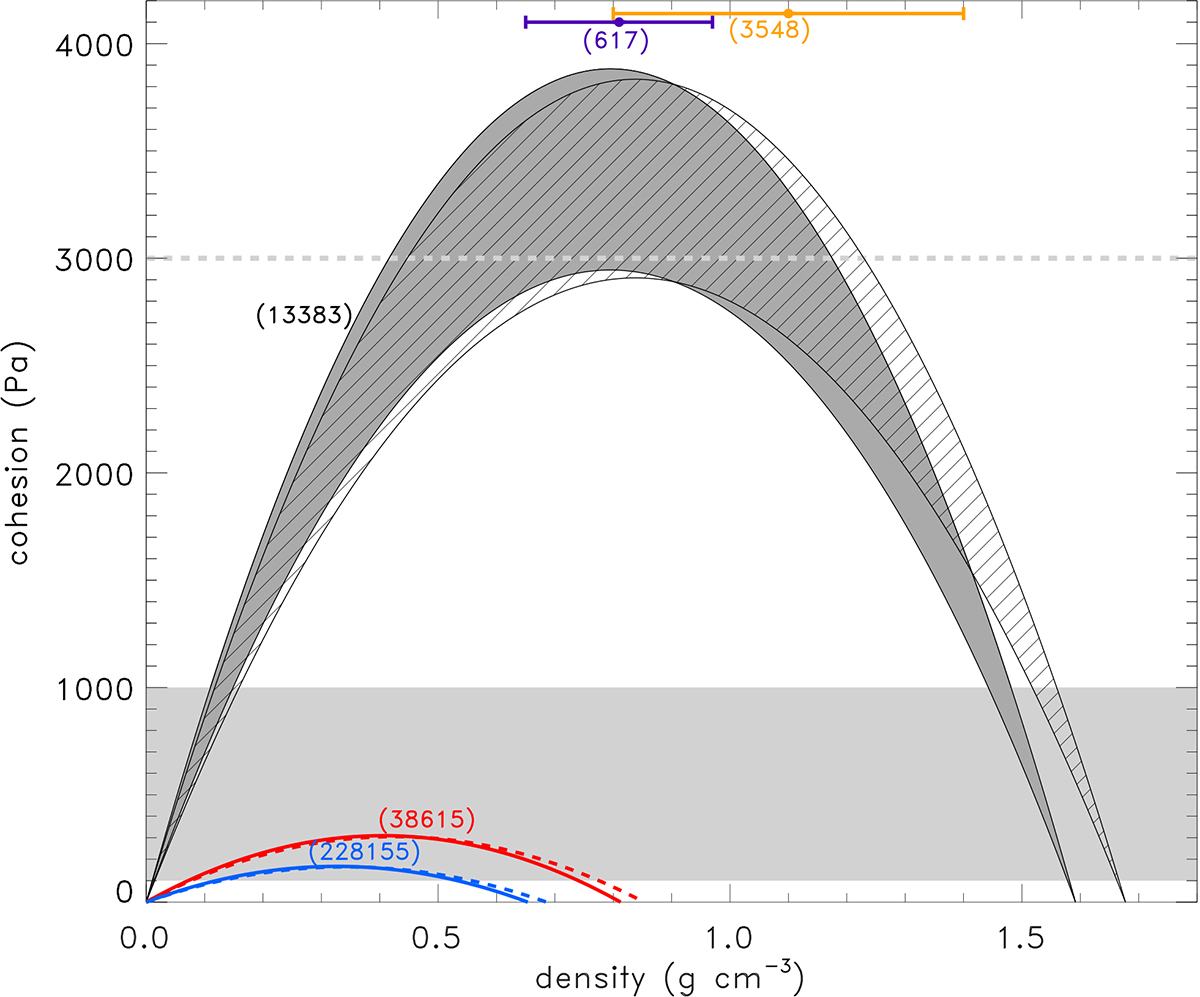
Cohesion versus density curves for our three targets obtained using the Drucker-Prager criterion for failure. Red and blue curves correspond to (38615) and (228155), respectively. Dashed and solid curves correspond to friction angles of ϕ = 40 and 45°, respectively. The shaded areas represent the cohesion curves of (13383) allowed by the uncertainties in absolute magnitude and albedo determination: ϕ = 40° (striped) and ϕ = 45° (solid grey). The light grey area represents the typical cohesion range of lunar regolith, while the horizontal dashed line shows the upper limit of the most compacted lunar regolith (≤ 3kPa; Mitchell et al. 1974). Purple and orange symbols represent the densities obtained for the binaries (617) Patroclus-Menoetius and (3548) Eurybates-Queta (Berthier et al. 2020; Brown et al. 2021), but without cohesion estimates.
Current usage metrics show cumulative count of Article Views (full-text article views including HTML views, PDF and ePub downloads, according to the available data) and Abstracts Views on Vision4Press platform.
Data correspond to usage on the plateform after 2015. The current usage metrics is available 48-96 hours after online publication and is updated daily on week days.
Initial download of the metrics may take a while.