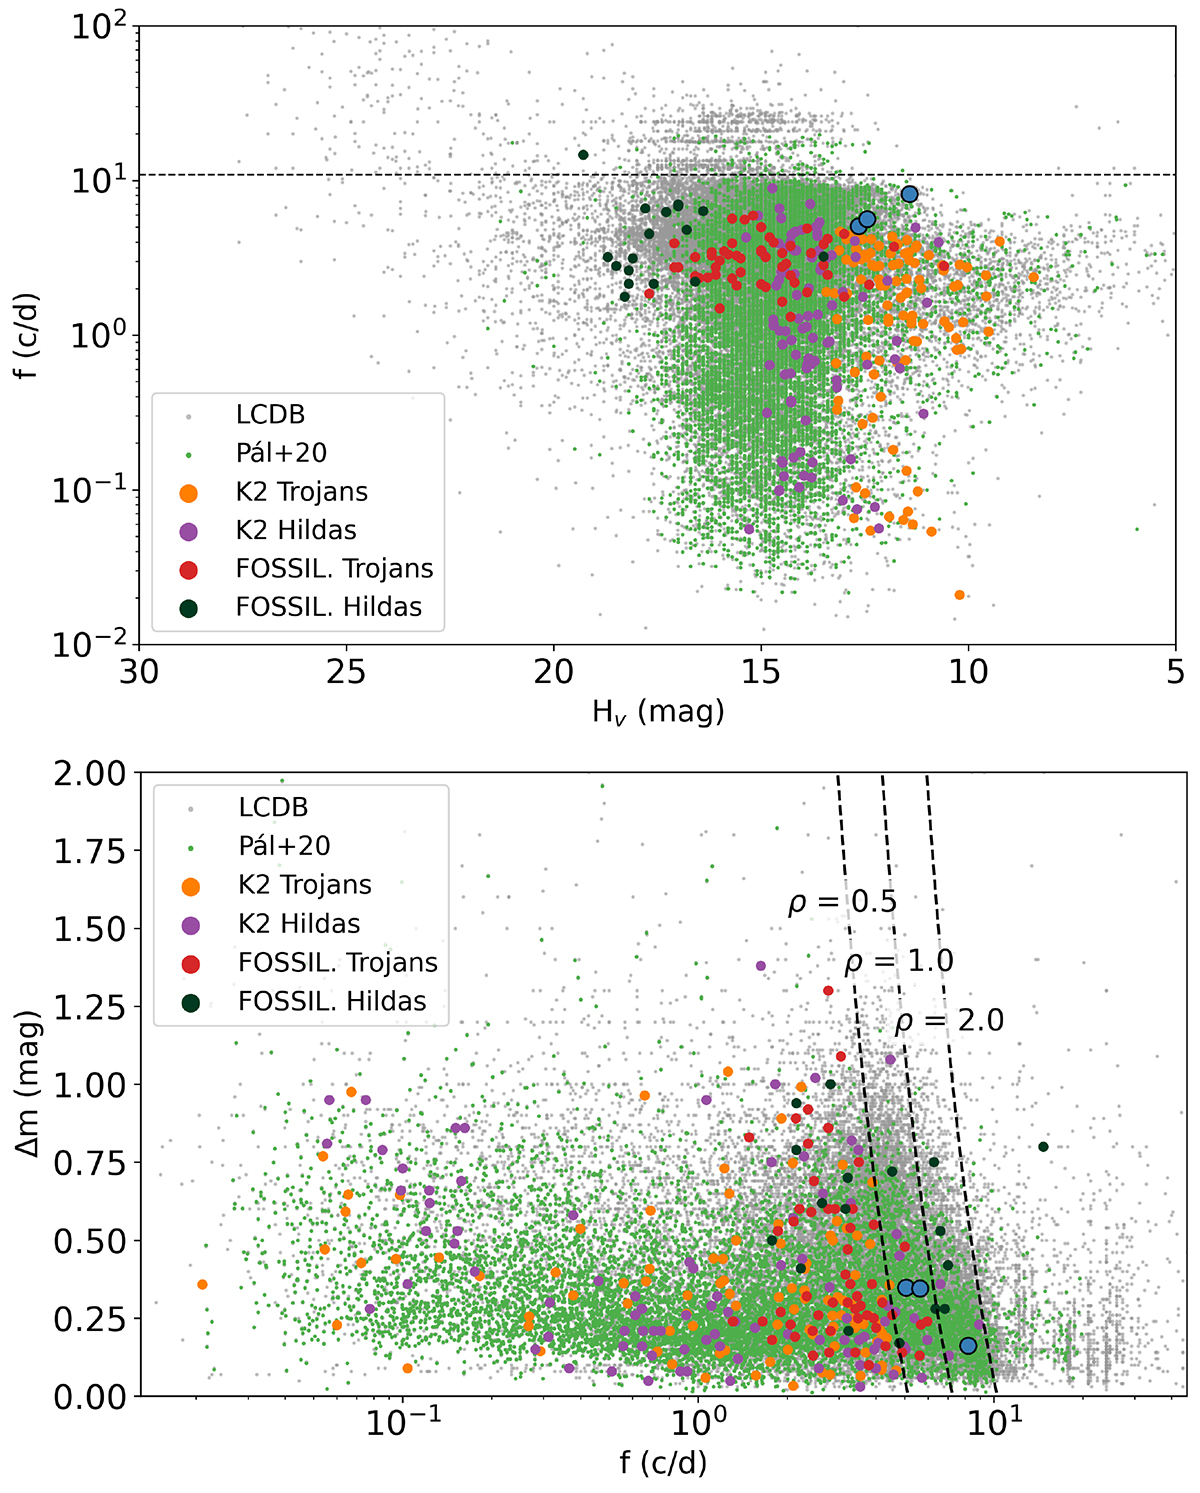
Fig. 2.
Download original image
Distribution of basic rotational properties of the inner Solar System asteroid populations. Top panel: Rotational frequency versus absolute magnitude. The dashed horizontal line marks the breakup limit of main belt asteroids, corresponding to a rotational period of 2.2 h (Pravec & Harris 2000). Bottom panel: Light curve amplitude versus rotational frequency. Dashed curves correspond to constant critical densities, as calculated by Pravec & Harris (2000). In both panels, the symbols with different colours correspond to the data sources, as indicated in the legend. The three targets discussed in this paper are marked with large blue symbols.
Current usage metrics show cumulative count of Article Views (full-text article views including HTML views, PDF and ePub downloads, according to the available data) and Abstracts Views on Vision4Press platform.
Data correspond to usage on the plateform after 2015. The current usage metrics is available 48-96 hours after online publication and is updated daily on week days.
Initial download of the metrics may take a while.