| Issue |
A&A
Volume 693, January 2025
|
|
|---|---|---|
| Article Number | C1 | |
| Number of page(s) | 3 | |
| Section | Cosmology (including clusters of galaxies) | |
| DOI | https://doi.org/10.1051/0004-6361/202453150e | |
| Published online | 23 December 2024 | |
Feeding and feedback processes in the Spiderweb proto-intracluster medium (Corrigendum)
1
INAF-Osservatorio Astrofisico di Arcetri, Largo Enrico Fermi 5, 50125 Florence, Italy
2
Astronomy Unit, Department of Physics, University of Trieste, Via Tiepolo 11, I-34131 Trieste, Italy
3
INAF-Osservatorio Astronomico di Trieste, Via G. B. Tiepolo 11, I-34143 Trieste, Italy
4
IFPU – Institute for Fundamental Physics of the Universe, Via Beirut 2, 34014 Trieste, Italy
5
Max Planck Institute for Astrophysics, Karl-Schwarzschild-Str. 1, D-85741 Garching, Germany
6
European Southern Observatory (ESO), Karl-Schwarzschild-Str. 2, D-85748 Garching, Germany
7
INFN-Sezione di Trieste, Trieste, Italy
8
National Radio Astronomy Observatory, PO Box 0 Socorro, NM 87801, USA
9
Department of Astrophysical Sciences, Princeton University, Princeton, NJ 08544, USA
10
Department of Physics and Astronomy, University of Florence, Via Giovanni Sansone, 1, 50019 Florence, Italy
11
Max Planck Institute for Extraterrestrial Physics, Giessenbachstrasse 1, 85748 Garching, Germany
12
INAF – Osservatorio Astronomico di Roma, Via Frascati 33, I-00040 Monteporzio, (RM), Italy
13
Dipartimento di Fisica e Scienze della Terra, Università degli Studi di Ferrara, via Saragat 1, I-44122 Ferrara, Italy
14
Jansky Fellow of the National Radio Astronomy Observatory, PO Box 0 Socorro, NM 87801, USA
15
Instituto de Astrofísica de Canarias (IAC), 38205 La Laguna, Tenerife, Spain
16
Universidad de La Laguna, Dpto. Astrofísica, 38206 La Laguna, Tenerife, Spain
17
Leiden Observatory, PO Box 9513 2300 RA Leiden, The Netherlands
18
Space Telescope Science Institute, 3700 San Martin Dr., Baltimore, MD 21210, USA
19
Johns Hopkins University, 3400 N. Charles Street, Baltimore, MD 21218, USA
⋆ Corresponding author; This email address is being protected from spambots. You need JavaScript enabled to view it.
Key words: galaxies: clusters: intracluster medium / galaxies: high-redshift / galaxies: clusters: individual: MRC 1138–262 / large-scale structure of Universe / errata, addenda
We found a mistake in the plots of the surface brightness profiles SB. This affects the normalization of SB in Fig. 1 (bottom panels), Fig. 2 (right panel), Fig. 3 (right panel), and Fig. 6. Here we show the correct plots in Fig. 1, 2, 3, 4. This error was due to a typo in the value of the conversion factors ECF used in the plotting routines. Also, the ECF values reported in Sect. 3 are wrong. The correct value is ECF = 1.20 × 10⁻¹¹ erg/s/cm2/cts in the soft [0.5–2] keV band and ECF = 1.24 × 10⁻¹¹ erg/s/cm2/cts in the hard [2–10] keV band. Consequently, the S0 values in Table 1 also changed. Here we report the new values in Table 1.
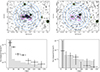 |
Fig. 1. AGN-subtracted soft (0.5-2 keV, upper-left panel) and hard (2-7 keV, upper-right panel) band images of the Spiderweb protocluster in a field of view of ∼90 × 70 arcsec2. The blue concentric circles represent the regions within which we derived the surface brightness and correspond to an outer radius of 2, 4, 7, 10, 13, 17, and 21 arcsec, with the central blue circle showing the region where the unresolved AGN emission makes it impossible to estimate the diffuse emission. The green circles represent removed unresolved sources and the magenta boxes represent the eastern and western jet regions overlapping with the radio emission, and are excluded from our analysis since they are dominated by the diffuse, non-thermal IC emission from the jets. For the purposes of visualization, the central surface brightness is parametrized with nd = 4, as discussed in Tozzi et al. (2022). In the lower-left and lower-right panels, we show the corresponding background-subtracted surface brightness profiles computed according to Equation (1). The black bars represent the 1σ uncertainties associated with data points including the Poissonian errors on the total counts and the background expected counts. The gray-shaded area marks the value of surface brightness parametrized with nd = 4 in the first bin and the 1σ background level in the other bins. |
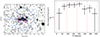 |
Fig. 2. AGN-subtracted soft band image of the Spiderweb protocluster (left). The blue circle corresponds to 17 arcsec, while the blue lines represent the regions within which we derived the surface brightness as a function of the angle. Magenta squares and the magenta circle represent the eastern and western jet excluded regions and the central excluded AGN, respectively, while the green circles represent the excluded unresolved sources in the field of view. The average surface brightness within each wedge in the soft band is presented as a function of the angle (right). The black bars represent the Poissonian uncertainties associated with surface brightness measurements. The dotted red lines separate different quadrants. |
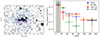 |
Fig. 3. AGN-subtracted soft band image of the Spiderweb protocluster (left). The blue concentric circles, which correspond to 2, 4, 7, 10, 13, and 17 arcsec, and the blue lines separate the quadrants within which we derived the surface brightness as a function of the angle. Magenta squares represent the eastern and western jet excluded regions, while the green circles represent the excluded unresolved sources in the field of view. Surface-brightness profiles as a function of the distance from the central radio source (right). The gray-shaded area represents the surface brightness values parametrized with nd. |
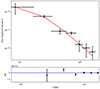 |
Fig. 4. Best fit of the surface brightness profile in the soft band for nd = 4 as a function of the distance from the AGN, shown as the solid red line, considering the extraction from the annular regions in Figure 1 (top panel). The X-ray surface brightness is shown with solid dots and associated error bars. Data points are the same as in Figure 1. Fit residuals are given in the bottom panel. |
Parameters and derived quantities of the beta model fit.
The wrong ECF values and the derived SB profiles were not used to obtain further results. Therefore, our results and conclusions are completely unaffected.
References
- Tozzi, P., Gilli, R., Liu, A., et al. 2022, A&A, 667, A134 [NASA ADS] [CrossRef] [EDP Sciences] [Google Scholar]
© The Authors 2024
 Open Access article, published by EDP Sciences, under the terms of the Creative Commons Attribution License (https://creativecommons.org/licenses/by/4.0), which permits unrestricted use, distribution, and reproduction in any medium, provided the original work is properly cited.
This article is published in open access under the Subscribe to Open model. This email address is being protected from spambots. You need JavaScript enabled to view it. to support open access publication.
All Tables
All Figures
|
Fig. 1. AGN-subtracted soft (0.5-2 keV, upper-left panel) and hard (2-7 keV, upper-right panel) band images of the Spiderweb protocluster in a field of view of ∼90 × 70 arcsec2. The blue concentric circles represent the regions within which we derived the surface brightness and correspond to an outer radius of 2, 4, 7, 10, 13, 17, and 21 arcsec, with the central blue circle showing the region where the unresolved AGN emission makes it impossible to estimate the diffuse emission. The green circles represent removed unresolved sources and the magenta boxes represent the eastern and western jet regions overlapping with the radio emission, and are excluded from our analysis since they are dominated by the diffuse, non-thermal IC emission from the jets. For the purposes of visualization, the central surface brightness is parametrized with nd = 4, as discussed in Tozzi et al. (2022). In the lower-left and lower-right panels, we show the corresponding background-subtracted surface brightness profiles computed according to Equation (1). The black bars represent the 1σ uncertainties associated with data points including the Poissonian errors on the total counts and the background expected counts. The gray-shaded area marks the value of surface brightness parametrized with nd = 4 in the first bin and the 1σ background level in the other bins. |
| In the text | |
|
Fig. 2. AGN-subtracted soft band image of the Spiderweb protocluster (left). The blue circle corresponds to 17 arcsec, while the blue lines represent the regions within which we derived the surface brightness as a function of the angle. Magenta squares and the magenta circle represent the eastern and western jet excluded regions and the central excluded AGN, respectively, while the green circles represent the excluded unresolved sources in the field of view. The average surface brightness within each wedge in the soft band is presented as a function of the angle (right). The black bars represent the Poissonian uncertainties associated with surface brightness measurements. The dotted red lines separate different quadrants. |
| In the text | |
|
Fig. 3. AGN-subtracted soft band image of the Spiderweb protocluster (left). The blue concentric circles, which correspond to 2, 4, 7, 10, 13, and 17 arcsec, and the blue lines separate the quadrants within which we derived the surface brightness as a function of the angle. Magenta squares represent the eastern and western jet excluded regions, while the green circles represent the excluded unresolved sources in the field of view. Surface-brightness profiles as a function of the distance from the central radio source (right). The gray-shaded area represents the surface brightness values parametrized with nd. |
| In the text | |
|
Fig. 4. Best fit of the surface brightness profile in the soft band for nd = 4 as a function of the distance from the AGN, shown as the solid red line, considering the extraction from the annular regions in Figure 1 (top panel). The X-ray surface brightness is shown with solid dots and associated error bars. Data points are the same as in Figure 1. Fit residuals are given in the bottom panel. |
| In the text | |
Current usage metrics show cumulative count of Article Views (full-text article views including HTML views, PDF and ePub downloads, according to the available data) and Abstracts Views on Vision4Press platform.
Data correspond to usage on the plateform after 2015. The current usage metrics is available 48-96 hours after online publication and is updated daily on week days.
Initial download of the metrics may take a while.