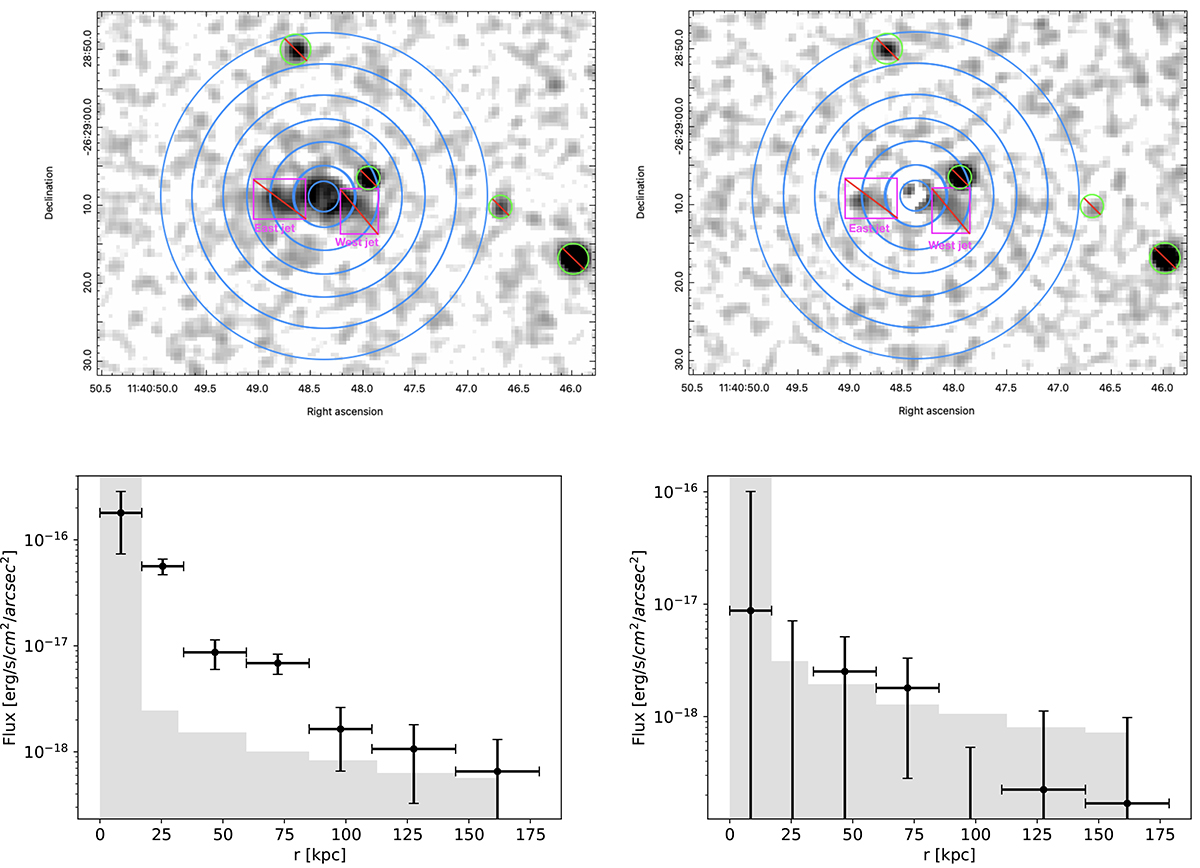
Fig. 1.
Download original image
AGN-subtracted soft (0.5-2 keV, upper-left panel) and hard (2-7 keV, upper-right panel) band images of the Spiderweb protocluster in a field of view of ∼90 × 70 arcsec2. The blue concentric circles represent the regions within which we derived the surface brightness and correspond to an outer radius of 2, 4, 7, 10, 13, 17, and 21 arcsec, with the central blue circle showing the region where the unresolved AGN emission makes it impossible to estimate the diffuse emission. The green circles represent removed unresolved sources and the magenta boxes represent the eastern and western jet regions overlapping with the radio emission, and are excluded from our analysis since they are dominated by the diffuse, non-thermal IC emission from the jets. For the purposes of visualization, the central surface brightness is parametrized with nd = 4, as discussed in Tozzi et al. (2022). In the lower-left and lower-right panels, we show the corresponding background-subtracted surface brightness profiles computed according to Equation (1). The black bars represent the 1σ uncertainties associated with data points including the Poissonian errors on the total counts and the background expected counts. The gray-shaded area marks the value of surface brightness parametrized with nd = 4 in the first bin and the 1σ background level in the other bins.
Current usage metrics show cumulative count of Article Views (full-text article views including HTML views, PDF and ePub downloads, according to the available data) and Abstracts Views on Vision4Press platform.
Data correspond to usage on the plateform after 2015. The current usage metrics is available 48-96 hours after online publication and is updated daily on week days.
Initial download of the metrics may take a while.