Fig. 3.
Download original image
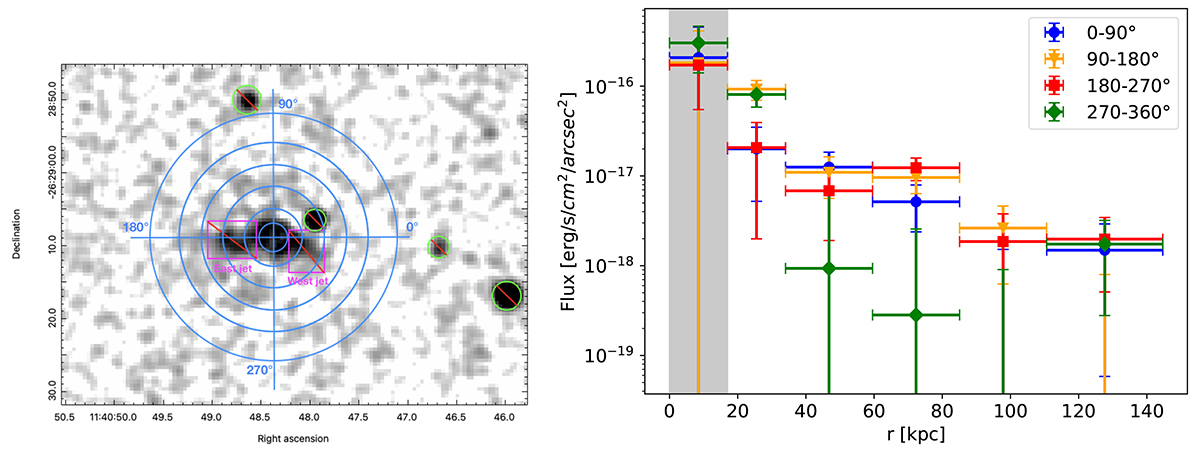
AGN-subtracted soft band image of the Spiderweb protocluster (left). The blue concentric circles, which correspond to 2, 4, 7, 10, 13, and 17 arcsec, and the blue lines separate the quadrants within which we derived the surface brightness as a function of the angle. Magenta squares represent the eastern and western jet excluded regions, while the green circles represent the excluded unresolved sources in the field of view. Surface-brightness profiles as a function of the distance from the central radio source (right). The gray-shaded area represents the surface brightness values parametrized with nd.
Current usage metrics show cumulative count of Article Views (full-text article views including HTML views, PDF and ePub downloads, according to the available data) and Abstracts Views on Vision4Press platform.
Data correspond to usage on the plateform after 2015. The current usage metrics is available 48-96 hours after online publication and is updated daily on week days.
Initial download of the metrics may take a while.