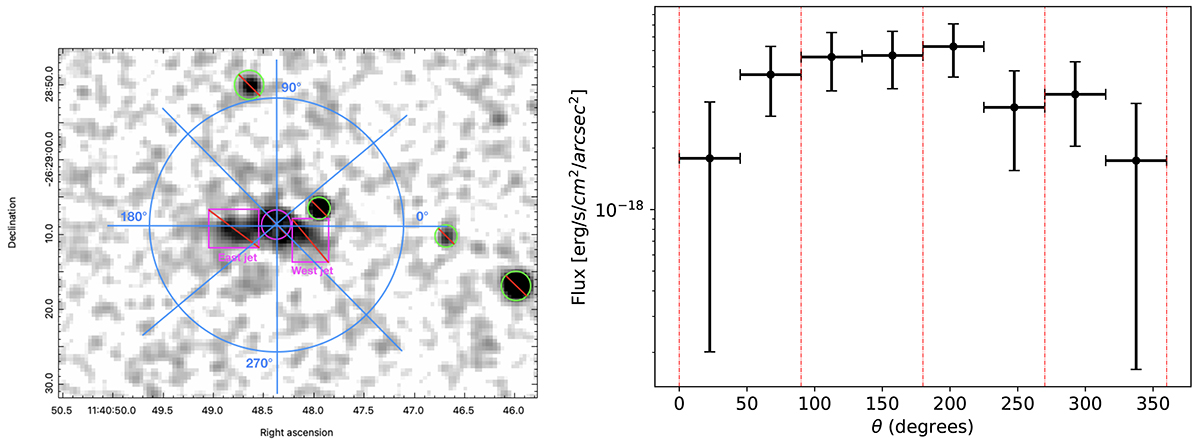
Fig. 2.
Download original image
AGN-subtracted soft band image of the Spiderweb protocluster (left). The blue circle corresponds to 17 arcsec, while the blue lines represent the regions within which we derived the surface brightness as a function of the angle. Magenta squares and the magenta circle represent the eastern and western jet excluded regions and the central excluded AGN, respectively, while the green circles represent the excluded unresolved sources in the field of view. The average surface brightness within each wedge in the soft band is presented as a function of the angle (right). The black bars represent the Poissonian uncertainties associated with surface brightness measurements. The dotted red lines separate different quadrants.
Current usage metrics show cumulative count of Article Views (full-text article views including HTML views, PDF and ePub downloads, according to the available data) and Abstracts Views on Vision4Press platform.
Data correspond to usage on the plateform after 2015. The current usage metrics is available 48-96 hours after online publication and is updated daily on week days.
Initial download of the metrics may take a while.