| Issue |
A&A
Volume 691, November 2024
|
|
|---|---|---|
| Article Number | A2 | |
| Number of page(s) | 13 | |
| Section | Planets and planetary systems | |
| DOI | https://doi.org/10.1051/0004-6361/202451183 | |
| Published online | 25 October 2024 | |
Population of excited levels of Fe+, Ni+, and Cr+ in exocomets’ gaseous tails
Institut d’Astrophysique de Paris, CNRS, UMR 7095, Sorbonne Université,
98 bis boulevard Arago,
75014
Paris,
France
★ Corresponding author; vrignaud@iap.fr
Received:
19
June
2024
Accepted:
20
September
2024
The star β Pictoris is widely known for harbouring a large population of exocomets, which create variable absorption signatures in the stellar spectrum as they transit the star. Although the physical and chemical properties of these objects have long been elusive, the recently developed exocomet curve of growth technique has, for the first time, enabled estimates of exocometary column densities and excitation temperatures, based on absorption measurements in mutliple spectral lines. Using this new tool, we present a refined study of a β Pic exocomet observed on December 6, 1997 with the Hubble Space Telescope. We first show that the comet’s signature in Fe II lines is well explained by the transit of two gaseous components, with different covering factors and opacities. Then, we show that the studied comet is detected in the lines of other species, such as Ni II and Cr II. These species are shown to experience similar physical conditions as Fe II (same radial velocity profiles and same excitation temperatures), hinting that they are well mixed. Finally, using almost 100 Fe II lines rising from energy levels between 0 and 33 000 cm–1, we derive the complete excitation diagram of Fe+ in the comet. The transiting gas is found to be populated at an excitation temperature of 8190 ± 160 K, very close to the stellar effective temperature (8052 K). Using a model of radiative and collisional excitation, we show that the observed excitation diagram is compatible with a radiative regime, associated with a close transit distance (≤60 R⋆ ∼ 0.43 au) and a low electronic density (≤107 cm–3). In this regime, the excitation of Fe+ is controlled by the stellar flux, and does not depend on the local electronic temperature or density. These results allow us to derive the Ni+/Fe+ and Cr+/Fe+ ratios in the December 6, 1997 comet, at 8.5 ± 0.8 ⋅ 10–2 and 1.04 ± 0.15 ⋅10–2, respectively, close to solar abundances.
Key words: techniques: spectroscopic / comets: general / stars: individual: Beta Pictoris
© The Authors 2024
 Open Access article, published by EDP Sciences, under the terms of the Creative Commons Attribution License (https://creativecommons.org/licenses/by/4.0), which permits unrestricted use, distribution, and reproduction in any medium, provided the original work is properly cited.
This article is published in open access under the Subscribe to Open model. Subscribe to A&A to support open access publication.
1 Introduction
The star β Pic is a young (20 Myr, Miret-Roig et al. 2020) nearby star, embedded in a large debris disc seen edge-on and detected through spectroscopy (Vidal-Madjar et al. 1986; Roberge et al. 2006; Brandeker et al. 2016) and imagery (Smith & Terrile 1984; Apai et al. 2015). Two massive planets were also discovered, βPic b (Lagrange et al. 2010; Snellen & Brown 2018) and β Pic c (Lagrange et al. 2019; Nowak et al. 2020). Thanks to these features, the β Pic system offers a unique opportunity to investigate a young planetary system in the last stages of planetary formation.
In addition to the disc and the two planets, β Pic is also well known for harbouring many exocomets, frequently transiting the star (Vidal-Madjar et al. 1998). These objects are the analogues of comets in our own Solar System; that is, icy bodies on highly eccentric orbits, whose surfaces sublimate when approaching periastron, producing extended gaseous and dusty tails. When the cometary tails happen to transit their host star, they become detectable, using either spectroscopy (Ferlet et al. 1987; Beust et al. 1990; Vidal-Madjar et al. 1994; Kiefer et al. 2014b; Kennedy 2018) or photometry (Zieba et al. 2019; Pavlenko et al. 2022; Lecavelier des Etangs et al. 2022). Although such objects have been detected around many other stars, such as 49 Cet (Roberge et al. 2014; Miles et al. 2016), HD 172555 (Kiefer et al. 2014a, 2023), KIC 8462852 (Kiefer et al. 2017), and KIC 3542116 (Rappaport et al. 2018), β Pic is by far the system showing the most intense exocometary activity, which is easily observable thanks to the favourable orientation of the disc and the close proximity of the star. As a result, this system allows an in-depth study of the role played by small bodies in the evolution of planetary systems as a whole: for instance, the presence of cold CO within the circumstellar disc has been linked to the continual evaporation of icy comets (Vidal-Madjar et al. 1994; Jolly et al. 1998; Roberge et al. 2000).
However, despite decades of observations, the physical properties of β Pic exocomets remain widely unknown, as most previous studies were focussed on confirming that the observed spectroscopic events are indeed due to transiting exocomets (Lagrange-Henri et al. 1989; Beust & Tagger 1993; Vidal- Madjar et al. 1994) or developing numerical simulations (Beust et al. 1990). Almost no direct measurements of exocometary properties were ever published, with the notable exceptions of the works by Mouillet & Lagrange (1995), which provided lower limits for the electronic temperature and density within a β Pic transiting exocomet, and by Kiefer et al. (2014b), which revealed the presence of two exocomet families around β Pic with different evaporation efficiencies and orbital properties. More recently, Lecavelier des Etangs et al. (2022) also showed that the size distribution of cometary nuclei in the β Pic system is consistent with observations in the Solar System.
With the aim of studying the physical properties of exocomets in greater detail, Vrignaud et al. (2024) recently introduced the exocomet curve of growth technique. The gist of this technique is to combine multiple observations of a transiting comet in many (~10–100) spectral lines, in order to link the comet’s absorption depth in a given line to the intrinsic properties of the line (oscillator strength, lower-level energy…). This relationship (or curve of growth) encapsulates the physical properties of the comet (e.g. covering factor, optical thickness), which can thus be inferred through model fitting. Applying this approach to the Fe II absorption lines of a β Pic exocomet observed on December 6, 1997 with the Hubble Space Telescope (HST), Vrignaud et al. (2024) obtained estimates of the comet’s covering factor (∼36%), Fe+ column density (∼1015 cm–2), and Fe+ excitation temperature (∼10 000 K). The objective of the present study is to refine the analysis of this comet and to provide a more accurate description of its physical properties. In particular, we aim to extend the analysis to species other than Fe+ (e.g. Ni+ , Cr+), and to use the observed excitation diagrams to constrain the comet density and distance to the star.
The present paper is divided as follows: the HST spectra used in our study are presented in Sect. 2; the complete Fe II curve of growth of the December 6, 1997 comet is analysed in Sect. 3; other metallic species are discussed in Sect. 4; and the excitation diagram of Fe+ is compared with an excitation model in Sects. 5. We then discuss our results and conclude in Sects. 6 and 7.
2 Studied observations
2.1 Selected data
Our study is based on archival UV spectra of β Pictoris obtained with the Space Telescope Imaging Spectrograph (STIS) on board the HST. The STIS data were collected within four different guest-observer programs, at 11 separate epochs, using the high-resolution echelle gratings E140H and E230H (R ~ 114 000~2.6 km/s). Basic information on these observations is gathered in Table B.1. The different datasets cover various wavelength domains, although the two 1997 visits (on December 6 and December 19) are unique among all the β Pic observations ever made with HST as they cover the entire range from 1500 to 2900 Å. The data were processed using version 3.4.2 of the calstis pipeline released on January 19 2018, which provides 1D flux-calibrated spectra publicly available in the MAST archive. The wavelengths were calibrated in the heliocentric reference frame.
2.2 Data reduction
We reduced the HST/STIS spectra using a method very similar to that of Vrignaud et al. (2024). First, all spectral orders from each exposure were resampled on a common wavelength table with a resolution of 18 mÅ, and averaged into a single spectrum (taking advantage of the overlap between orders). The spectra were also corrected from the radial motion of β Pic (20 km/s, Gontcharov (2007). Then, to correct for variation in the flux calibration between one exposure and another, we used cubic splines to renormalise our data to a common flux level. The method is described in Vrignaud et al. (2024); the gist here is to calculate a cubic spline for each spectrum based on flux measurements on stable spectral regions, and then to divide each spectrum by its corresponding spline. Fig. 1 from Vrignaud et al. (2024) provides a complete description of this flux correction method. Finally, each set of spectra collected during the visits of December 6, 1997, December 19, 1997, and August 26, 2001 was averaged into a single spectrum, since no significant temporal variation was detected between the different sub-exposures of each visit.
As a result, the HST/STIS data studied in the following analysis consist of 11 individual β Pic spectra obtained at different epochs, renormalised to a common flux continuum, and covering various wavelength domains between 1500 and 3000 Å. This region includes a large set of spectral lines from various species, such as Fe+ , Cr+ , and Ni+ .
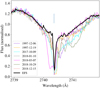 |
Fig. 1 Available β Pic STIS observations of the 2740 Å Fe II line. The black line shows the recovered EFS. Broad, deep exocometary absorptions are visible at all epochs. The central absorption is due to the circumstellar gas; since this absorption is stable in time, it can be included in the reference spectrum. |
2.3 The exocomet-free spectrum
Because of the high rate of exocometary transits in front of β Pic (Kiefer et al. 2014b), all STIS spectra show strong cometary absorption in many spectral lines, in particular in the Fe II lines series at 2400, 2600, and 2750 Å. However, to make quantitative measurements on these absorptions, one must first recover the exocomet-free spectrum (EFS) of β Pic.
The EFS was calculated using the same method that is described in Vrignaud et al. (2024). First, we identified, for each visit, the lines affected by cometary absorptions, and the radial velocity (RV) domains at which these absorptions occur. This identification was done by studying strong Fe II lines with many available observations (e.g. 2740 Å, Fig. 1). Thanks to this identification, we could then predict, for each wavelength pixel, which spectra are affected by cometary absorption and which ones are not. The unocculted flux of β Pic was thus recovered by averaging, for each wavelength, all the spectra for with no comet absorption is expected.
The RV ranges in which each visit shows cometary absorption are provided in Table B.1. These ranges apply to the strongest Fe II lines (e.g. 2740 Å); for weaker lines, slightly smaller RV ranges were often used, in order to improve the signal-to-noise ratio (S/N) of the EFS. For the lines for which very few observations are available (such as the 2400 and 2600 Å Fe II lines series, observed only three times with STIS), it is often not possible to recover the EFS at all RVs. This inability remains a challenging obstacle to the systematic analysis of all the cometary features detected in the HST data.
2.4 The December 6, 1997 comet
The December 6, 1997 exocomet already studied by Vrignaud et al. (2024) is particularly rich in information, for several reasons. First, its absorption is rather strong, and noticeably red- shifted (between 10 and 50 km/s). It is thus not blended with the strong, narrow circumstellar absorption near 0 km/s (Fig. 1), which makes the study easier. Second, the December 6, 1997 spectrum covers an extensive wavelength range, between 1500 and 3000 Å, providing access to hundreds of spectral lines of interest, such as the Fe II lines series at 2400, 2600, and 2750 Å. Finally, the other spectrum taken two weeks later in 1997 (on December 19, covering the same wavelength range) is not polluted by exocomet absorption between 20 and 50 km/s. This guarantees that, for any line where the December 6, 1997 comet is observed, the recovery of the stellar comet-free spectrum is possible, at least in the [+20, +50] km/s RV range. Two examples of Fe II lines in which the December 6, 1997 comet shows strong absorption are shown in Figs. 2 and 3, along with the recovered EFS.
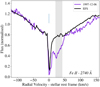 |
Fig. 2 Spectrum of β Pic obtained on December 6, 1997, along with the EFS, around the 2740 Å Fe II line. The shaded area indicates the RV domain (21–42 kms-1) used to measure the December 6, 1997 comet’s absorption depth in Sects. 3–6. |
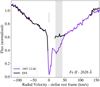 |
Fig. 3 Spectrum of β Pic obtained on December 6, 1997, along with the EFS, around the 2626 Å Fe II line. The grey area emphasises the same RV domain as in Fig. 2. Here, the estimate of the EFS is incomplete, due to the low number (2) of available observations in this line. |
3 A refined curve of growth model
3.1 The original model
Presented in Vrignaud et al. (2024), the curve of growth technique is an efficient tool to retrieve the physical properties of a transiting comet from absorption measurements in a large number of lines from a given species (such as Fe+) with various oscillator strengths and excitation energies. The model introduced in Vrignaud et al. (2024) is a one-zone model, which approximates a given comet by a homogeneous gaseous cloud, covering a fraction, α, of the stellar disc, and characterised by a uniform excitation temperature, T. Under this hypothesis, the comet absorption depth, abslu, in any spectral line of the studied species, is given by (see Vrignaud et al. 2024 for details)
 (1)
(1)
where the l and u indexes denote the lower and upper energy levels of the line, λlu, flu, gl, and El its wavelength, oscillator strength, lower-level multiplicity, and lower-level energy, kB the Boltzmann constant, and where the model parameters  , γ, and T (in bold) represent, respectively, the average covering factor, typical optical thickness, and excitation temperature of the transiting gas. These parameters are specific to the studied chemical species (e.g. Fe+) and to the RV range in which the comet’s average absorption depths are measured. The wavelength, λ0, can be chosen arbitrarily; in the following we shall fix its value to the wavelength of the 2756 Å Fe II line, as in Vrignaud et al. (2024).
The key of Eq. (1) is that it holds for any line of the studied species (e.g. Fe+). Fitting this model to the comet absorption depths, abslu, measured in a great number of lines can thus provide accurate estimates of the gas physical properties, including its average covering factor ( ) in the studied RV range, the excitation temperature of the studied species (T), and its column density (through the estimate of γ). For instance, the study of Vrignaud et al. (2024) yielded
  , T = 10 500 ± 500 K, and γ = 4.72 ± 0.25 for the December 6, 1997 comet, allowing the authors to constrain its Fe II column density in the [+25,+40] km/s range to 6.7 ± 0.4 ⋅ 1014 cm–2. However, these estimates were obtained by fitting only weak Fe II lines (gl flu < 0.7): a discrepancy was noticed for the very strongest lines (gl flu ≥ 0.7), in which the absorption of the December 6, 1997 comet is much deeper than was predicted by the extrapolation of the curve of growth.
To illustrate this discrepancy, we fitted again the original curve of growth model (Eq. (1)) to the December 6, 1997 comet absorption depths in 63 Fe II lines, with wavelengths between 2249 and 2769 Å. This set includes all lines from the three main line series at 2400, 2600, and 2750 Å, except those mixed in intricate multiplets (e.g. 2750 Å triplet) or close to very strong lines (e.g. 2599 Å line, blended with the strong 2600 Å line). They arise from rather low excitation levels (El ≤ 12 000 K), but have very diverse 𝑔f values, ranging from 0.01 for the weakest lines to 3.20 for the strongest 2382 Å line.
Other Fe II lines at shorter wavelength (e.g. 1608 or 1702 Å, in which the December 6 comet is also detected) were not included in the fit, because the stellar flux is rather weak in these lines (resulting in a much poorer S/N on absorption measurements), and because the oscillator strengths are poorly determined (see the NIST database, Kramida et al. 2023). The full list of studied lines is provided in Table D.1; they can also be visualised from the full stellar spectra (Fig. G.1).
The comet’s absorption depths were measured in the [+21, +42]km/s RV range, where the strongest absorption occurs. This range is slightly increased compared to Vrignaud et al. (2024), in order to improve the S/N in the weakest lines (Fe II, Cr II). Uncertainties on the absorption depths were calculated taking into account photon noise (generally ∼1%) and systematic errors introduced by our reduction algorithm (∼1%).
As is shown in Fig. 4, the agreement between the curve of growth model given by Vrignaud et al. (2024) and the December 6, 1997 comet absorption depths is rather poor (reducedχ2 of 5.01). The comet is found to have very strong absorptions in both the weakest lines ( ) and the strongest (
 ), well above the best-fit model. Here, the comet’s covering factor is constrained to be about 50% of the stellar disc, but, as has already been noted by Vrignaud et al. (2024), the observed absorption depths in the very strongest lines hint that the comet actually covers a greater stellar area. We also note that the fit constrains the Fe+ excitation temperature to be 10 150 ± 350 K, similar to the value found in Vrignaud et al. (2024).
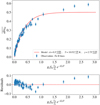 |
Fig. 4 Curve of growth analysis of the December 6, 1997 comet in FeII lines, using a single-component model. Top: curve of growth of Fe II lines. The blue dots indicate the measured absorption depth in 63 Fe II lines, while the red line shows the best-fitting one-component model. Bottom: residuals of the previous fit. A clear remaining trend is visible in the data, hinting that the fit could be improved in order to retrieve more information from the comet’s absorption spectrum. |
3.2 Two-component model
As is shown by Fig. 4, the whole set of absorption measurements in the December 6, 1997 comet is poorly described by a one-component model. To better understand the geometry of the transiting comet, it is useful to perform the previous fit again, but this time focusing on limited subsets of lines. For instance, Fig. 5 provides the comet’s curve of growth in the 24 weakest Fe II lines (absorption depth below 14%, top panel) and in the 11 strongest ones (absorption depth above 34%, bottom panel). Both curves of growth were fitted using the one-component model (Eq. (1)).
The comparison between the two fits shows that, while the measured excitation temperatures are similar (∼9000 K), the covering factors (α=16±2% in weak lines and α =57±1% in strong lines) and optical thicknesses (γ=20 and 1.8) are very different. This hints that the column density distribution within the comet is not homogeneous: a small part of the comet appears to be very dense (γ >> 1), resulting in a rapid increase in the absorption depth in the weakest lines (top panel), while the remaining part of the comet seems to be larger but much thinner, saturating at a slower pace (γ ∼ 1, bottom panel).
To better fit the December 6, 1997 comet’s absorption depths, we have developed a two-component model for the curve of growth. This new model describes a given transiting comet as such:
The gaseous cloud is characterised by a total covering factor,
 , averaged over the RV range where the cometary absorption depths are measured;
The cloud is described by two components: a dense core and a more extended thinner envelope. The sizes of these two components are parameterised by the core component covering factor,
 ;
;The excitation temperature of the studied species (T) is assumed to be uniform within the whole cloud;
The optical thickness ratio between the external and core components is denoted as γe/γc;
Finally, the total column density of the studied species (e.g. Fe+) is parameterised by its optical thickness in the core component, γc.
This new model thus has five parameters (highlighted in bold font). It should be noted that only the last one (γc) is completely specific to the considered species; the same value for the first four parameters can be used simultaneously for several species if their excitation temperatures and spatial distributions are the same. The chosen parameterisation leads to the following expression for the absorption depth in a given spectral line:
 (2)
(2)
with τc, lu and τc, lu the line optical thicknesses in the core and external components:

and with  the covering factor and γe the characteristic optical thicknesses of the external component, easily expressed as a function of the model parameters:

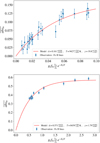 |
Fig. 5 Curve of growth of Fe II lines in the December 6, 1997 comet, focussing only on the weakest lines (top, absorption below 14%) and the strongest lines (bottom, absorption above 34%). The curves were fitted with the one-component curve of growth model (Eq. (1)). |
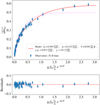 |
Fig. 6 Same Figure as 4, but this time the absorption depths of the December 6, 1997 comet were fitted with a two-component curve of growth model (red). The dotted purple line indicates the singlecomponent model fitted in Fig. 4. The agreement between the data and the model is much better with the two-component model. |
3.3 Fit
The two-component model was tested on the December 6, 1997 comet, using the same set of Fe II lines as in Sect. 3.1 (i.e. 62 lines rising from the 2400, 2600, and 2750 Å series) and the same RV range ([+21, +42] km/s). The result of the fit is presented in Fig. 6; the agreement between the measured average absorption depths and the two-component model is a lot better than with a single component (reduced χ2 of 1.08, compared to 5.01 for Fig. 4). Here, the total covering factor of the comet is constrained to 58.4±1.4 %, which is significantly higher than the value obtained with the one-component model (50%). This total size is then distributed into a dense component, covering about 12% of the stellar disc surface and getting rapidly saturated (γc∼19), and a thinner one, covering 46% of the stellar disc and with a much lower optical thickness (γe = γc ⋅ (γe/γc) ~ 1.35, about 14 times fainter than the core component). These values are consistent with the rough estimates from Fig. 5, obtained by fitting the one-component model to restricted samples of lines.
We note that it is difficult to know whether the two gaseous components identified in the December 6, 1997 spectrum actually belong to the same inhomogeneous cometary tail or correspond to two different comets with different covering factors and optical thicknesses, but similar RVs. In the following, we adopt the first hypothesis and carry on referring to the ‘December 6, 1997 comet’; however, one should keep in mind that the studied object is probably fairly complex and could actually be better described as a string of cometary nuclei.
Using the fitted parameters from the two-component curve of growth model, it is possible to estimate the Fe+ column density within the December 6, 1997 comet, averaged above the whole stellar surface, through (see Vrignaud et al. 2024, for details)
 (3)
(3)
This quantity depends on the studied RV range, [v1, v2]. For the RV range [+21, +42] km/s, we find Ntot = 5.0 ± 0.4 ⋅ 1014 cm–2. For comparison, Vrignaud et al. (2024) estimated a Fe+ column density of ∼6.7 ⋅ 1014 cm–2, in a similar RV range ([+25,+40] km/s). However, this last value corresponds to the Fe+ column density within the cometary tail, found to cover 36% of the stellar surface. Converting this column density into the average Fe+ column density above the whole stellar disc, we get a value of ∼2.4 ⋅ 1014 cm–3, far below our current estimate. The omission of a dense component in the study of Vrignaud et al. (2024) thus led to a significant underestimation of the Fe+ column density in the transiting comet.
3.4 Excitation diagram
The fit of the curve of growth with a two-component model constrains the Fe+ excitation temperature in the December 6, 1997 comet to be 8530±300 K (Fig. 6). To better visualise this excitation temperature, it is convenient to build the excitation diagram of Fe+. This diagram is obtained using the fact that, once the comet geometry is constrained, there is, for each line, a direct relationship between the Boltzmann factor, e-El/kBT, and the comet absorption depth, abslu(Eq. (2)). This relation can be written as

where the function, φlu, depends on the comet geometry  and on the line properties (gl flu, λlu). If the gas follows a Boltzmann distribution, we have
  . Inverting – numerically – the above equation, we see that each absorption measurement in a given line provides an estimate of the abundance of its lower level, l, through
 (4)
(4)
It can then be shown that this equation still provides a good estimate of  , even if the transiting gas is not perfectly following a Boltzmann distribution, as long as Eq. (3) holds.
The excitation diagram of Fe+ in the December 6, 1997 comet is shown in Fig. 7. Since a given energy level can be probed by several lines independently (Table D.1), all abundance measurements from lines rising from the same energy level were averaged altogether. Despite a few outliers (most notably the ground level), the data points are fairly well aligned with the model. The excitation temperature (inversely proportional to the slope) is here constrained to be T =8530±300 K, significantly lower than the value obtained with the one-component model (T ∼ 10 150 K, Sect. 3.1). Given the much better fit quality for the two-component model, this new value is probably a better estimate of the excitation temperature of low-lying (El ≤ 12 000 K) Fe+ levels in the studied comet.
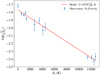 |
Fig. 7 Excitation diagram of Fe+ in the December 6, 1997 comet, derived after fitting the two-component curve of growth model. Each blue dot shows the relative abundance of one excitation level, normalised by its multiplicity, gl. The solid red line shows the Boltzmann distribution at T = 8530 K. |
4 Study of other species
The analysis of the December 6, 1997 comet’s absorption signatures in Fe II lines now seems rather satisfactory: the comet is well fitted by a two-component curve of growth model, yielding a total covering factor of ∼58% and an excitation temperature of ∼8500 K. However, the December 6, 1997 comet is also detected in Si II, Ni II, MnII , and CrII lines (see Figs. C.1–C.3). As of now, we still have no insight into whether all these species are well mixed (i.e. their spatial distributions are all the same) or whether they have completely different behaviours due, for instance, to different radiation pressures or production mechanisms. The goal of this section is to address this question.
4.1 Similar absorption profiles in Ni, Mn, Si, and Cr lines
Figs. C.1 and C.2 show βPic lines from various ions (Fe II, Ni II, Mn II, Si II), observed on December 6 and December 19, 1997. Since a slight change in shape for the December 6, 1997 comet’s absorption profile is observed between the two orbits of the December 6, 1997 HST visit, we restrained the comparison between lines observed within the same orbit.
The studied comet is clearly detected in all lines, with a very similar absorption profile: no matter the species, the absorption always spans from ∼10 to ∼50 km/s and exhibits a sharp maximum near 22 km/s (which is particularly visible in Fe II and Ni II, thanks to a stronger absorption). The main difference between species is the depth of the absorption, due to weaker line strength (Si II) or elemental abundances (Mn II). Despite a much fainter absorption depth, Cr II is also detected at similar RVs (Fig. C.3).
Overall, this comparison hints that exocometary species tend to stay ‘mixed’ in gaseous tails, keeping the same spatial and velocity distributions. This may appear puzzling, as the observed species have very different radiation pressure to gravity ratios (0.15 for Si II, 1.39 for Ni II, 4.87 for FeII and 11.0 for Mn II, Lagrange et al. 1998), and should therefore have different dynamics. This mixing is probably due to the high ionisation of the gas, which leads the detected species to efficiently exchange momentum via Coulomb scattering (as suggested in Beust et al. 1989) and couples their dynamics. In this scenario, the transiting gas would act as a single fluid, subject to a radiation pressure with contributions from all different ions.
4.2 The excitation temperature of Ni+ and Cr+
The Ni II and Cr II lines are particularly interesting, as they are fairly numerous (more than 15 lines each) and rise from a wide range of excitation levels, with energies from 0 to 15 000 cm–1 for Ni II and from 0 to 12 000 cm–1 for Cr II. Fitting the curves of growth of the two species, it is therefore possible to estimate their excitation temperatures in the December 6, 1997 comet.
To perform these two fits, we assumed that the comet geometry constrained in Sect. 3.3 for Fe+ also applies to Ni+ and Cr+, as is suggested by the similarity of the absorption profiles (Sect. 4.1). We thus fitted the two-components curve of growth model to the Cr II and Ni II absorption depths of our studied comet, imposing Gaussian priors on  , and γe/γc accordingly to the results of Sect. 3.3. For each of the two species, the remaining free parameters were thus γc – linked to the typical opacity of the studied species within the comet – and T, its excitation temperature. The studied lines are listed in Table D.2 for Cr II and D.3 for Ni II. They can also be visualised through the full β Pic spectrum provided in Fig. G.1.
The results of the two fits are presented in Figs. 8 and 9, respectively. The curve of growth of Ni+ in the December 6, 1997 comet appears to be consistent with the geometrical parameters  and γe/γc - found for Fe+. This validates our hypothesis that the many chemical species detected in this comet are well mixed and have similar spatial distributions above the stellar disc. For Cr II, the measured absorption depths are very low (a few%), and very likely optically thin. As a result, they do not allow one to compare the shape of the December 6, 1997 comet’s curve of growth in Cr II and Fe II lines.
In addition, the excitation temperatures measured for Ni+ ( ) and Cr+ (
 ) are found to be similar to that of Fe+ (8530±300 K). Again, this suggests that the three species are well mixed in the transiting tail, and experience similar physical conditions. These shared dynamics among all detected ions are a key feature of β Pic exocomets, as they could allow us to derive exocometary abundance ratios based on a direct comparison between lines from different species. This point will be discussed in greater detail below, in Sect. 6.2.
5 Excitation model
In Sects. 3 and 4, we showed that the excitation temperatures of Fe II, Ni II , and Cr II in the gaseous tail of the December 6, 1997 comet are all similar, close to ≈9000 K. To interpret this result, Vrignaud et al. (2024) propose that the transiting gas follows a collisional regime, associated with a high-enough electronic density (ne ~ 107 cm−3). Here, we explore alternative scenarios, investigating the role played by radiative processes in the excitation of Fe+.
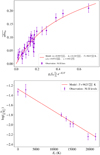 |
Fig. 8 Curve of growth analysis of the December 6, 1997 comet in Ni II lines. Top: curve of growth of Ni II lines. Purple dots indicate the measured absorptions for 33 Ni II lines in the [+21, +42] km/s range, and the red line shows the best-fitting two-component model. Bottom: excitation diagram of Ni+ (same legend as in Fig. 7.) |
5.1 Complete excitation diagram of Fe+
Until now, we focussed on lines rising from rather weakly excited energy levels of Fe II, Ni II , and Cr II (El ≤ 20 000 K). However, as has already been noted in Vrignaud et al. (2024), the December 6, 1997 comet is also detected in large number of Fe II lines rising from much more energetic levels (between 23 000 and 47 000 K). The comet’s absorption depth in these lines is often very low (typically between 0 and 10%, much less than in the three main Fe II series at 2400, 2600, and 2750 Å), but, when combined, they can provide valuable information on the population of highly excited levels of Fe II.
Using these lines and those studied in Sect. 3, we performed a joint fit of the December 6, 1997 comet’s absorption depths in 96 Fe II lines, with wavelengths between 1700 and 2800 Å and lower level energies ranging from 0 to 47 000 K (see Table D.1). This set of lines includes 63 lines rising from low-lying Fe II states (El ≤ 12000 K), already studied in Sect. 3.3, and 33 additional lines rising from much higher excitation levels (El = 23 000–47 000 K). To select these last lines, we focussed on strong transitions (𝑔l ⋅ flu ≥ 1.5) rising from high-multiplicity Fe II levels (𝑔l ≳ 10). The excitation diagram derived from this analysis is shown in Fig. 10. The global excitation temperature is constrained to be 8190 ± 160 K, slightly lower than the value obtained by fitting only low-level lines (8530±300 K, Sect. 3.3). This difference is due to the slight over-abundance of the a4D term (El ~ 12 000 K, see Fig. 10) compared to the fitted Boltzmann distribution, which increases the apparent excitation temperature of Fe+ when considering only low-lying levels.
Figure 10 shows that the population of Fe II excited levels in the studied comet is overall close to a Boltzmann distribution. We note, however, one clear outlier: the a6S5/2 level (El = 33 550 K) appears to be severely depleted, by a factor of ≈4, compared to levels with similar energies. This outlier is shown with a dotted turquoise error bar in Fig. 10; it was not included in the fit of the excitation temperature. The peculiarity of this Fe II level is discussed below.
Using Eq. (4) and the model parameters obtained from the curve of growth fit, we computed a new total Fe+ column density in the [+21,+42] km/s RV range of 4.8±0.3⋅1014 cm−2, which is slightly less than in Sect. 3.4. This value is probably a better estimate of the total Fe II column density, since it is based on the study of a larger number of energy levels with a wider energy range.
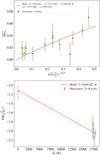 |
Fig. 9 Curve of growth analysis of the December 6, 1997 comet in lines. Top: curve of growth of Cr II lines. Green dots indicate the measured absorptions for the 17 Cr II lines in the [+21, +42] km/s range, while the red line shows the best fit with the two-component model. Bottom: excitation diagram of Cr+. |
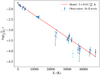 |
Fig. 10 Excitation diagram of Fe+ in the December 6, 1997 comet, built from the analysis of 96 Fe II lines rising from a wide range of energy levels (El ~ 0–33 000 cm−1 ~ 0–47 000 K). The turquoise point indicates the peculiar a6S5/2 level, which is severely depleted compared to the fitted model. |
5.2 Model
To interpret the observed excitation diagram in the December 6, 1997 comet (Fig. 10), we refined the excitation model introduced in Vrignaud et al. (2024) by including stellar radiation. We calculated the statistical equilibrium of Fe+ under various physical conditions, using a model of radiative and collisional excitation characterised by three parameters: d, the comet’s distance to the star, T, its electronic temperature, and ne, its electronic density.
The detailed equations leading to the energy level distribution of Fe+ are provided in Appendix A. In summary, the problem reduces to solving the linear system:

with X the vector containing the population ratios of all energy levels, and K a matrix depending on the model parameters (d, T, ne), on the electron collision strengths and Einstein coefficients of Fe II, and on the input stellar spectrum. The Fe II data were taken from Tayal & Zatsarinny (2018), which provides extensive calculations for transition probabilities and collision strengths of Fe II over a wide range of excitation levels (0–140 000 cm−1) and electronic temperatures (102–105 K). The stellar spectrum was obtained from the PHOENIX library (Husser et al. 2013), using stellar parameters close to that of β Pic (Teff = 8000 K, log(𝑔) = 4.5, [Fe/H] = 0, [α/M] = 0). The entire spectrum is shown in Fig. 11; it was renormalised so that the wavelength-integrated flux matches that of a black body at Teff = 8000 K. The chromospheric emission of β Pic (Bouret et al. 2002) was not taken into account, as it is only detected in a few lines below 1300 Å (O VI, C III), very far from the main Fe II lines (2200–2800 Å).
5.3 Modelled energy distribution
Depending on the chosen model parameters (ne, T, d), the energy distribution of Fe II can take very diverse shapes.
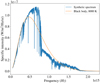 |
Fig. 11 Synthetic β Pic spectrum used in our model, along with the corresponding black body (Teff = 8000 K). |
5.3.1 Radiative regime
At low density (ne ≤ 107 cm−3) and close distances (d ≤ 60 R*), the Fe+ gas follows a radiative regime (Fig. E.1). Under this regime, the excitation temperature of low-energy (El ≤ 55 000 K) levels is set to the stellar effective temperature, Tex = Teff = 8000 K, while more excited levels (El ≥ 55 000 K) are severely depleted.
The presence of these two branches is linked to the radiative properties of Fe+: transitions between any pair of levels within each of the two branches are forbidden (Aji ~ 1 s−1), while transitions from one branch to another are often optically allowed (Aji ~ 108 s−1). At low density (ne ≤ 106 cm−3), the role played by electronic collisions is negligible; as a result, spontaneous de-excitation leads the upper branch to be severely depleted (Fig. E.1).
The very close match between the Fe+ excitation temperature and the stellar effective temperature is due to the fact that all Fe+ allowed transitions are in the ultraviolet, where the stellar specific intensity is rather close to a black body, and where Wien’s approximation (hv ≫ kвT) applies:

with  (Planck function). This approximation introduces Boltzmann factors in the statistical equilibrium equation (Sect. A.3), which end up in the calculated energy distribution. More detailed calculations on this phenomenon can be found in Manfroid et al. (2021) (see the ‘Three level atom’ section).
5.3.2 Semi-collisional regime
For close distances (d ≤ 60 R*) but higher electronic densities (ne ≥ 107 cm−3), the gas enters in a semi-collisional regime: collisions start to play a significant role in the Fe+ energy distribution, particularly for the least excited levels. This regime is illustrated in Figs. E.2–E.4 for an electronic density of 108 cm−3 and various kinetic temperatures.
In the semi-collisional regime, the energy distribution of the least excited branch (El ≤ 55 000 K) is found to be a mix between a radiative regime (which would lead to Tex = Teff = 8000 K) and a fully collisional regime (leading to Tex = Te). However, a peculiar case arises when the electronic temperature happens to match the stellar effective temperature (8000 K): in this case, both collisions and radiation tend to populate Fe+ at the same excitation temperature, making their respective effects hard to disentangle (see Fig. E.4).
Increasing further the electronic density, a fully collisional regime (imposing Tex = Te) is eventually reached. Depending on the comet’s distance to the star and electronic temperature, we found that such a regime is expected for electronic densities above 1012–1016 cm−3.
5.3.3 Large-distance regime
Finally, for large comet-to-star distances (d ≥ 60 R*), the gas gradually enters a composite regime, with a more complex energy distribution. Here, forbidden transitions start to play a significant role, and lead to a depletion of all energy levels except the ground state (see Fig. E.5, for d = 280 R*). If the electronic density is sufficient (ne ≥ 104 cm−3), collisional excitation also play a significant role in the energy distribution.
5.4 Comparison with data
The lower panels of Figs. E.1–E.5 provide a comparison between the observed Fe+ excitation diagram in the December 6, 1997 comet and the outcome of our model. This first comparison shows that our observations are compatible with a radiative regime, associated with a rather low electronic density (Fig. E.1). On the other hand, the calculated energy distributions at high electronic densities and electronic temperatures different from 8000 K (Figs. E.2 and E.3) appear to be very different from the observed excitation diagram.
We also note that the severe depletion of the a6S5/2 level (shown with a turquoise marker in Appendix E) observed in the comet is well reproduced by our model in the case of a radiative regime (Fig. E.1). The explanation for the peculiar behaviour of this level is the following: while the strongest lines of most Fe II states lie in the 2300–2800 Å region (see Table D.1), the lines of the a6S5/2 level are located at 1785 Å ~ 1.7 ⋅ 1015 Hz, where the flux of β Pic is particularly strong, well above a black body (see Fig. 11). This results in a more efficient radiative pumping for the a6S5/2 level than other Fe II levels, leading the first one to be depleted. Here, the fact that such behaviour is found in our data hints that radiative processes play a prominent role in the excitation of Fe+ in the studied comet.
To more deeply explore the agreement between our measurements for the December 6, 1997 comet, and the results of our excitation model, we calculated the χ2 values of the model on a wide parameter grid, with Te ranging from 102 to 105 K, ne from 104 to 1010 cm−3, and d from 10 to 140 R* (0.07–1 au, assuming R* = 1.53 R⊙, Wang et al. 2016). The minimal χ2 value was found to be  , associated with a radiative regime or a semi-collisional regime at Te ~ Teff. With 33 energy levels included in the study, this minimal value corresponds to a reduced χ2 of
  . The set of parameters compatible with our observations (within 95%) was thus estimated using the following criterion:

with  and
and  . The resulting maps are shown in Fig. F.1, along with the
  contour. We can identify three different regimes that are a priori compatible with our observations:
A radiative regime, associated with a close comet-to-star distance (d ≤ 60 R*), a low electronic density (ne ≤ 107 cm−3), and any temperature. This regime is indicated with the letter a in Fig. F.1. In this case, the Fe II excitation temperature corresponds to the stellar effective temperature, which is what we observe in the comet;
A semi-collisional regime (letter b, Fig. F.1), associated with an electronic temperature very close to the stellar effective temperature (Te = 8000 ± 500 K) and higher electronic densities (up to 109 cm−3). In this peculiar case, both radiative and collisional processes tend to set the Fe II excitation temperature to 8000 K; the computed excitation diagram thus remains close to a purely radiative regime (Fig. E.4);
A large-distance regime (letter c), associated with electronic densities around 106 cm−3 and temperatures above 10 000 K. This case is also peculiar: here, the depletion of all excited Fe II levels due to spontaneous emission in forbidden lines happens to be exactly compensated by collisions with energetic collisions, leading the computed model to again match the observed excitation diagram.
On the other hand, our observations allow us to fully reject LTE (corresponding to the high density limit), for all values of d and Te. This is due to the observed depletion of the a6S5/2 level, which is incompatible with a Boltzmann energy distribution.
5.5 A radiative regime in the December 6, 1997 comet
Even though the three regimes mentioned above are all compatible with our data, the last two seem rather unlikely, as they correspond to fortuitous coincidences. Indeed, the semicollisional regime is possible only if the electronic temperature falls in the [7500, 8500] K range, within most of the comet. This would be rather surprising: it is hard to see why the electronic temperature would be so uniform in such a large comet and coincidental with the stellar effective temperature. In addition, the December 6, 1997 comet seems to be detected in the Al III doublet (1850 Å, see Fig. 12), which requires very high temperatures to be formed (≥40 000 K, see Beust & Tagger 1993). Here, no impact of such a high electronic temperature is seen in the excitation diagram of Fe II, pointing towards a scenario in which collisions play no significant role in the energy distribution in the comet, and in which the electronic density is therefore rather low (≤ 107 cm−3). In a similar way, the acceptable parameter space for d ≥ 60 R* is very limited (Fig. F.1), corresponding to Te ≥ 104 K and ne ≃ 106 cm−3 (when collisions with hot electrons happen to exactly compensate for the depletion of excited levels through forbidden transitions). As for the semi-collisional regime, this coincidence seems unlikely.
As a result, our analysis points towards a radiative regime in the gaseous tail of the December 6, 1997 comet, associated with a low electronic density (ne ≤ 107 cm−3) and a close distance to β Pic (d ≤ 60 R*). This conclusion is different from that of Vrignaud et al. (2024), in which the radiative excitation was not taken into account. Ultimately, it appears that the transiting gas is not at thermodynamical equilibrium, but rather that the excitation of Fe+ is controlled by the intense stellar radiation received at such a close distance to β Pic.
The upper value on the electronic density in the December 6, 1997 comet can also be compared to rough geometrical estimates. Indeed, assuming that the cometary tail has a solar composition (except for hydrogen, which we can take to be twice as abundant as oxygen) and that all elements are singly ionised, we find that the elemental abundance of Fe+ should be around 1.5%. Using this value and the Fe II column measured in the comet (~4.8 ⋅ 1014 cm−2), we get an electronic column density of ~3 ⋅ 1016 cm−2. Dividing this value by the typical size of the comet – about one stellar radius – we obtain an electronic volume density of ≈4 ⋅ 105 cm−3, which is fully compatible with our upper limit for a radiative regime.
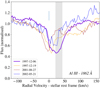 |
Fig. 12 Available β Pic spectra around the 1862 Å Al III line, with the December 6, 1997 spectrum shown in purple. Here, the strong comet absorption at all epochs makes the retrieval of an EFS difficult; however, the December 6, 1997 comet (shaded area) seems detected in this line as well (see Figs. 2, 3 and C.1 for comparisons with other species). |
6 Discussion
6.1 Dependency of Tex on radial velocity
Until now, we have assumed that the gas excitation state in the December 6, 1997 comet is homogeneous, and in particular that it does not depend on the RV. To check this hypothesis, we estimated the excitation temperature of Fe+ in the comet at different RVs, using the two-component curve of growth model and the same set of 96 Fe II lines as in Sect. 5.1. The measured excitation temperatures are provided in Fig. 13: we note that Tex remains fairly constant throughout the comet absorption profile, close to the stellar effective temperature (8052 K, Gray et al. (2006)). This confirms that the gas is in a radiative regime: the energy distribution of Fe+ is decoupled from the local properties of the gas (kinetic temperature, electronic density) and is only the result of radiative processes stimulated by the stellar luminosity. We note, however, a slight trend in the data: the global excitation temperature of Fe+ slightly increases with the RV, varying from 7800 K near 25 km/s to 9000 K at 40 km/s. To illustrate this trend, we provide in Fig. 14 the excitation diagrams of Fe II within the 21–33 km/s RV range (top panel, yielding Tex = 7940 ± 150 K) and the 33–42 km/s range (bottom panel, yielding Tex ≃ 8870 ± 330 K). The difference between the two diagrams is subtle, but it seems that some levels get slightly more populated in the most redshifted part of the comet (particularly the a4D term at 12 000 K), leading to an increase in the global excitation temperature. The origin of this deviation is unclear; we found no set of parameters (d, ne, Te) able to better reproduce the observation in the 33–42 km/s range than a simple radiative regime.
Here, it should be noted that our excitation model is simple and needs improvement. In particular, self-opacity and several gaseous components with different electronic densities and temperature could be considered. Nonetheless, it remains remarkable that a model with a uniform excitation state throughout a whole comet allows us to reproduce the observed population of Fe II levels over such a large energy range.
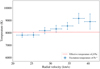 |
Fig. 13 Excitation temperature of Fe II in the December 6, 1997 comet, as a function of the RV. The temperatures were estimated by building excitation diagrams similar to Fig. 10, but based on absorption measurements in short RV bins (3 km/s width). The horizontal line emphasises the stellar effective temperature, Teff = 8052 K (Gray et al. 2006). |
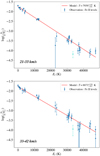 |
Fig. 14 Excitation diagram of Fe II in the December 6, 1997 comet in two different RV ranges: 21–33 km/s (top) and 33–42 km/s (bottom). The excitation temperature seems to be slightly higher in the most redshifted part of the comet, due to the increased abundance of some excited levels (e.g. the a4D term at ~12 000 K). As for Fig. 10, the a6S5/2 state was not included in the fit, as it is severely depleted compared to the other Fe II excitation levels. |
6.2 Towards abundance ratios
In Sect. 4, we showed that the December 6, 1997 comet harbours many species (Fe+ Ni+, Cr+, Mn+, Si+) with similar behaviours, probably due to efficient momentum exchange between particles via Coulomb scattering. In particular, we found that the spatial distribution of the detected species are similar: their absorptions are all seen at the same RV, and show similar shapes. We also showed that Fe+, Ni+ , and Cr+ have similar energy distributions in their low-lying levels (El ≤ 20 000 cm−1), with excitation temperatures of around 9000 K. This is very likely the result of the three species following a radiative regime, where ion excitation is dominated by radiative processes.
These results open the way for abundance estimates in exocomets. Indeed, the ion mixing in β Pic exocomets allows the use of global cometary models to fit the lines of several species simultaneously, adopting, for instance, a unique covering factor,  , for all species. Assuming that all exocometary species follow a radiative regime (as was found for Fe+, and most likely Ni+, and Cr+), it also becomes possible to predict, for any given species, the relative abundances of its excitation levels. The total column density of any absorbing species can thus be inferred from the study of a small number of lines, rising from a limited set of excitation level (e.g. the 2600 Å ground-level triplet for Mn II). As a benchmark, using Eq. (3) and the parameters constrained in Sect. 4, we estimate the total, stellar disc-averaged Ni+ and Cr+ column densities in the December 6, 1997 comet to be 4.1 ± 0.3 ⋅ 1013 cm−2 and 5.0 ± 0.6 ⋅ 1012 cm−2, respectively. Comparing these values with the one found for Fe+ in the same RV range (4.8 ± 0.3 ⋅ 1014 cm−2, Sect. 3.3), we can estimate the elemental Ni+/Fe+ and Cr+/Fe+ ratios in the December 6, 1997 comet. We find that
![$\matrix{ {\left[ {{\rm{N}}{{\rm{i}}^{\rm{ + }}}{\rm{/F}}{{\rm{e}}^{\rm{ + }}}} \right]{\rm{ = }}\,{\rm{8}}{\rm{.5}}\,\,{\rm{ \pm }}\,{\rm{0}}{\rm{.8 \times 1}}{{\rm{0}}^{ - {\rm{2}}}}{\rm{,}}} \cr {\left[ {{\rm{C}}{{\rm{r}}^{\rm{ + }}}{\rm{/F}}{{\rm{e}}^{\rm{ + }}}} \right]\,\,{\rm{ = 1}}{\rm{.04}}\,\,{\rm{ \pm }}\,\,{\rm{0}}{\rm{.15 \times 1}}{{\rm{0}}^{ - {\rm{2}}}}{\rm{.}}} \cr } $](/articles/aa/full_html/2024/11/aa51183-24/aa51183-24-eq33.png)
These ratios are rather close to the solar ratios of the corresponding elements (5.2 ⋅ 10−2 and 1.38 ⋅ 10−2 respectively, see Asplund et al. (2009)), although Ni+ seems over-abundant when compared to Fe+, while Cr+ may be slightly depleted. In any case, further work is needed to confirm these preliminary results, to extend them to other species routinely detected in exocomets (e.g. Ca II, Mn II, Si II, Al III…), and to get a complete a complete overview of the composition of exocomets.
6.3 Comparison with similar studies
Our study confirms the close transit distance of β Pic exocomets relatively to their host star: for the December 6, 1997 comet, we derive an upper limit of 60 R*, equivalent to ~0.43 au. This upper limit is in agreement with the Ca II study of Kiefer et al. (2014b), in which the typical transit distance of β Pic exocomets was estimated to be 10 ± 3 R* for the shallow family, which is associated with wide, highly redshifted absorptions, and 19 ± 4 R* for the D family, which is associated with deep, narrow absorption close to 0 km/s. It should be noted that it is unclear to which family the December 6, 1997 comet belongs, as it exhibits features from both the shallow and deep families: its absorption is rather wide (full width at half maximum of ~30 km/s) and redshifted, but also fairly deep.
The radiative regime found in the December 6, 1997 comet can also be compared to the results of Manfroid et al. (2021), for which a similar analysis was conducted on many Solar System comets using Fe I and Ni I emission lines. For all studied comets, the excitation temperature of Fe and Ni was found to be around 4000 K, close to the solar effective temperature (5800 K). Here, the slight difference between the cometary excitation temperatures and the solar effective temperature was attributed to strong absorption lines in the NUV solar spectrum. In the case of β Pic, this effect seems to be less important, thanks to the rapid stellar spin (130 km/s, Royer et al. 2007), which smooths the stellar spectrum and brings it rather close to a perfect black body. This explains why the measured excitation temperature of Fe II is so close to the effective temperature of β Pic.
However, our results seem to be in contradiction with the work of Mouillet & Lagrange (1995), who analysed the Ca II absorptions of a β Pic comet observed in 1992 and concluded in favour of a semi-collisional regime, associated with a high electronic temperature (≥ 15 000 K) and density (≥ 106 cm−3). From our perspective, this different conclusion is due to incorrect abundance estimates for the studied Ca II levels: saturation in the H and K lines was not taken into account, leading the authors to severely underestimate the column density of the ground level. A rough calculation shows that, taking saturation into account, the Ca II cometary features analysed in Mouillet & Lagrange (1995) are actually compatible with a radiative regime.
7 Conclusion
Our study has allowed us to deeply refine our knowledge of the December 6, 1997 β Pic comet, which was already studied in Vrignaud et al. (2024). First, analysing the curve of model with a two-component model, we found that the comet’s absorption signatures in Fe II lines can be satisfactorily explained by the transit of multiple gaseous components, with different optical depth and covering factors. In fact, these different components could very well be associated with several evaporating nuclei, with similar orbits following each other on a transiting string. The excitation temperature of Fe+ in the transiting comet is close to 8500 K for low-lying (El ≤ 12 000 cm−1) levels, or 8200 K if we consider a wider energy range (El ~ 0–47 000 K). Similar excitation temperatures were found for Ni+ and Cr+ (Tex ~ 9000 K). This result, along with the comparison between the comet’s absorption profiles in different lines, leads us to conclude that all exocometary species tend to stay well mixed within the gaseous tails, keeping the same spatial distribution. This mixing is probably the result of the high ionisation of β Pic exocomets, which couples the dynamics of the different species via Coulomb interaction.
Finally, the full excitation diagram of Fe+ in the December 6, 1997 comet was compared with the predictions of an excitation model, taking into account both radiative and collisional processes. This comparison shows that Fe+ very likely follows a radiative regime, associated with a low electronic density (ne ≤ 107 cm−3) and a rather close distance to β Pic (d ≤ 60 R* ~ 0.43 au). In this regime, excitation and de-excitation are dominated by stellar photon absorption and emission, leading the excitation temperature of the absorbing gas to match the stellar effective temperature (8000 K). Given the excitation diagrams observed for Cr+ and Ni+, it is very likely that these two species also follow a radiative regime.
We have also shown that the Ni+/Fe+ and Cr+/Fe+ ratios in the December 6, 1997 comet are close to solar abundances. Now that our curve of growth analysis and our model of the excitation level population enable the prediction of the energy distribution of any ion in the gaseous tails of exocomets, similar measurements could be obtained for many other species, such as Mn II, Ca II , and Si II. With such measurements, we now have for the first time the possibility to derive the typical composition of exo-comets, which could be used to provide new insights into their past history and the physical processes at play in their vicinity.
Data availability
Appendices B–G are available at: https://doi.org/10.5281/zenodo.13828957.
Acknowledgements
T.V. and A.L. acknowledge funding from the Centre National d’Études Spatiales (CNES), and thank the anonymous referee for his constructive remarks.
Appendix A Statistical equilibrium of Fe+
This section details the equations that allowed us to calculate the energy distribution of Fe+ (Sect. 5.2), depending on the physical properties of the comet (electronic density ne; electronic temperature T) and on its distance to β Pic (d).
A.1 Collisional excitation
Denoting (i, j) any pair of Fe+ excitation levels, the time variation of the level i population due to collisional excitation with level j writes:

with ni and nj denoting the levels i and j volume densities and with Cij and Cji the collisional excitation rates (in s−1 (cm−3)−1) for the i → j and j → i transitions, respectively. These coefficients, which depend on the electronic temperature, are linked by the following equation (when level i is chosen to be the lower level of the transition):

with vij the frequency associated with the i ↔ j transition. Collisional rates can also be related to the effective collision strength Υji·, through:

where  . The effective collision strength is a dimensionless parameters characterising how sensitive to collision the i ↔ j transition is. For our study, we used the values provided by Tayal & Zatsarinny (2018).
A.2 Radiative excitation
Keeping the same notation as before, the time variation of the level i volume density due to radiative interaction with level j writes:

with Aji;, Bji and Bij the Einstein coefficients for spontaneous emission, stimulated emission and photon absorption (in the case where j > i). They can all be expressed in terms of Aji, through:

As for the effective collision strengths, the Aji values of Fe II were obtained from Tayal & Zatsarinny (2018),
The stellar flux received by the comet at the transition frequency ( , expressed in W/m2/Hz) can be linked to the stellar specific intensity
  (in W/m2/Hz/sr) and to the comet-to-star distance d, by:

The spectrum used in our model (Iv) is provided in Fig. 11; it was obtained from the PHOENIX stellar library (Husser et al. 2013).
A.3 Statistical equilibrium
The statistical equilibrium condition writes  , for all i. Taking into account both collisional and radiative excitation, this condition yields, for any level i:

This last equation can be rewritten as a linear combination of (n1, n2,…, nN), with N the total number of studied excitation levels, so that:


Solving the statistical equilibrium is thus equivalent to solving the linear system KX = 0, with K = (aij)i,j and X = (n1 , n2, …, nN). Note here that matrix K is singular; only the relative densities of the different excitation levels can be constrained. The coefficients of K depend on the A-values and effective collision strengths of Fe II, on the chosen stellar spectrum, and on the model parameters, d, Te and ne.
References
- Apai, D., Schneider, G., Grady, C. A., et al. 2015, ApJ, 800, 136 [NASA ADS] [CrossRef] [Google Scholar]
- Asplund, M., Grevesse, N., Sauval, A. J., & Scott, P. 2009, ARA&A, 47, 481 [NASA ADS] [CrossRef] [Google Scholar]
- Beust, H., & Tagger, M. 1993, Icarus, 106, 42 [NASA ADS] [CrossRef] [Google Scholar]
- Beust, H., Lagrange-Henri, A. M., Vidal-Madjar, A., & Ferlet, R. 1989, A&A, 223, 304 [NASA ADS] [Google Scholar]
- Beust, H., Lagrange-Henri, A. M., Vidal-Madjar, A., & Ferlet, R. 1990, A&A, 236, 202 [NASA ADS] [Google Scholar]
- Bouret, J. C., Deleuil, M., Lanz, T., et al. 2002, A&A, 390, 1049 [NASA ADS] [CrossRef] [EDP Sciences] [Google Scholar]
- Brandeker, A., Cataldi, G., Olofsson, G., et al. 2016, A&A, 591, A27 [NASA ADS] [CrossRef] [EDP Sciences] [Google Scholar]
- Ferlet, R., Hobbs, L. M., & Vidal-Madjar, A. 1987, A&A, 185, 267 [NASA ADS] [Google Scholar]
- Gontcharov, G. A. 2007, VizieR Online Data Catalog: III/252 [Google Scholar]
- Gray, R. O., Corbally, C. J., Garrison, R. F., et al. 2006, AJ, 132, 161 [Google Scholar]
- Husser, T. O., Wende-von Berg, S., Dreizler, S., et al. 2013, A&A, 553, A6 [NASA ADS] [CrossRef] [EDP Sciences] [Google Scholar]
- Jolly, A., McPhate, J. B., Lecavelier, A., et al. 1998, A&A, 329, 1028 [NASA ADS] [Google Scholar]
- Kennedy, G. M. 2018, MNRAS, 479, 1997 [NASA ADS] [CrossRef] [Google Scholar]
- Kiefer, F., Lecavelier des Etangs, A., Augereau, J. C., et al. 2014a, A&A, 561, L10 [NASA ADS] [CrossRef] [EDP Sciences] [Google Scholar]
- Kiefer, F., Lecavelier des Etangs, A., Boissier, J., et al. 2014b, Nature, 514, 462 [Google Scholar]
- Kiefer, F., Lecavelier des Étangs, A., Vidal-Madjar, A., et al. 2017, A&A, 608, A132 [NASA ADS] [CrossRef] [EDP Sciences] [Google Scholar]
- Kiefer, F., Van Grootel, V., Lecavelier des Etangs, A., et al. 2023, A&A, 671, A25 [NASA ADS] [CrossRef] [EDP Sciences] [Google Scholar]
- Kramida, A., Yu. Ralchenko, Reader, J., & NIST ASD Team 2023, NIST Atomic Spectra Database (ver. 5.11) [Online]. Available: https://physics.nist.gov/asd [2023, December 15]. National Institute of Standards and Technology, Gaithersburg, MD [Google Scholar]
- Lagrange, A. M., Beust, H., Mouillet, D., et al. 1998, A&A, 330, 1091 [NASA ADS] [Google Scholar]
- Lagrange, A. M., Bonnefoy, M., Chauvin, G., et al. 2010, Science, 329, 57 [Google Scholar]
- Lagrange, A. M., Meunier, N., Rubini, P., et al. 2019, Nat. Astron., 3, 1135 [NASA ADS] [CrossRef] [Google Scholar]
- Lagrange-Henri, A. M., Beust, H., Ferlet, R., & Vidal-Madjar, A. 1989, A&A, 215, L5 [NASA ADS] [Google Scholar]
- Lecavelier des Etangs, A., Cros, L., Hébrard, G., et al. 2022, Sci. Rep., 12, 5855 [NASA ADS] [CrossRef] [Google Scholar]
- Manfroid, J., Hutsemékers, D., & Jehin, E. 2021, Nature, 593, 372 [Google Scholar]
- Miles, B. E., Roberge, A., & Welsh, B. 2016, ApJ, 824, 126 [NASA ADS] [CrossRef] [Google Scholar]
- Miret-Roig, N., Galli, P. A. B., Brandner, W., et al. 2020, A&A, 642, A179 [NASA ADS] [CrossRef] [EDP Sciences] [Google Scholar]
- Mouillet, D., & Lagrange, A. M. 1995, A&A, 297, 175 [NASA ADS] [Google Scholar]
- Nowak, M., Lacour, S., Lagrange, A. M., et al. 2020, A&A, 642, L2 [NASA ADS] [CrossRef] [EDP Sciences] [Google Scholar]
- Pavlenko, Y., Kulyk, I., Shubina, O., et al. 2022, A&A, 660, A49 [NASA ADS] [CrossRef] [EDP Sciences] [Google Scholar]
- Rappaport, S., Vanderburg, A., Jacobs, T., et al. 2018, MNRAS, 474, 1453 [NASA ADS] [CrossRef] [Google Scholar]
- Roberge, A., Feldman, P. D., Lagrange, A. M., et al. 2000, ApJ, 538, 904 [NASA ADS] [CrossRef] [Google Scholar]
- Roberge, A., Feldman, P. D., Weinberger, A. J., Deleuil, M., & Bouret, J.-C. 2006, Nature, 441, 724 [NASA ADS] [CrossRef] [Google Scholar]
- Roberge, A., Welsh, B. Y., Kamp, I., Weinberger, A. J., & Grady, C. A. 2014, ApJ, 796, L11 [NASA ADS] [CrossRef] [Google Scholar]
- Royer, F., Zorec, J., & Gómez, A. E. 2007, A&A, 463, 671 [NASA ADS] [CrossRef] [EDP Sciences] [Google Scholar]
- Smith, B. A., & Terrile, R. J. 1984, Science, 226, 1421 [Google Scholar]
- Snellen, I. A. G., & Brown, A. G. A. 2018, Nat. Astron., 2, 883 [Google Scholar]
- Tayal, S. S., & Zatsarinny, O. 2018, Phys. Rev. A, 98, 012706 [NASA ADS] [CrossRef] [Google Scholar]
- Vidal-Madjar, A., Hobbs, L. M., Ferlet, R., Gry, C., & Albert, C. E. 1986, A&A, 167, 325 [NASA ADS] [Google Scholar]
- Vidal-Madjar, A., Lagrange-Henri, A. M., Feldman, P. D., et al. 1994, A&A, 290, 245 [NASA ADS] [Google Scholar]
- Vidal-Madjar, A., Lecavelier des Etangs, A., & Ferlet, R. 1998, Planet. Space Sci., 46, 629 [NASA ADS] [CrossRef] [Google Scholar]
- Vrignaud, T., Lecavelier des Etangs, A., Kiefer, F., et al. 2024, A&A, 684, A210 [NASA ADS] [CrossRef] [EDP Sciences] [Google Scholar]
- Wang, J. J., Graham, J. R., Pueyo, L., et al. 2016, AJ, 152, 97 [Google Scholar]
- Zieba, S., Zwintz, K., Kenworthy, M. A., & Kennedy, G. M. 2019, A&A, 625, L13 [NASA ADS] [CrossRef] [EDP Sciences] [Google Scholar]
All Figures
|
Fig. 1 Available β Pic STIS observations of the 2740 Å Fe II line. The black line shows the recovered EFS. Broad, deep exocometary absorptions are visible at all epochs. The central absorption is due to the circumstellar gas; since this absorption is stable in time, it can be included in the reference spectrum. |
| In the text | |
|
Fig. 2 Spectrum of β Pic obtained on December 6, 1997, along with the EFS, around the 2740 Å Fe II line. The shaded area indicates the RV domain (21–42 kms-1) used to measure the December 6, 1997 comet’s absorption depth in Sects. 3–6. |
| In the text | |
|
Fig. 3 Spectrum of β Pic obtained on December 6, 1997, along with the EFS, around the 2626 Å Fe II line. The grey area emphasises the same RV domain as in Fig. 2. Here, the estimate of the EFS is incomplete, due to the low number (2) of available observations in this line. |
| In the text | |
|
Fig. 4 Curve of growth analysis of the December 6, 1997 comet in FeII lines, using a single-component model. Top: curve of growth of Fe II lines. The blue dots indicate the measured absorption depth in 63 Fe II lines, while the red line shows the best-fitting one-component model. Bottom: residuals of the previous fit. A clear remaining trend is visible in the data, hinting that the fit could be improved in order to retrieve more information from the comet’s absorption spectrum. |
| In the text | |
|
Fig. 5 Curve of growth of Fe II lines in the December 6, 1997 comet, focussing only on the weakest lines (top, absorption below 14%) and the strongest lines (bottom, absorption above 34%). The curves were fitted with the one-component curve of growth model (Eq. (1)). |
| In the text | |
|
Fig. 6 Same Figure as 4, but this time the absorption depths of the December 6, 1997 comet were fitted with a two-component curve of growth model (red). The dotted purple line indicates the singlecomponent model fitted in Fig. 4. The agreement between the data and the model is much better with the two-component model. |
| In the text | |
|
Fig. 7 Excitation diagram of Fe+ in the December 6, 1997 comet, derived after fitting the two-component curve of growth model. Each blue dot shows the relative abundance of one excitation level, normalised by its multiplicity, gl. The solid red line shows the Boltzmann distribution at T = 8530 K. |
| In the text | |
|
Fig. 8 Curve of growth analysis of the December 6, 1997 comet in Ni II lines. Top: curve of growth of Ni II lines. Purple dots indicate the measured absorptions for 33 Ni II lines in the [+21, +42] km/s range, and the red line shows the best-fitting two-component model. Bottom: excitation diagram of Ni+ (same legend as in Fig. 7.) |
| In the text | |
|
Fig. 9 Curve of growth analysis of the December 6, 1997 comet in lines. Top: curve of growth of Cr II lines. Green dots indicate the measured absorptions for the 17 Cr II lines in the [+21, +42] km/s range, while the red line shows the best fit with the two-component model. Bottom: excitation diagram of Cr+. |
| In the text | |
|
Fig. 10 Excitation diagram of Fe+ in the December 6, 1997 comet, built from the analysis of 96 Fe II lines rising from a wide range of energy levels (El ~ 0–33 000 cm−1 ~ 0–47 000 K). The turquoise point indicates the peculiar a6S5/2 level, which is severely depleted compared to the fitted model. |
| In the text | |
|
Fig. 11 Synthetic β Pic spectrum used in our model, along with the corresponding black body (Teff = 8000 K). |
| In the text | |
|
Fig. 12 Available β Pic spectra around the 1862 Å Al III line, with the December 6, 1997 spectrum shown in purple. Here, the strong comet absorption at all epochs makes the retrieval of an EFS difficult; however, the December 6, 1997 comet (shaded area) seems detected in this line as well (see Figs. 2, 3 and C.1 for comparisons with other species). |
| In the text | |
|
Fig. 13 Excitation temperature of Fe II in the December 6, 1997 comet, as a function of the RV. The temperatures were estimated by building excitation diagrams similar to Fig. 10, but based on absorption measurements in short RV bins (3 km/s width). The horizontal line emphasises the stellar effective temperature, Teff = 8052 K (Gray et al. 2006). |
| In the text | |
|
Fig. 14 Excitation diagram of Fe II in the December 6, 1997 comet in two different RV ranges: 21–33 km/s (top) and 33–42 km/s (bottom). The excitation temperature seems to be slightly higher in the most redshifted part of the comet, due to the increased abundance of some excited levels (e.g. the a4D term at ~12 000 K). As for Fig. 10, the a6S5/2 state was not included in the fit, as it is severely depleted compared to the other Fe II excitation levels. |
| In the text | |
Current usage metrics show cumulative count of Article Views (full-text article views including HTML views, PDF and ePub downloads, according to the available data) and Abstracts Views on Vision4Press platform.
Data correspond to usage on the plateform after 2015. The current usage metrics is available 48-96 hours after online publication and is updated daily on week days.
Initial download of the metrics may take a while.