Fig. 4
Download original image
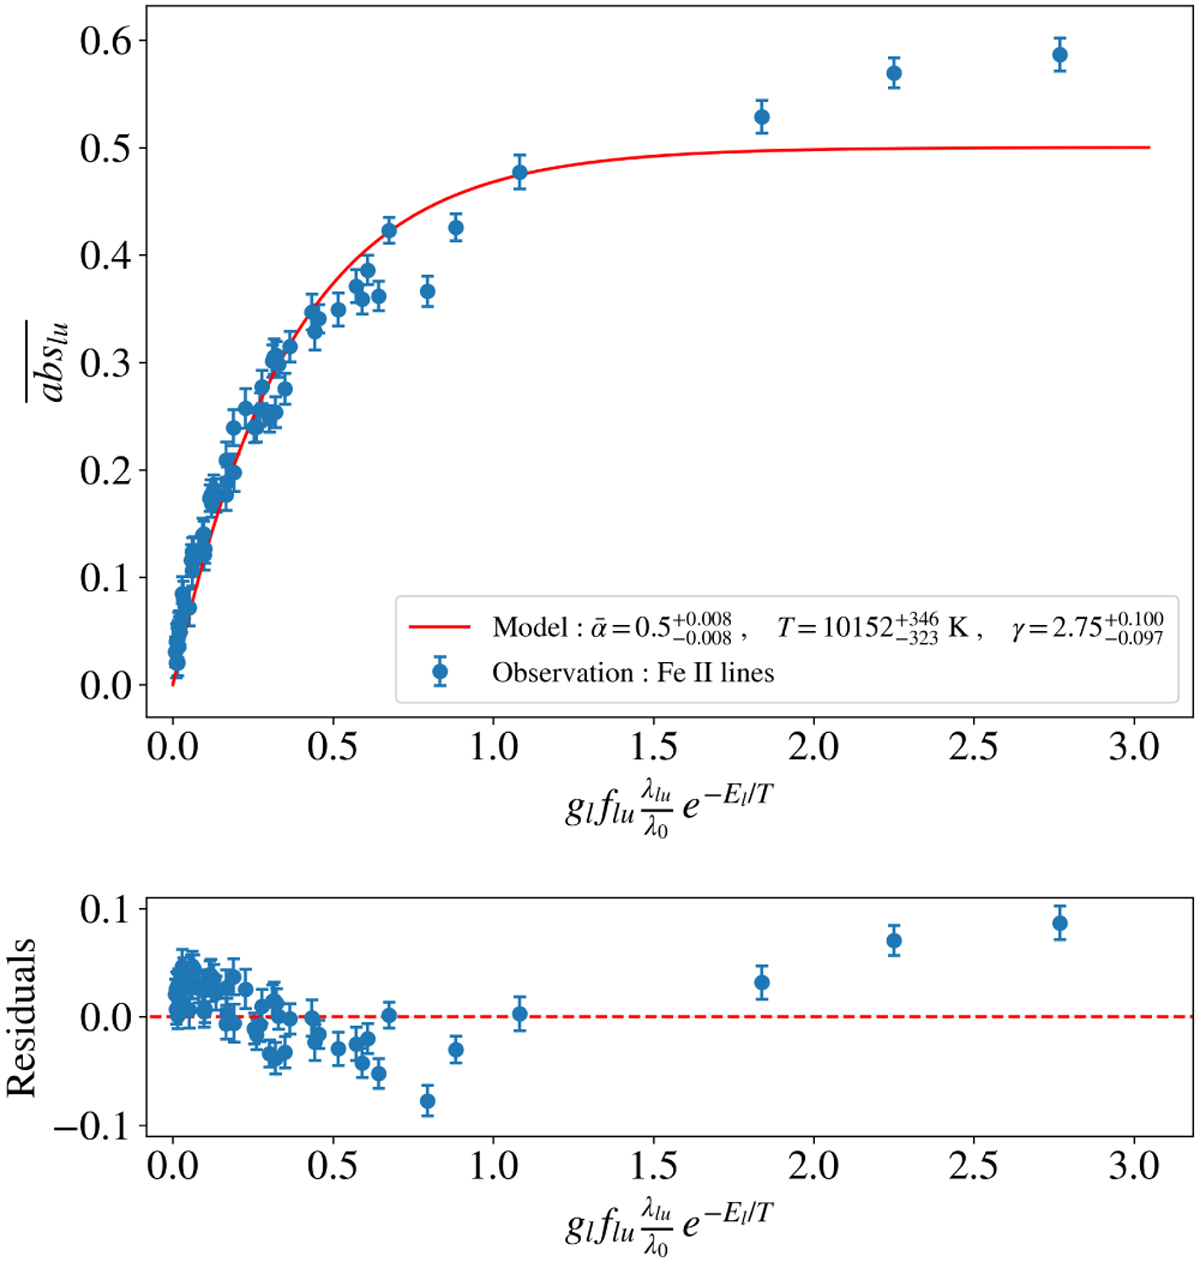
Curve of growth analysis of the December 6, 1997 comet in FeII lines, using a single-component model. Top: curve of growth of Fe II lines. The blue dots indicate the measured absorption depth in 63 Fe II lines, while the red line shows the best-fitting one-component model. Bottom: residuals of the previous fit. A clear remaining trend is visible in the data, hinting that the fit could be improved in order to retrieve more information from the comet’s absorption spectrum.
Current usage metrics show cumulative count of Article Views (full-text article views including HTML views, PDF and ePub downloads, according to the available data) and Abstracts Views on Vision4Press platform.
Data correspond to usage on the plateform after 2015. The current usage metrics is available 48-96 hours after online publication and is updated daily on week days.
Initial download of the metrics may take a while.