Open Access
Fig. 6
Download original image
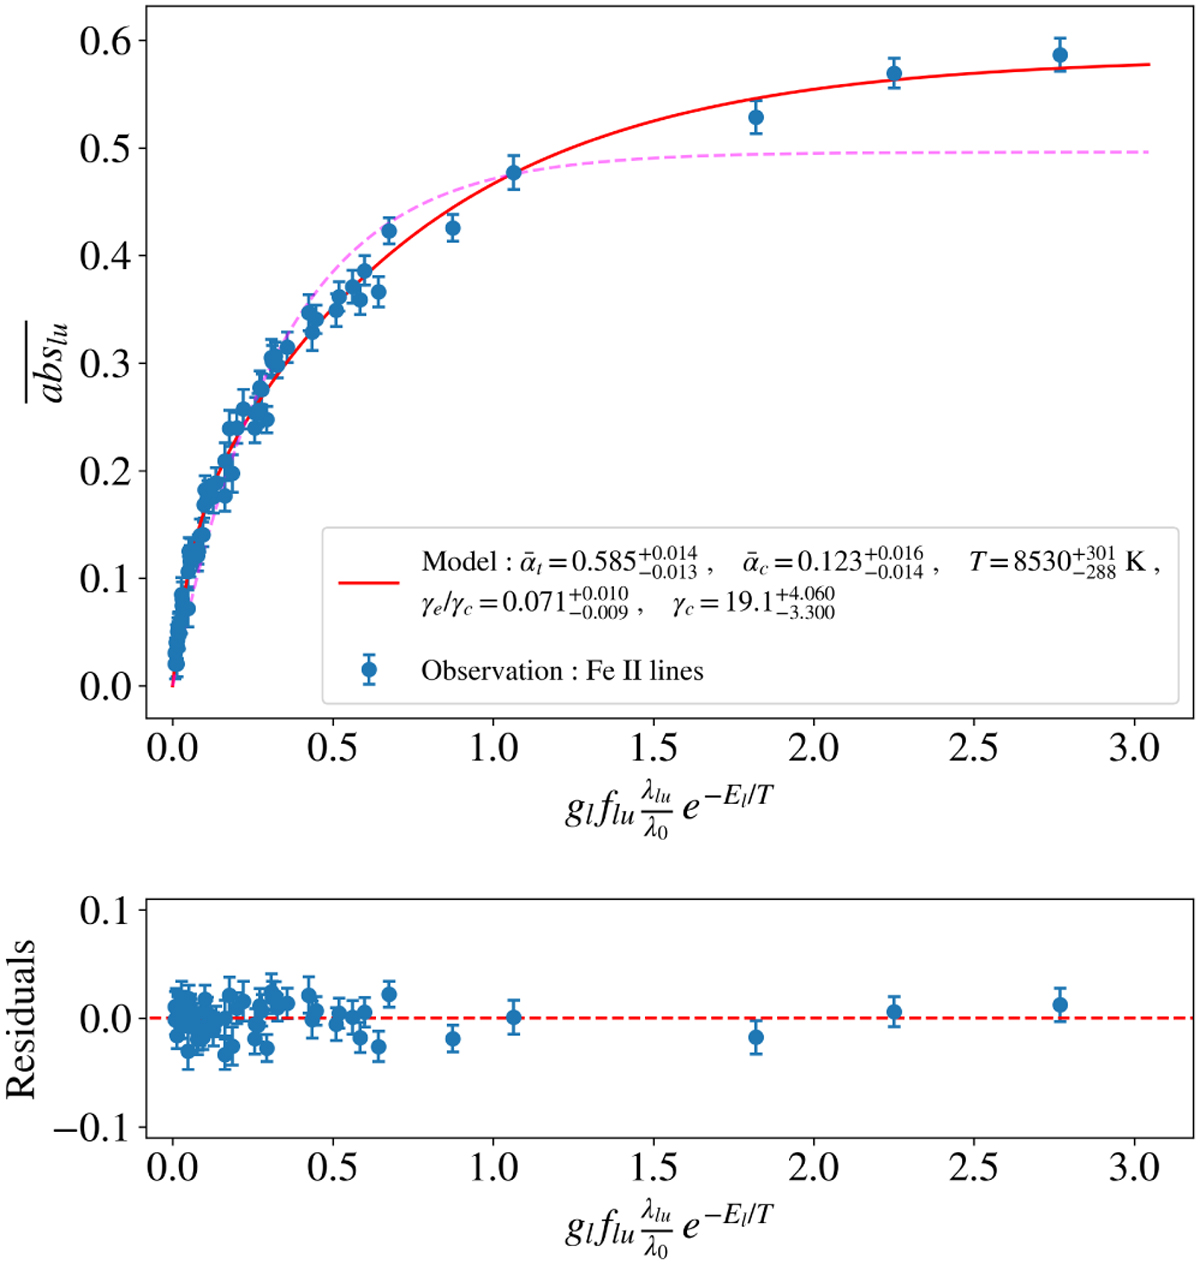
Same Figure as 4, but this time the absorption depths of the December 6, 1997 comet were fitted with a two-component curve of growth model (red). The dotted purple line indicates the singlecomponent model fitted in Fig. 4. The agreement between the data and the model is much better with the two-component model.
Current usage metrics show cumulative count of Article Views (full-text article views including HTML views, PDF and ePub downloads, according to the available data) and Abstracts Views on Vision4Press platform.
Data correspond to usage on the plateform after 2015. The current usage metrics is available 48-96 hours after online publication and is updated daily on week days.
Initial download of the metrics may take a while.