Open Access
Fig. 5
Download original image
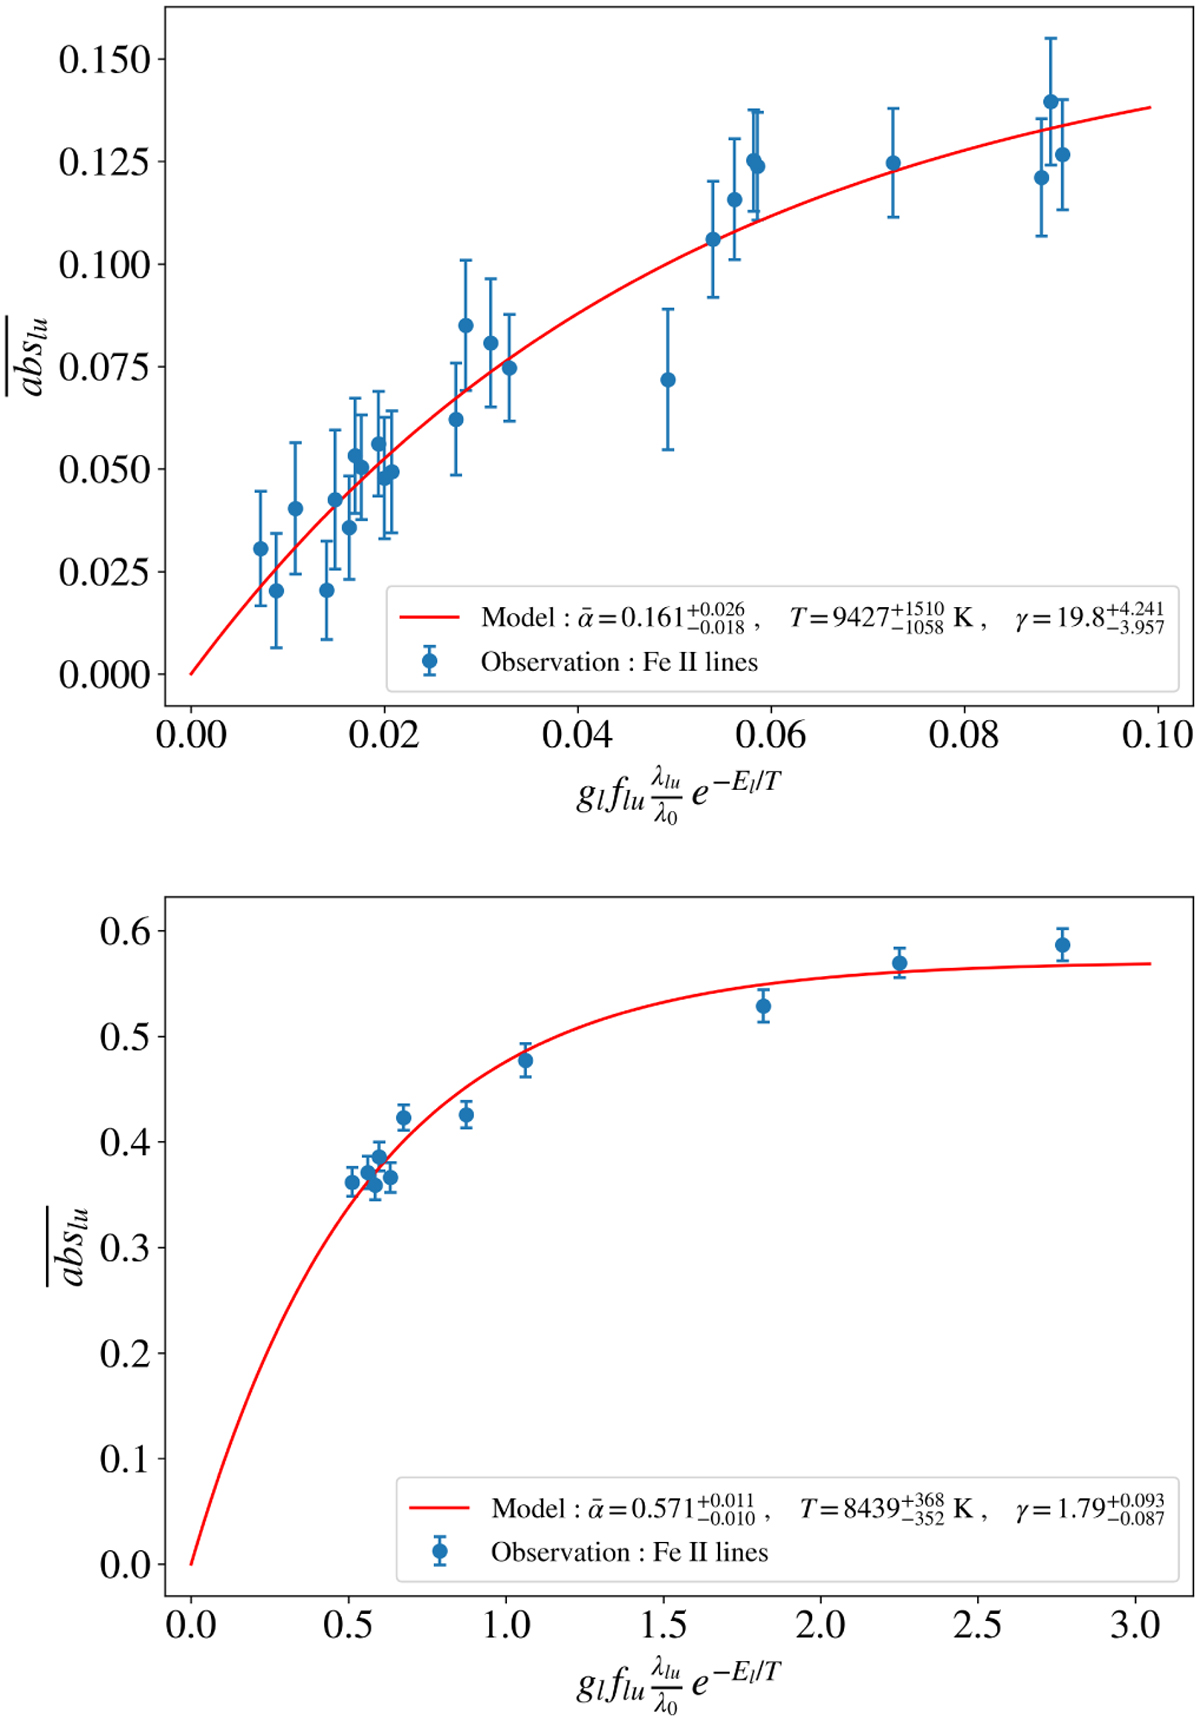
Curve of growth of Fe II lines in the December 6, 1997 comet, focussing only on the weakest lines (top, absorption below 14%) and the strongest lines (bottom, absorption above 34%). The curves were fitted with the one-component curve of growth model (Eq. (1)).
Current usage metrics show cumulative count of Article Views (full-text article views including HTML views, PDF and ePub downloads, according to the available data) and Abstracts Views on Vision4Press platform.
Data correspond to usage on the plateform after 2015. The current usage metrics is available 48-96 hours after online publication and is updated daily on week days.
Initial download of the metrics may take a while.