Open Access
Fig. 9
Download original image
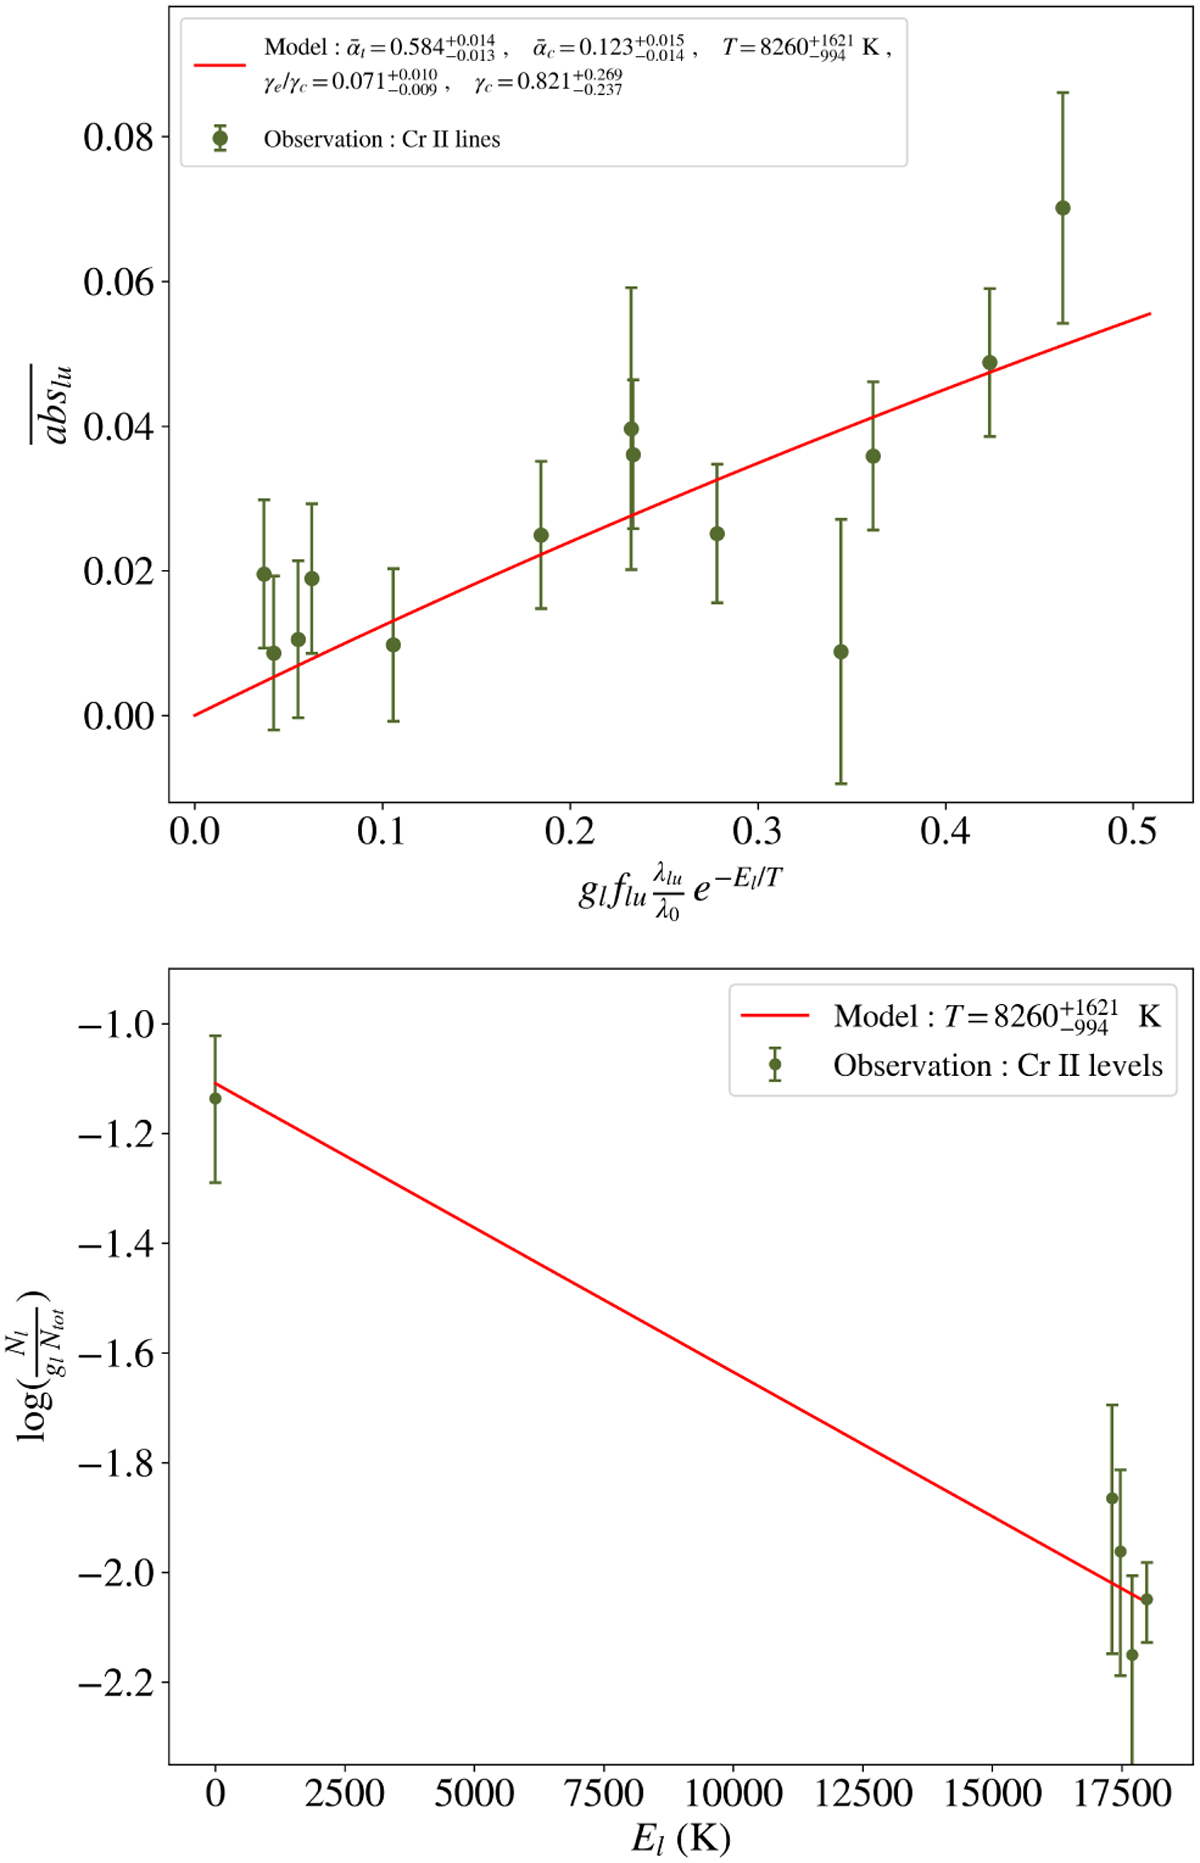
Curve of growth analysis of the December 6, 1997 comet in lines. Top: curve of growth of Cr II lines. Green dots indicate the measured absorptions for the 17 Cr II lines in the [+21, +42] km/s range, while the red line shows the best fit with the two-component model. Bottom: excitation diagram of Cr+.
Current usage metrics show cumulative count of Article Views (full-text article views including HTML views, PDF and ePub downloads, according to the available data) and Abstracts Views on Vision4Press platform.
Data correspond to usage on the plateform after 2015. The current usage metrics is available 48-96 hours after online publication and is updated daily on week days.
Initial download of the metrics may take a while.