Open Access
Fig. 7
Download original image
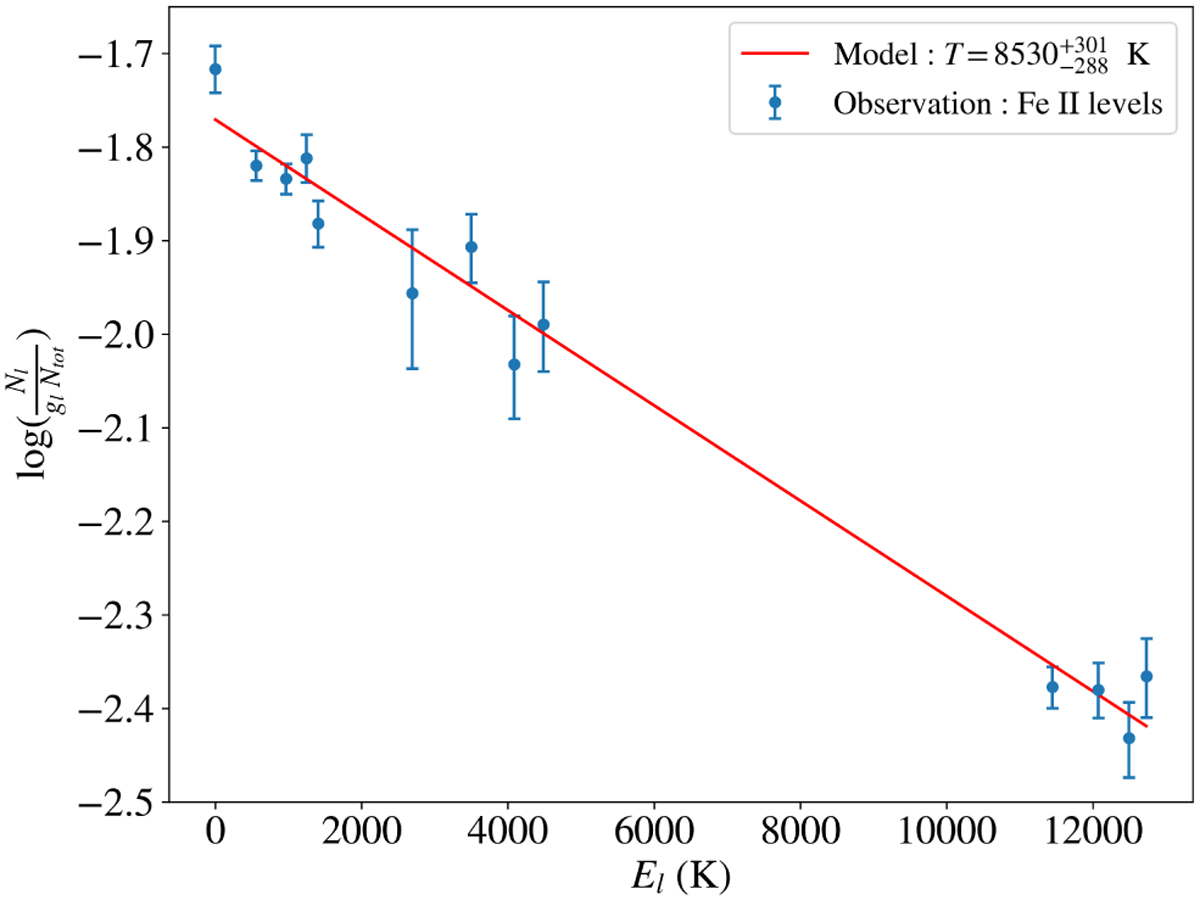
Excitation diagram of Fe+ in the December 6, 1997 comet, derived after fitting the two-component curve of growth model. Each blue dot shows the relative abundance of one excitation level, normalised by its multiplicity, gl. The solid red line shows the Boltzmann distribution at T = 8530 K.
Current usage metrics show cumulative count of Article Views (full-text article views including HTML views, PDF and ePub downloads, according to the available data) and Abstracts Views on Vision4Press platform.
Data correspond to usage on the plateform after 2015. The current usage metrics is available 48-96 hours after online publication and is updated daily on week days.
Initial download of the metrics may take a while.