| Issue |
A&A
Volume 691, November 2024
|
|
|---|---|---|
| Article Number | A127 | |
| Number of page(s) | 8 | |
| Section | Planets and planetary systems | |
| DOI | https://doi.org/10.1051/0004-6361/202348285 | |
| Published online | 05 November 2024 | |
High stability of charged particle clusters in protoplanetary disks
Faculty of Physics, University of Duisburg-Essen,
Lotharstr. 1,
47057
Duisburg,
Germany
★ Corresponding author; This email address is being protected from spambots. You need JavaScript enabled to view it.
Received:
13
October
2023
Accepted:
12
July
2024
Abstract
Context. The initial particle growth in protoplanetary disks is limited by a bouncing barrier at submillimeter wavelengths. Bouncing leads to tribocharging and the electrostatic attraction of tribocharged aggregates may eventually draw them into large clusters. A charge- mediated growth phase allows for the formation of larger entities, namely, clusters of aggregates that are more prone to further particle concentrations, such as the streaming instability.
Aims. We aim to quantify the strength of the electrostatic forces.
Methods. In laboratory experiments, we used an acoustic trap to levitate small aggregates of tribocharged submm grains. These aggregates spin up within the trap until they lose grains. Thus, we used the centrifugal force as a measure of the local force.
Results. Grains are regularly bound strongly to their neighbors. In comparison, the force at ejection can be stronger than the attractive scattering forces of the trap and can therefore be several orders of magnitude larger than expected. We note that these forces are long- ranging, compared to van der Waals forces. Thus, charged aggregates are much more stable than uncharged ones.
Conclusions. Particle aggregates in disks might grow to centimeter clusters or larger as tribocharging increases the effective binding forces. This allows for hydrodynamic concentration and planetesimal formation to eventually take place throughout a wide part of the disk.
Key words: planets and satellites: physical evolution / protoplanetary disks
© The Authors 2024
 Open Access article, published by EDP Sciences, under the terms of the Creative Commons Attribution License (https://creativecommons.org/licenses/by/4.0), which permits unrestricted use, distribution, and reproduction in any medium, provided the original work is properly cited.
This article is published in open access under the Subscribe to Open model. This email address is being protected from spambots. You need JavaScript enabled to view it. to support open access publication.
1 Introduction
Solid particles in protoplanetary disks regularly collide with each other as they couple to the gas in various ways during sedimentation to the mid-plane, as they drift radially or transversally, or while they move within turbulent parts of the disk (Armitage 2020). These collisions are slow for small dust particles and lead to sticking (Johnson et al. 1971; Dominik & Tielens 1997; Wurm & Blum 1998). As aggregates grow in mass, the increasing collision energy can still be dissipated by restructuring the aggregates as they roll, slide, or twist in the contacts they make (Dominik & Tielens 1997; Blum & Wurm 2000; Wada et al. 2008). Eventually, the aggregates become porous, but compact (Weidling et al. 2009; Teiser et al. 2011; Meisner et al. 2013). After compaction, collisions enter into a phase of elastic bouncing behavior, which keeps particles at a certain size, called bouncing barrier (Zsom et al. 2010; Wada et al. 2011; Kelling et al. 2014; Kruss et al. 2016).
The formation of kilometer-sized planetesimals might still proceed in spite of a halt of collisional growth and circumvent bouncing and fragmentation barriers. It has been argued that this is achieved via gas drag instabilities, namely, streaming instability, which can concentrate solids all the way to the limit of gravitational collapse, creating loose pebble-pile planetesimals as consequence (Youdin & Goodman 2005; Johansen et al. 2014). There are other mechanisms at work in this context that can help in concentrating the solids, such as pressure bumps or vortices (Weidenschilling 1977; Pinilla et al. 2012; Raettig et al. 2021). In any case, the streaming instability, for instance, seems to require a minimum particle size (Johansen et al. 2014; Carrera & Simon 2022). The absolute size limit depends on the location in the disk (gas density or Stokes number); however, generally speaking, the aggregate has to be larger than a millimeter or, optimally, even of several decimeters in size.
There is a gap present, where it is unlikely for particles to continue to grow via simple collisions and they are still too small for the concentration mechanisms and a collapse. Slight differences in growth might already be crucial to allow or hinder planetesimal formation. Therefore, different enhancement mechanisms for growth have been studied (Wurm & Teiser 2021). A postulated increased stickiness of water ice is among the first that comes to mind. It increases the particles’ surface energy, which determines the adhesive forces by about two orders of magnitude under normal conditions, namely, close to the freezing point (273 K) at 1 bar ambient pressure. However, the ambient pressure and temperatures in disks are much lower and water ice temperatures tend to be below 160 K. Under these conditions, water ice is no longer more sticky than silicates (Gundlach et al. 2018; Musiolik & Wurm 2019). Still, there might be a cycle of inward drifting of solids involved, as well as sublimation, outward diffusion of water vapour, and re-condensation to increase the size of solids close to the snowline. This would make the snowline a preferred spot for action (Ros et al. 2019). Similar phenomena might occur at other condensation lines. Further outward in the disk, CO2 provides another major snowline, but it has been shown that this ice is also not stickier than silicates or water ice (Fritscher & Teiser 2021, 2022). That still leaves the recycle mechanism to be considered. Further inwards, a major site of condensation is the iron condensation line. It has been argued that large iron particles might be forming here (Johansen & Dorn 2022; Mah & Bitsch 2023). This might be especially important for forming Mercury-like planets. Considering higher temperatures, this also comes with a potential to shift the bouncing barrier due to increased sticking. It was recently shown that at higher temperatures around 1000 K, the loss of water increases the effective surface energy by three orders of magnitude (Bogdan et al. 2020; Pillich et al. 2021). Thus, growth might have a sweet spot here. Up to the Curie line, magnetic aggregation in the magnetic field of the disk might also prove efficient, especially if large pure iron grains formed at the condensation line and somewhat on the outside (Kruss & Wurm 2018; Bogdan et al. 2023).
All these mechanisms might have their share, especially in forming special kinds of planets or planetary seeds, for instance, for iron or water-rich planets. These local conditions might also be important for charge moderated growth, as discussed in the next section. For example, conductive iron particles might not be prone to tribocharging, while dry silicates might work very well in this regard (Becker et al. 2022).
2 Charges in planetesimal formation
As indicated above, one mechanism that could feasibly span a wider spatial range in disks is charge-moderated aggregation. Charges on grains have frequently been considered as a consequence of ionization by energetic radiation in protoplan- etary disks. The underlying mechanisms that charge solid grains have so far included charging within a plasma (i.e., usually negatively, as electrons are more mobile than positive ions) or direct charging by the photo-effect, resulting in positive grains (Pedersen & Gómez de Castro 2011; Ivlev et al. 2016; Kawasaki & Machida 2023). These mechanisms need ionizing radiation and their working efficiency depends on the location. They usually tend to charge grains with the same polarity. This prevents the formation of large aggregates, eventually, as Coulomb repulsion starts to dominate the motion. This kind of charging is not helpful for forming planetesimals and is considered a barrier (Akimkin et al. 2020; Okuzumi et al. 2011).
However, high-energy radiation in protoplanetary disks is mostly restricted to the upper layers. At least, attenuation through the disk makes the mid-plane a rather radiation-quiet place (Cleeves et al. 2013). This is also the reason why the mid-plane, in many parts, is considered a “deadzone” for turbulence created by the magneto-rotational instability (Ueda et al. 2019; Balbus & Hawley 1991), even though dust evolution makes a strong impact in this area (Delage et al. 2023).
A game changer in this context could be the inclusion of tribocharing. It is so common that the basics hardly need an introduction. Essentially, every collision of two particles leads to a charge transfer between these grains (Shaw 1917; Kline et al. 2020; Jungmann et al. 2022). As the bouncing barrier, discussed above as a limit of growth, is defined by non-sticky collisions, grains charge all the time once they reach this (sub)mm size. In contrast to charging by high energy radiation, there is no polarity bias within the ensemble of grains; namely, there is no Coulomb barrier to prevent the particles from colliding over and over again. On the contrary, particles acquire surfaces with patchy charge patterns (Baytekin et al. 2011; Grosjean et al. 2020; Steinpilz et al. 2020b; Onyeagusi et al. 2022). Particles are also in a cloud that is neutral overall, and it is rather easy to build larger clusters of aggregates (Lee et al. 2015; Steinpilz et al. 2020a; Jungmann & Wurm 2021; Jungmann et al. 2022; Teiser et al. 2021). Collisional or tribocharging might initiate a new growth phase, in which aggregates, stuck at the bouncing barrier without charge, grow to larger clusters of aggregates. Eventually, they may hit another bouncing barrier, but at a much larger size.
The works mentioned thus far clearly support this idea and show that the growth of large clusters occurs in the presence of tribocharging. However, there is still no simple recipe to estimate the maximum size to which particles have the potential to grow. To investigate the potential of electrostatic growth further, we set up an experiment to measure the effective forces with which individual charged grains are bound to other charged grains.
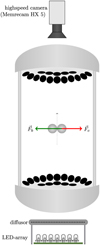 |
Fig. 1 Sketch of the setup. Aggregates are stored in an acoustic trap and start rotating around the vertical axis, resulting in a centrifugal force, Fc . Contacts are broken if this force is larger than the binding forces, Fb . Particles are illuminated through a central opening between the actuators from the bottom and observed through another opening from above using a high-speed camera. |
3 Experiments
The core of the experimental setup is an acoustic trap (TinyLev) as designed by Marzo et al. (2017). A sketch of the experiment can be seen in Fig. 1. In order to eliminate disturbance by convection as much as possible, the acoustic trap is placed in an acrylic glass housing that allows samples of mm-size glass particles to be inserted in the trap from one side. A high-speed camera (Memrecam Hx5) records the motion of the aggregates from the top; namely: their spin-up, disintegration, and the motion of grains afterwards.
In order to ensure sufficient contrast, we used bright-field imaging (i.e., the samples were illuminated from below). A recording rate of 1250 frames per second was used in most cases. The top and bottom assemblies of actuators that produce the acoustic standing wave feature central openings to allow observation and illumination. The particles were automatically tracked using TrackMate ,which is a plugin for ImageJ included in the Fiji software distribution (Schindelin et al. 2012; Tinevez et al. 2017).
4 Sample
To enable precise quantification of the attractive forces and comparison with other data and models, we used loosely bound aggregates of monodisperse spherical particles. Specifically, we used aggregates consisting of a small number of soda-lime glass spheres with a small size distribution with diameters between 425 µm and 450 µm. The mean size of the sample is 434 µm± 17 µm and the mean mass is 0.113 mg ± 0.011 mg (Steinpilz et al. 2020a). We carried out three series of measurements with different pre-treatments of the grains, with which we aimed to change the charge content of the spheres.
4.1 Untreated sample
The first experiments were carried out by directly inserting grains from their storage container into the acoustic trap without any special treatment. There they formed an aggregate. The underlying assumption is that grains became discharged in the container over time. They only have a moderate number of contacts during handling and, thus, they are only moderately charged. In this case, we would expect to only measure small deviations from the regular adhesive surface force of uncharged glass particles in contact.
4.2 Shaken sample
For the second series, we charged the surfaces of the grains through collisions within a shaker. This is a well established approach, which initially led to the idea of charged aggregation in the first place (cf. Sect. 1). As a shaker, we used a 3D-printed vessel connected to a voice coil. The vessel is coated with the same glass beads to avoid a charge bias. The shaking was carried out at a frequency of 20 Hz for a duration of up to 15 minutes to achieve an equilibrium charge state.
4.3 Plasma-treated sample
A plasma provides ions which mostly discharge grains as the ions neutralise the particle charge. Therefore, we used a plasma source here to strongly reduce the charge state on the grains. As plasma source, we used a commercial plasma lighter, which we passed along the sample for about 10 s to 15 s before the samples were placed in the trap. To neutralise charges imparted by contact electrification during the loading of the samples into the trap, the same treatment was repeated once the grains were levitated. The plasma lighter is brought to within about 5 mm of the samples and is operated for about 10 s to 15 s.
5 Motion of trapped particles
The trap has a number of potential minima, in which particles can be captured. Pérez et al. (2014) show that particles vertically behave similarly to harmonic oscillators, but the initial motions are eventually damped by gas drag. The trap works strongly in the vertical direction and is weaker in the lateral direction (Marzo et al. 2017). Therefore, aggregates of particles usually form flat configurations in the lateral plane. As the large number of individual actuators does not provide a perfect acoustic wave, some lateral motion remains. In the vertical direction, the residual motion can be neglected, and in the lateral direction, restoring forces are relatively weak, at least in the present context. This is further quantified in the analysis presented below.
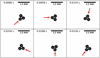 |
Fig. 2 Example sequence of a trapped, rotating aggregate. In this case, a protuberance on one sphere, marked by an arrow, visualises the orientation. The aggregate rotates in the lateral plane. |
5.1 Rotation of aggregates
In addition to linear lateral forces, the acoustic field of the trap also imposes torques on particles, so that the aggregate starts to rotate around the vertical axis. Hahn et al. (2016) explained the occurrence of rotations for spheres in standing pressure wave fields by a gas flow along the surface from pressure maxima to pressure minima. We speculate that the inhomogeneity of the acoustic field has its share in providing torques. In any case, also here, the torques fluctuate over time and can even change direction in a non-predictable way. As a consequence, the direction and speed of the rotation vary for both, individual grains as well as agglomerates within the trap. In our experiment, we observe rotations for single spheres as well as for aggregates. If aggregates spin up beyond their stability limit, where centrifugal forces overcome the binding forces, the aggregates are disrupted (e.g., by first losing individual grains).
Figure 2 displays an aggregate rotating around its center of mass. We chose one grain with a small bar as a protuberance to visualize the orientation of the aggregate. In this case, the angular frequency is approximately 186 Hz.
5.2 Rotation of grains in aggregates
Torques not only spin up aggregates, but also individual grains within the aggregates. This is important in the context of tribocharging, as (in addition to the motion of an aggregate) its constituent particles will also move relative to each other. However, no significant relative motion was observed within any aggregate. For instance, we can see the orientation of the marked grain in Fig. 2 is rather stable. Checking the grain rotation is not straightforward, as we used highly identical and smooth glass particles.
Furthermore, to highlight this inner motion on otherwise featureless grains, we marked them with fluorescent neon paint. Fig. 3 shows an example of the motion inside an aggregate.
This motion is not important for the deduction of the centrifugal forces, but it indicates that contacts are not rigid, which is important for the interpretation of the results in Sect. 6.
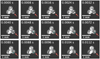 |
Fig. 3 Motion of an individual grain within an aggregate is highlighted. It is different from the overall aggregate rotation, which is eliminated by depicting the aggregate in the co-rotating frame. The arrow marks a colored spot that appears, vanishes, and reappears. In addition, a small cyan spot marks a low-contrast impurity in the glass, which is a further indicator of internal motion. |
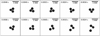 |
Fig. 4 Snapshots of a detachment process taken at 1250 frames per second. |
5.3 Centrifugal disruption
Binding forces between two particles can be determined from centrifugal disruption, since at the moment of detachment, the centrifugal force equals the sum of all other forces. These are provided locally by the adhesive contacts, by long-range forces due to charges and by the force, Ft, induced by the acoustic trap. After there is some distance between a detached grain and the remaining aggregate, the grain’s motion is approximately only influenced by the trap. Therefore, the difference between centrifugal force and force after detachment gives information about the binding forces inherent to a charged aggregate. Figures 4 and 5 show an example of a detachment process of one grain in a three-particle-aggregate. It can be seen that the two contacts do not break simultaneously.
Tracking the detaching grain results in a trajectory with two different parts. This is shown in Fig. 5. In the center of mass system, there is a circular motion before detachment. After detachment, the particle motion can well be described by a parabolic motion with an acceleration, at . In more detail, the motion of particles in the trap is a disturbed harmonic in lateral direction, but we do not include this here, as it is of minor importance. However, the parabolic fit allows us to quantify the trap force, Ft , after the detachment process.
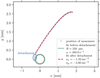 |
Fig. 5 Trajectory of the detached grain in the center of mass system of the aggregate. The dots indicate the position of the particle in each image. The solid green line is a fit to the circular motion of the grain. The red dashed line shows a second-order polynomial fit to the trajectory of the free particle after the detachment. |
5.4 Force balance
For simplicity, we assumed that all forces can be approximated as central forces. In the following, the forces are given as absolutes. The total binding force, Fb , is the difference between centrifugal force Fc and the force within the trap potential Ft, namely,
 (1)
(1)
This neglects an attractive inter-particle force, F scat, which originates from multiple scattering. This is significant but cannot be deduced independently from the particle motion, so it is estimated below. The centrifugal force is
 (2)
(2)
with the distance, R, of a grain to the center of mass and m as its mass. The trap force is determined from the acceleration after detachment and is then
 (3)
(3)
Figure 6 shows the forces on a grain before and after detachment along its trajectory in the laboratory reference frame. It reaches its maximum just prior to detachment. The trap force is comparatively small. Force vectors are calculated locally from discrete particle positions and exhibit the central force character.
5.5 Force per contact
If no charges were involved, the binding force would just correspond to one adhesive force per contact. Now, with charges involved, the force patterns acting on a grain might be much more complex. In any case, if we assume that charged patches close to the contacts would dominate forces due to their close proximity, it might still be useful to split the binding force into a force per contact. We define the average binding force of one contact, F , as the total binding force modified by the number of contacts and a geometry factor accounting for the force directions in each contact. The modifications are summed up in a factor λ, yielding
 (4)
(4)
Table 1 gives λ for different geometries.
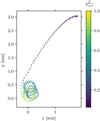 |
Fig. 6 Trajectory of a grain in the laboratory frame of reference. For visibility reasons, all vectors have the same length. The strength is indicated by the color. Just before the detachment, the force reaches its maximum. The force after the detachment process is only about 10% of the force just before detachment. |
6 Results and discussion
The forces per contact resulting from the analysis of the motion and disruption of aggregates are shown in Fig. 7.
We used three different kinds of preparations for the samples. The average forces shown in Fig. 7 differ for all three samples, but only within a factor of two and with a large spread. The fact that the binding force for vibrated particles is slightly larger than for untreated grains is in agreement with the work by Onyeagusi et al. (2022). They used a similar trap setup, using mm-sized basalt particles, and measured the electric dipole moments on the grains. In their case, vibrated samples had a few times larger dipole moments. If we directly translate this to binding forces, it is plausible that we measured somewhat larger forces for vibrated samples. Considering the results from Onyeagusi et al. (2022), it is reasonable to assume that the factor between the binding forces of vibrated and untreated samples is marginal. The plasma treated samples show a somewhat stronger force, but, again, the spread is still quite large.
There are several potential explanations why differences between the average forces, F, are so small. Possibly, all the grains had discharged rapidly, including the vibrated ones, and we only measured the regular adhesive sticking force of uncharged grains. Alternatively, all the grains became charged, including the plasma treated grains, and we always measured similarly charged grains because the charging mechanism is the same. A third possibility would be that we only measured trap forces. We ruled out the last option, as the trajectories show that the trap forces are an order of magnitude smaller than the binding forces.
To evaluate the possibility that the grains are uncharged, we can calculate the adhesive force per contact. According to Johnson et al. (1971), the sticking force, Fs, between two grains in contact is
 (5)
(5)
with the particle radius, r, and the surface energy, γ. This equation works well for small particles that have a well known curvature. However, for mm-grains, the surface usually has some roughness, which effectively reduces the radius. This is hard to quantify and it is easier to put these unknown surface structure in a smaller effective surface energy. From experiments on wind-blown sand, Demirci et al. (2020) estimated the effective surface energy of the glass particles (same as those used here) as γ = 7 • 10−5 J/m2. Putting this into Eq. (5), we get a force of Fs = 0.07 µN. This is about two orders of magnitude lower than the measured forces.
Therefore, the most likely option is that the grains within the trap are always bound by electrostatic forces. In fact, we know that these glass beads charge well and that the charge is long-lasting, at least if they are vibrated (Jungmann et al. 2018, 2022; Steinpilz et al. 2020a,b). This leaves us with the question of why even untreated grains and plasma treated grains exhibit such large forces. This might be intrinsic to the setting of the trap. As outlined above, we observed the motion of grains within aggregates. Therefore, we see that the aggregates are not rigid. This is especially true for the investigated 2D aggregates, as they can easily twist around the two contacts and can rather easily rearrange. This might have two consequences. Either, even initially uncharged grains charge as they are trapped. Or, if there are fewer charged patches on the surface, the particles rearrange to the most stable condition, even if there are only a few potential “high sticking” orientations.
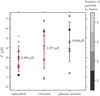 |
Fig. 7 Contact forces for untreated, vibrated, and plasma treated particles. |
Charge patches
To estimate whether charged patches are indeed a reasonable explanation for the measured attractive force, we tested our results against a very simple model. Given the modulus of elasticity E ∈ [40 GPa, 90 GPa] as well as Poisson’s ratio ν ∈ [0.19, 0.28] (Kuchling & Kuchling 2022), the effective radius, Reff = 108.5 µm, and the particle overlap, ξ, the Hertzian contact model (Hertz 1882) predicts the repulsive force
 (6)
(6)
When the attractive force, F , and the repulsive force, FH , are in equilibrium, we can infer the overlap and, thus, the contact radius is ![Mathematical equation: $a = \sqrt {{R_{{\rm{eff}}}}\xi } \in [119{\rm{nm}},302{\rm{nm}}]$](/articles/aa/full_html/2024/11/aa48285-23/aa48285-23-eq9.png) from the measured forces F є [1 µN, 10 µN].
from the measured forces F є [1 µN, 10 µN].
To model the attractive electrostatic force, we only considered charges on the contact area:
 (7)
(7)
Two plates that carry the charges Q and −Q, respectively, whose sizes are much greater than their distance, experience an electrostatic force of
 (8)
(8)
with the permittivity of air ε = 1.0006 • ε0 (Kuchling & Kuchling 2022). Again, using our measured forces, we find that each particle would need to carry roughly Q ∈ [0.6, 3.7] • 104 elementary charges on the contact area.
This agrees with the charge transfer measured in collisions of the same grains in drop tower experiments by Jungmann et al. (2022). These were regularly an order of magnitude larger or 105 elementary charges but with much variation. As these values are already averages over the contact area, it is plausible that the forces between two particles sticking together can be explained with a non-ideal contact charge density that is smaller by a factor of 10.
7 Scattering forces versus charge
It has been shown that there is also an attractive force between particles close to each other in an acoustic trap due to scattering of acoustic waves (Silva & Bruus 2014; Zhang et al. 2016). Even without charge, non-cohesive particles might therefore behave similarly to cohesive particles. Related processes, such as the evaporation of weakly bound clusters or stability of weakly bound systems, can generally be studied in this context (Lim et al. 2019, 2022; Lim & Jaeger 2023).
For our purpose, it is important that this scattering force is an attractive lateral force for multiple particle systems in addition to the trap’s central force on well-isolated individual grains. Above, we evaluated the latter to be small compared to the sticking forces we measure. We can only argue on attractive electrostatic forces though, if also these scattering trap forces are smaller or on the order of the electrostatic forces.
From the work on scattering forces (e.g., in Lim et al. 2019 or Silva & Bruus 2014), it follows that for particles much smaller than the wavelength (as is the case here), the attractive force is proportional to d−4 (where d is the distance between two particles measured from center to center). Prefactors of this proportionality are subject to the specific setting and are not easily calculated for our trap with multiple transducers.
To gain more clarity on the influence of the scattering forces, we set up a new experiment to measure the scattering forces independently. A complete characterization of measured scattering forces with this new setup is far beyond the scope of this paper, but this allows us to gain at least a first estimate, as follows. The setup is sketched in Fig. 8.
As force detector, we use an ultra-microscale. This can usually measure masses with an accuracy on the µg level, but considering Earth’s gravitational acceleration, g, this turns into a force sensor down to a 10−8 N resolution. It is therefore capable of resolving forces way below what we deduced above from centrifugal disruption. For simplicity, we used copper wires or rods of 0.42 mm in diameter as a first approach here. One is mounted on the scale and the other is fixed above. The rod diameters are comparable to the particle size used above. The lower rod’s end is positioned within the node of the acoustic trap oriented horizontally. The scale is otherwise shielded from the acoustic waves. While scattering forces are certainly different for a set of two spherical particles, we would expect the same order of magnitude when two rods with a diameter approximately the size of the spheres are approaching each other. The force measurements are shown in Fig. 9, where d refers to the distance between both rods.
We fit a function a • (b + d)−α. We fixed α to α = 4. This specific power law index is expected for scattering forces between two spheres. Rods might have a different distance dependence. Leaving the power index as free parameter yields α = 3.9, but a power of α = 3 would still be compatible with the data. Thus, we leave a detailed discussion to a future work. Furthermore, α = −0.008 µN mm4 gives the strength of scattering forces in the specific setting. The parameter b would correspond to the diameter of a sphere in a trap setting with two spheres. In our case, fitting b = 0.247 mm results in a value close to the radius of the rod, but again, the details are beyond the scope of this paper. In any case, these preliminary results offer two key findings. First, we see that the scattering force is compatible with a power law. Second (and especially important in the context of this work), the maximum force that occurs, namely, the difference between close contact and large separation, is about 2 µN. The latter finding can be brought into line with the results of our attractive force measurements, as we did not measure any forces smaller than 1 µN for particles within aggregates.
Without the trap turned on, we see no distance-dependent force, so no other forces such as charges are at play here. However, we clearly note that a more precise elaboration of scattering forces needs to be carried out in the future. In the context of the current work, these measurements show us that scattering forces can be on the same order of magnitude as the centrifugal forces measured. Thus, we go on to consider how this is connected to electrostatic forces.
For a given, fixed trap setting and identical particles and number of particles, the scattering force should always be the same. Variations can be induced on purpose if, for instance, the trap is detuned (Lim et al. 2019). Multiple particles might also behave differently (Lim et al. 2022). However, we always use the same node, same amplitude, and same frequency of the trap. Therefore, with a variation of a factor of 7 in the measured forces, even for small same size aggregates, it is unlikely that scattering forces are the only origin. On the other hand, complex charge patterns on the surface can naturally explain such variations. With electrostatic interactions, we would expect a variety of higher multipole orders.
Our measurements are biased towards aggregates already sticking together. However, with arbitrary polarity, we do not expect to see only attractive forces. In fact, we do see cases of repulsive forces at such close proximity. Such a strong repulsion upon approach at very close distance cannot be explained by scattering forces. As an example, in Fig. 10 we show the trajectories of two particles approaching each other. Even though they are approaching each other very closely, they remain clearly separated. The forces upon approach and recession are plotted in Fig. 11, showing how they depend on the distance between the two spheres, d. Obviously, there is a non-contact force that is larger than any attractive trap force, even though the grains are very close to each other. In case of charge patches on the surface, it is likely that attractive and repulsive forces are on the same order of magnitude.
We conclude that, overall, the scattering forces are a significant force keeping particles together, but that there are electrostatic forces of the order of magnitude which are measured. Therefore, while not all aggregates are bound strongly electrostatically, tribocharged grains have the ability to arrange themselves in rather stable configurations.
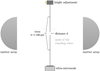 |
Fig. 8 Sketch of the setup to measure scattering forces within the acoustic trap my means of an ultra-microscale. |
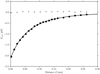 |
Fig. 9 Measured scattering force between two copper rods of 0.42 mm diameter depending on the distance, d, between the rods in a node of the acoustic trap (black dots). The plotted function is a • (b + d)−4. Measurements for when the trap is turned off are plotted as grey squares. |
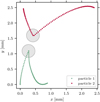 |
Fig. 10 Trajectories of the centers o proaching particles. The cross-sections of the particles are shown for closest approach. Particles do not get in contact, but do repel each other at close proximity. |
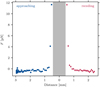 |
Fig. 11 Force on a sphere in the center of mass systems depending on the distance between both particles (from Fig. 10). Left: approach; right: receding. The gray bar is one diameter to the left and right and visualizes particles in contact. Initial attraction (negative forces) turns into repulsion upon approach and separation (positive force) until trapping eventually leads to attraction again. |
8 Conclusions
The observation of centrifugal disruption of small aggregates levitated in an acoustic trap offers a way to determine attractive forces without the need to consider forces such as gravity or contact forces between particles and any other surface. However, scattering forces have to be considered. Keeping these aspects in mind, we find that grains with charge distributions on their surface generated by tribocharging have orders of magnitude larger attractive forces than adhesive contacts would provide.
This can be applied to particle evolution in protoplanetary disks. For example, since the threshold kinetic energy for sticking of grains is connected to the binding force, we might expect that particles that grow to mm size without charge should grow to cm size due to tribocharging at least at the same collision velocities. Detailed numbers remain uncertain, as charges provide long-range forces that will go on to influence collision. This is because particles are not completely free after they lose contact. In any case, our work offers, for the first time, an experimental quantitative value for the typical attractive forces between charged particles within an aggregate.
Once more, in this case, the strength of the forces supports tribocharging as a bridging mechanism in planetesimal formation between regular uncharged growth of adhesive grains in mutual collisions and, for example, streaming instabilities with larger charge bound aggregates.
Acknowledgements
This project is funded by the Deutsche Forschungsgemein- schaft (DFG, German Research Foundation) – 458889524. We thank the referees for very constructive reviews.
References
- Akimkin, V. V., Ivlev, A. V., & Caselli, P. 2020, ApJ, 889, 64 [NASA ADS] [CrossRef] [Google Scholar]
- Armitage, P. J. 2020, Astrophysics of Planet Formation, 2nd edn [CrossRef] [Google Scholar]
- Balbus, S. A., & Hawley, J. F. 1991, ApJ, 376, 214 [Google Scholar]
- Baytekin, H. T., Baytekin, B., Soh, S., & Grzybowski, B. A. 2011, Angew. Chem., 123, 6898 [NASA ADS] [CrossRef] [Google Scholar]
- Becker, T., Steinpilz, T., Teiser, J., & Wurm, G. 2022, MNRAS, 513, 5814 [NASA ADS] [Google Scholar]
- Blum, J., & Wurm, G. 2000, Icarus, 143, 138 [NASA ADS] [CrossRef] [Google Scholar]
- Bogdan, T., Pillich, C., Landers, J., Wende, H., & Wurm, G. 2020, A&A, 638, A151 [EDP Sciences] [Google Scholar]
- Bogdan, T., Pillich, C., Landers, J., Wende, H., & Wurm, G. 2023, A&A, 670, A6 [NASA ADS] [CrossRef] [EDP Sciences] [Google Scholar]
- Carrera, D., & Simon, J. B. 2022, ApJ, 933, L10 [NASA ADS] [CrossRef] [Google Scholar]
- Cleeves, L. I., Adams, F. C., & Bergin, E. A. 2013, ApJ, 772, 5 [Google Scholar]
- Delage, T. N., Gárate, M., Okuzumi, S., et al. 2023, A&A, 674, A190 [NASA ADS] [CrossRef] [EDP Sciences] [Google Scholar]
- Demirci, T., Schneider, N., Steinpilz, T., et al. 2020, MNRAS, 493, 5456 [NASA ADS] [CrossRef] [Google Scholar]
- Dominik, C., & Tielens, A. G. G. M. 1997, ApJ, 480, 647 [Google Scholar]
- Fritscher, M., & Teiser, J. 2021, ApJ, 923, 134 [NASA ADS] [CrossRef] [Google Scholar]
- Fritscher, M., & Teiser, J. 2022, MNRAS, 512, 3754 [NASA ADS] [CrossRef] [Google Scholar]
- Grosjean, G., Wald, S., Sobarzo, J. C., & Waitukaitis, S. 2020, Phys. Rev. Mater., 4, 082602 [Google Scholar]
- Gundlach, B., Schmidt, K. P., Kreuzig, C., et al. 2018, MNRAS, 479, 1273 [NASA ADS] [CrossRef] [Google Scholar]
- Hahn, P., Lamprecht, A., & Dual, J. 2016, Lab Chip, 16, 4581 [CrossRef] [Google Scholar]
- Hertz, H. 1882, Crelles J., 92, 156 [CrossRef] [Google Scholar]
- Ivlev, A. V., Akimkin, V. V., & Caselli, P. 2016, ApJ, 833, 92 [NASA ADS] [CrossRef] [Google Scholar]
- Johansen, A., & Dorn, C. 2022, A&A, 662, A19 [NASA ADS] [CrossRef] [EDP Sciences] [Google Scholar]
- Johansen, A., Blum, J., Tanaka, H., et al. 2014, Protostars and Planets VI, 547 [Google Scholar]
- Johnson, K. L., Kendall, K., & Roberts, A. D. 1971, Roy. Soc. Lond. Proc. Ser. A, 324, 301 [NASA ADS] [CrossRef] [Google Scholar]
- Jungmann, F., & Wurm, G. 2021, A&A, 650, A77 [NASA ADS] [CrossRef] [EDP Sciences] [Google Scholar]
- Jungmann, F., Steinpilz, T., Teiser, J., & Wurm, G. 2018, J. Phys. Commun., 2, 095009 [Google Scholar]
- Jungmann, F., Kruss, M., Teiser, J., & Wurm, G. 2022, Icarus, 373, 114766 [NASA ADS] [CrossRef] [Google Scholar]
- Jungmann, F., Onyeagusi, F. C., Teiser, J., & Wurm, G. 2022, J. Electrost., 117, 103705 [CrossRef] [Google Scholar]
- Kawasaki, Y., & Machida, M. N. 2023, MNRAS, 522, 3679 [NASA ADS] [CrossRef] [Google Scholar]
- Kelling, T., Wurm, G., & Köster, M. 2014, ApJ, 783, 111 [Google Scholar]
- Kline, A. G., Lim, M. X., & Jaeger, H. M. 2020, Rev. Sci. Instrum., 91, 023908 [NASA ADS] [CrossRef] [Google Scholar]
- Kruss, M., & Wurm, G. 2018, ApJ, 869, 45 [NASA ADS] [CrossRef] [Google Scholar]
- Kruss, M., Demirci, T., Koester, M., Kelling, T., & Wurm, G. 2016, ApJ, 827, 110 [Google Scholar]
- Kuchling, H., & Kuchling, T. 2022, Taschenbuch der Physik (München: Hanser) [CrossRef] [Google Scholar]
- Lee, V., Waitukaitis, S. R., Miskin, M. Z., & Jaeger, H. M. 2015, Nat. Phys., 11, 733 [Google Scholar]
- Lim, M. X., & Jaeger, H. M. 2023, Phys. Rev. Res., 5, 013116 [NASA ADS] [CrossRef] [Google Scholar]
- Lim, M. X., Souslov, A., Vitelli, V., & Jaeger, H. M. 2019, Nat. Phys., 15, 460 [NASA ADS] [CrossRef] [Google Scholar]
- Lim, M. X., VanSaders, B., Souslov, A., & Jaeger, H. M. 2022, Phys. Rev. X, 12, 021017 [NASA ADS] [Google Scholar]
- Mah, J., & Bitsch, B. 2023, A&A, 673, A17 [NASA ADS] [CrossRef] [EDP Sciences] [Google Scholar]
- Marzo, A., Barnes, A., & Drinkwater, B. W. 2017, Rev. Sci. Instrum., 88, 085105 [NASA ADS] [CrossRef] [Google Scholar]
- Meisner, T., Wurm, G., Teiser, J., & Schywek, M. 2013, A&A, 559, A123 [NASA ADS] [CrossRef] [EDP Sciences] [Google Scholar]
- Musiolik, G., & Wurm, G. 2019, ApJ, 873, 58 [NASA ADS] [CrossRef] [Google Scholar]
- Okuzumi, S., Tanaka, H., Takeuchi, T., & Sakagami, M.-a. 2011, ApJ, 731, 95 [NASA ADS] [CrossRef] [Google Scholar]
- Onyeagusi, F. C., Teiser, J., Schneider, N., & Wurm, G. 2022, J. Electrostat., 115, 103637 [CrossRef] [Google Scholar]
- Pedersen, A., & Gómez de Castro, A. I. 2011, ApJ, 740, 77 [NASA ADS] [CrossRef] [Google Scholar]
- Pillich, C., Bogdan, T., Landers, J., Wurm, G., & Wende, H. 2021, A&A, 652, A106 [NASA ADS] [CrossRef] [EDP Sciences] [Google Scholar]
- Pinilla, P., Birnstiel, T., Ricci, L., et al. 2012, A&A, 538, A114 [NASA ADS] [CrossRef] [EDP Sciences] [Google Scholar]
- Pérez, N., Andrade, M. A. B., Canetti, R., & Adamowski, J. C. 2014, J. Appl. Phys., 116, 184903 [CrossRef] [Google Scholar]
- Raettig, N., Lyra, W., & Klahr, H. 2021, ApJ, 913, 92 [NASA ADS] [CrossRef] [Google Scholar]
- Ros, K., Johansen, A., Riipinen, I., & Schlesinger, D. 2019, A&A, 629, A65 [NASA ADS] [CrossRef] [EDP Sciences] [Google Scholar]
- Schindelin, J., Arganda-Carreras, I., Frise, E., et al. 2012, Nature Methods, 9, 676 [CrossRef] [Google Scholar]
- Shaw, P. E. 1917, Proc. Roy. Soc. Lond. Ser. A, 94, 16 [NASA ADS] [CrossRef] [Google Scholar]
- Silva, G. T., & Bruus, H. 2014, Phys. Rev. E, 90, 063007 [NASA ADS] [CrossRef] [Google Scholar]
- Steinpilz, T., Joeris, K., Jungmann, F., et al. 2020a, Nat. Phys., 16, 225 [Google Scholar]
- Steinpilz, T., Jungmann, F., Joeris, K., Teiser, J., & Wurm, G. 2020b, New J. Phys., 22, 093025 [Google Scholar]
- Teiser, J., Engelhardt, I., & Wurm, G. 2011, ApJ, 742, 5 [NASA ADS] [CrossRef] [Google Scholar]
- Teiser, J., Kruss, M., Jungmann, F., & Wurm, G. 2021, ApJ, 908, L22 [Google Scholar]
- Tinevez, J.-Y., Perry, N., Schindelin, J., et al. 2017, Methods, 115, 80 [CrossRef] [Google Scholar]
- Ueda, T., Flock, M., & Okuzumi, S. 2019, ApJ, 871, 10 [Google Scholar]
- Wada, K., Tanaka, H., Suyama, T., Kimura, H., & Yamamoto, T. 2008, ApJ, 677, 1296 [NASA ADS] [CrossRef] [Google Scholar]
- Wada, K., Tanaka, H., Suyama, T., Kimura, H., & Yamamoto, T. 2011, ApJ, 737, 36 [CrossRef] [Google Scholar]
- Weidenschilling, S. J. 1977, MNRAS, 180, 57 [Google Scholar]
- Weidling, R., Güttler, C., Blum, J., & Brauer, F. 2009, ApJ, 696, 2036 [NASA ADS] [CrossRef] [Google Scholar]
- Wurm, G., & Blum, J. 1998, Icarus, 132, 125 [NASA ADS] [CrossRef] [Google Scholar]
- Wurm, G., & Teiser, J. 2021, Nat. Rev. Phys., 3, 405 [CrossRef] [Google Scholar]
- Youdin, A. N., & Goodman, J. 2005, ApJ, 620, 459 [Google Scholar]
- Zhang, S., Qiu, C., Wang, M., Ke, M., & Liu, Z. 2016, New J. Phys., 18, 113034 [NASA ADS] [CrossRef] [Google Scholar]
- Zsom, A., Ormel, C. W., Güttler, C., Blum, J., & Dullemond, C. P. 2010, A&A, 513, A57 [NASA ADS] [CrossRef] [EDP Sciences] [Google Scholar]
All Tables
All Figures
|
Fig. 1 Sketch of the setup. Aggregates are stored in an acoustic trap and start rotating around the vertical axis, resulting in a centrifugal force, Fc . Contacts are broken if this force is larger than the binding forces, Fb . Particles are illuminated through a central opening between the actuators from the bottom and observed through another opening from above using a high-speed camera. |
| In the text | |
|
Fig. 2 Example sequence of a trapped, rotating aggregate. In this case, a protuberance on one sphere, marked by an arrow, visualises the orientation. The aggregate rotates in the lateral plane. |
| In the text | |
|
Fig. 3 Motion of an individual grain within an aggregate is highlighted. It is different from the overall aggregate rotation, which is eliminated by depicting the aggregate in the co-rotating frame. The arrow marks a colored spot that appears, vanishes, and reappears. In addition, a small cyan spot marks a low-contrast impurity in the glass, which is a further indicator of internal motion. |
| In the text | |
|
Fig. 4 Snapshots of a detachment process taken at 1250 frames per second. |
| In the text | |
|
Fig. 5 Trajectory of the detached grain in the center of mass system of the aggregate. The dots indicate the position of the particle in each image. The solid green line is a fit to the circular motion of the grain. The red dashed line shows a second-order polynomial fit to the trajectory of the free particle after the detachment. |
| In the text | |
|
Fig. 6 Trajectory of a grain in the laboratory frame of reference. For visibility reasons, all vectors have the same length. The strength is indicated by the color. Just before the detachment, the force reaches its maximum. The force after the detachment process is only about 10% of the force just before detachment. |
| In the text | |
|
Fig. 7 Contact forces for untreated, vibrated, and plasma treated particles. |
| In the text | |
|
Fig. 8 Sketch of the setup to measure scattering forces within the acoustic trap my means of an ultra-microscale. |
| In the text | |
|
Fig. 9 Measured scattering force between two copper rods of 0.42 mm diameter depending on the distance, d, between the rods in a node of the acoustic trap (black dots). The plotted function is a • (b + d)−4. Measurements for when the trap is turned off are plotted as grey squares. |
| In the text | |
|
Fig. 10 Trajectories of the centers o proaching particles. The cross-sections of the particles are shown for closest approach. Particles do not get in contact, but do repel each other at close proximity. |
| In the text | |
|
Fig. 11 Force on a sphere in the center of mass systems depending on the distance between both particles (from Fig. 10). Left: approach; right: receding. The gray bar is one diameter to the left and right and visualizes particles in contact. Initial attraction (negative forces) turns into repulsion upon approach and separation (positive force) until trapping eventually leads to attraction again. |
| In the text | |
Current usage metrics show cumulative count of Article Views (full-text article views including HTML views, PDF and ePub downloads, according to the available data) and Abstracts Views on Vision4Press platform.
Data correspond to usage on the plateform after 2015. The current usage metrics is available 48-96 hours after online publication and is updated daily on week days.
Initial download of the metrics may take a while.