| Issue |
A&A
Volume 672, April 2023
|
|
|---|---|---|
| Article Number | A169 | |
| Number of page(s) | 6 | |
| Section | Planets and planetary systems | |
| DOI | https://doi.org/10.1051/0004-6361/202245499 | |
| Published online | 17 April 2023 | |
Forbidden planetesimals
University of Duisburg-Essen, Faculty of Physics,
Lotharstr. 1,
47057
Duisburg, Germany
e-mail: This email address is being protected from spambots. You need JavaScript enabled to view it.
Received:
18
November
2022
Accepted:
20
February
2023
Abstract
Planetesimals are born fragile and are subject to destruction by wind erosion as they move through the gas of a protoplanetary disk. In microgravity experiments, we determined the shear stress necessary for erosion of a surface consisting of 1 mm dust pebbles down to 1 Pa ambient pressure. This is directly applicable to protoplanetary disks. Even pebble pile planetesimals with low eccentricities of 0.1 cannot survive inside of 1 au in a minimum-mass solar nebula, and safe zones for planetesimals with higher eccentricities are located even farther out.
Key words: planets and satellites: dynamical evolution and stability / planets and satellites: formation / planets and satellites: physical evolution / protoplanetary disks / planet-disk interactions
© The Authors 2023
 Open Access article, published by EDP Sciences, under the terms of the Creative Commons Attribution License (https://creativecommons.org/licenses/by/4.0), which permits unrestricted use, distribution, and reproduction in any medium, provided the original work is properly cited.
This article is published in open access under the Subscribe to Open model. This email address is being protected from spambots. You need JavaScript enabled to view it. to support open access publication.
1 Introduction
Planet formation spans a huge variety in physical mechanisms, timescales, and spatial scales. Models are therefore subdivided into quite a number of steps (Blum & Wurm 2008; Wurm & Teiser 2021; Johansen et al. 2014). Working their way from dust to planets, these different steps are often related to certain size ranges with their specific evolution paradigms. The first of these paradigms is that initially micron-sized dust in protoplanetary disks collides, sticks together, grows, and becomes compressed, until eventually, millimeter-sized, compact dust aggregates are formed (Blum et al. 2000; Wurm & Blum 1998; Blum & Wurm 2000; Kruss et al. 2017). The exact size is debatable, but with growth and compaction at the millimeter-scale, collisions eventually enter a regime of more or less elastic rebound. This is known as the bouncing barrier (Zsom et al. 2010; Windmark et al. 2012; Kelling et al. 2014; Kruss et al. 2016; Demirci et al. 2017). Further simple growth via ongoing sticking collisions where van der Waals forces provide the binding is challenging from here, hence the name bouncing barrier.
In view of rebounding collisions, collisional charging (tribocharging) might become important. It has been shown in recent years that collisional charging can induce a new growth phase, now moderated by long-range Coulomb forces (Steinpilz et al. 2019; Jungmann et al. 2018; Jungmann & Wurm 2021; Lee et al. 2015). In this way, clusters of aggregates of decimeter-size might grow (Teiser et al. 2021). The individual entities in these clusters are still the bouncing-barrier size dust aggregates that are not restructured into a larger aggregate. However, the larger clusters now have overall aerodynamic properties of a larger body (Schneider & Wurm 2021). These ideas about col-lisional charging in the context of planet formation are not a paradigm yet and are still evolving, but they might be a welcome if not necessary bridge in size scale to the next phase. Particles of decimeter-scale rather than millimeter are concentrated in varying ways, from pressure maxima to drag instabilities and especially streaming instabilities (Dittrich et al. 2013; Carrera & Simon 2022; Chiang & Youdin 2010; Johansen et al. 2006). If this concentration works well, that is, to a level of high densities, the solids might eventually collapse gravitationally to produce a larger body or planetesimal (Johansen et al. 2014). These objects only collapse gently, however, and it has been shown that the gravitational compression in this phase for small planetesimals is not strong enough to restructure them. Therefore, these objects become pebble piles with little self-gravity, and pebbles are dust aggregates (Blum et al. 2017; Wahlberg Jansson et al. 2017).
Due to this history, with little gravity and sticking, pebble pile planetesimals are very fragile. Any distortion might disassemble them again. This is especially true for gas drag, which is omnipresent in protoplanetary disks. As planetesimals are embedded within, the least they feel is a head wind (Weidenschilling 1977). With about 50 ms−1, this is rather high in favor of erosion. On the other hand, the pressure at submillibar is rather low, which reduces the shear stress imposed by gas drag significantly. On the destructive side, the almost negligible gravity might again make it easier to disassemble the body. These are clearly rather extreme conditions, and little experimental data or evidence is available on the impact of this delicate balance between opposing forces.
The closest related research in which experimental data have been gathered was made on erosion on Mars, where gravity is slightly reduced to 1/3 g and the atmospheric pressure is a few millibar. Wind tunnel experiments have been conducted in the Mars-relevant regimes of low pressure and/or low gravity (Greeley et al. 1980; White et al. 1987; Musiolik et al. 2018; Kruss et al. 2019; Demirci et al. 2019). Still, these data are orders of magnitude different from protoplanetary disk values. Paraskov et al. (2006) studied dust erosion at low pressures with planet formation in mind, but their micron-sized particles were no pebble piles. Demirci et al. (2020a) were the first to study erosion of millimeter-size glass beads simulating pebbles under low gravity of 0.01 g and at a pressure as low as 10 Pa. At these pressures, the flow changes from continuum to free molecular with respect to the individual grains as the mean free path of the molecules λ exceeds the particle diameter d. While other dependences on gravity and surface energy might still hold and have been deduced before (e.g., Shao & Lu 2000), the low-pressure range requires a correction factor fc, as shown by Demirci et al. (2020a). In any case, the important parameter for wind erosion is the threshold shear stress.
2 Shear stress
So far, threshold shear stress with respect to the onset of erosion on a planetesimal or small body surfaces can be characterized as (Demirci et al. 2020a)
 (1)
(1)
Here, particle or surface properties are the particle density ρp, particle diameter d, the effective surface energy γe, and α, which is a friction coefficient. The gravitational acceleration is g. The factor fc holds the influence of the gas regime, namely the Knudsen number Kn and β, which might be interpreted as a correction factor as particles are not within a free flow, but on a surface. The Knudsen number depends on the gas density ρg. Furthermore, kb = 1.38 × 10⁻²³ J K−1 is the Boltzmann constant, dm = 0.37 × 10⁻⁹ m is the molecule diameter, and Rg = 287.058 J kg−1 K−1 is the specific gas constant for dry air. The gas density can be determined from the pressure p using the ideal gas equation p = ρgRgT with the temperature T = 290 K.
Free parameters that might change with the sample are α, β, and γe. The best values based on experiments with glass beads so far were α = 6.4 × 10⁻³, γe = 7.3 × 10⁻⁵ J m−2, and β = 0.67 (for large glass beads; Demirci et al. 2020a).
Erosion in protoplanetary disks
When this is applied to protoplanetary disks, there are a few general consequences. First, pebble-pile planetesimals are destroyed on certain orbits. This has recently been studied by a number of authors (Rozner et al. 2020; Schaffer et al. 2020; Cedenblad et al. 2021; Demirci et al. 2020b,a). Due to the head wind in a typical disk, where ambient pressure decreases with distance, there should be a planetesimal-free region within the inner 1 au as there is always a head wind. If planetesimals consist of compressed dust and are no pebble piles, this region is small (Paraskov et al. 2006). For pebble piles, however, it can be quite significant and extend to several tenths of 1 au. This is therefore really important for planet formation.
Another consequence is that planetesimals might preferentially orbit on circular orbits. Before larger planetary bodies are present, for the first generation of planetesimals, this might not be much of an issue as planetesimals would not be on eccentric orbits. However, after the first larger oligarchs formed, planetesimals can be scattered into eccentric orbits (Ida 1990; Higuchi et al. 2006). Larger bodies have to be present before the gaseous disk dissolves in order to evolve into gas giants, and disks with embedded planets have been observed by now (Keppler et al. 2018). Gas drag will again decrease the eccentricities, but even in a gaseous disk, it will take several orbits for a planetesimal before the orbit might be circularized (Demirci et al. 2020b). As long as it moves on an eccentric orbit, a planetesimal will experience much higher wind speeds and gas densities at peri-astron. These will disassemble it at least partially on each orbit (Cedenblad et al. 2021; Schaffer et al. 2020; Paraskov et al. 2006; Demirci et al. 2020b).
There is another interesting implication here as this might transport material in the form of large planetesimals from outside of 1 au and redistribute it to pebbles inside of 1 au. So far, these ideas have not been exploited in detail. However, with a now much denser region, planetesimals on circular orbits could form, which might lead to a boost of planetesimal formation within the inner 1 au at the expense of eccentric planetesimals.
Finally, a further consequence is the erosion of planetesimals with respect to pebble accretion somewhat later in the evolution toward planets (Demirci & Wurm 2020). Even if planetesimals in the outer region are stable during their formation, when they later interact with a forming giant planet or planet with an atmosphere, the increased gas density will again allow a disassembly of the planetesimals. This has a large impact on the mass balance of accretion (Demirci & Wurm 2020).
With these applications in mind, we continued with experiments in microgravity to approach the conditions of protoplane-tary disks ever more realistically. Here, we specifically use dust aggregates as pebbles instead of glass beads. We also improved the setup so that we were able to quantify the erosion threshold at lower pressure, that is, as low as 1 Pa.
3 Parabolic flight experiments
3.1 Particle sample
One important motivation for this current work was to no longer simulate the planetesimal surface with glass beads. Instead, we moved to real dust aggregates that were produced quite similarly to what we would expect in protoplanetary disks, namely growing the dust aggregates until they reach the bouncing barrier. To do this, we started with SiO2 (quartz) dust here. Importantly, the individual dust grains were a few micrometers in size and therefore in the range expected in protoplanetary disks. In detail, our sample followed a log-normal distribution centered at 3 μm (see, e.g., Kruss & Wurm 2018 for the size distribution).
To produce the initial dust aggregates for the erosion experiments, the dust was placed on a vibrating plate. Dust grains now stuck together in collisions, grew, and were compacted until they reached about 1 mm in size. They now no longer grew further, but bounced off each other. After this process, the dust aggregates have the size distribution shown in Fig. 1. The volume filling factor of the dust aggregates is about 0.33, as determined by measuring the size and mass of numerous individual aggregates. An image of the eroding dust aggregates from an in-flight video is shown in Fig. 2. Overall, the aggregates are a factor 2 larger than the largest glass beads used before in Demirci et al. (2020a). They have different sticking properties because the surface is now composed of dust grains rather than being a flat glass surface, and the size distribution is slightly broader. These differences will likely influence the free parameters of Eq. (1).
3.2 Experimental setup
Figure 3 shows a schematic of the experimental setup, which is the same as was used by Demirci et al. (2020a). In a cylindrical vacuum chamber, a second smaller cylinder rotated at adjustable frequencies up to 200 Hz to create a shear flow. This design allowed the generation of a laminar wind profile over a sample bed at low pressures down to 1 Pa with a maximum transversal cylinder-wall speed of 125 ms−1. The dust sample was placed in a sample container attached to the side of the vacuum chamber. A lifter mechanism was used to move the surface of the dust bed into the wind. In addition, a shutter ensured that the sample bed was only exposed to the wind when the gravitational conditions were within a predefined range.
In order to simulate these gravitational conditions with this experiment, it was developed to be used in an aircraft that performed parabolic flights. We participated in the 38th DLR parabolic flight campaign in February 2022 on board Noves-pace’s Airbus A310 Zero-G. During the microgravity phase of a parabola, the residual gravity (g-jitter) has a characteristic profile. The g-jitter in flight direction is greater than the g-jitter in the other two directions only for a short period of 3–4 s, so that the total gravity is mainly directed into the sample container. As long as this is the case, the shutter is open and the sample bed is exposed to the wind. During the parabola, images of the dust sample are recorded by a side-mounted camera at a frame rate of 2002 fps. The pressure in the chamber can be varied as needed. For a more detailed description of the experiment itself and the procedure during a parabola, we refer to Demirci et al. (2020a).
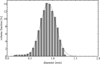 |
Fig. 1 Size distribution of dust aggregates. |
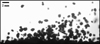 |
Fig. 2 Image of the dust aggregates from an in-flight video. |
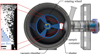 |
Fig. 3 Sketch of the experimental setup adapted from Demirci et al. (2020a). Erosion of a particle bed (right side inside the cylindrical vacuum chamber) is generated by a shear flow. |
3.3 Shear flow
The earlier experiments by Demirci et al. (2020a) showed that at submillibar pressure, the gas flow within the experiment is laminar. The flow velocity increases linearly with height until it reaches the speed of the central rotating wheel at its surface. We verified these characteristics again by tracking dust grains and deducing local gas speeds from them in analogy to Demirci et al. (2020a).
The details are not shown here as they do not provide new results. However, we again find a linear dependence of gas speed u on height h, in agreement with a simple laminar shear flow. From this, we can deduce the shear stress at a given speed of the wheel υw as
 (2)
(2)
Here, η = 18 μ Pa s is the viscosity of air, and hw„ = 0.033 m is the height of the wheel over the dust surface. As dust surface, we defined the position at which a linear fit to the measured velocities would be zero, which is in agreement with the observed surface. By successively increasing υw during the experiment until aggregates were clearly displaced by the wind, we were able to determine the threshold shear stress τt for erosion at different ambient pressures.
4 Results
One main goal was to determine erosion thresholds for shear stress at pressures as low as possible for dust aggregates to place the parameters in the range of protoplanetary disks. The onset of erosion was visible at a pressure of 1 Pa, an order of magnitude lower than before and well within the transition regime between free molecular flow and continuum flow. These threshold values are shown in Fig. 4.
The expected pressure dependence according to Eq. (1) was fit to the data, or
 (3)
(3)
where τ∞ is the shear stress for very high pressures, where fc = 1, and fc with its Kn/β dependence characterizes the increase at low pressure. According to Eq. (1), it is
 (4)
(4)
While for the microgravity experiments, gravity is likely lower than adhesion, they do not allow specifying α or γe independently. We therefore also carried out experiments for the threshold shear stress for dust aggregates under Earth gravity at 1 g. In this case, the gravity term dominates, that is, the adhesion term can be neglected and α can be calculated if τ∞ is known. For the 1 g experiment with dust aggregates, we found τ∞ = (0.030 ± 0.007) Pa at 2 mbar, that is, at a pressure where fc = 1 for the dust aggregates. This data point is not integrated into Fig. 4 because it is only relevant here for determining α. Since α is the friction coefficient, it is sample specific, but does not depend on gravity. By using Eq. (4), we obtain α = 0.035 ± 0.007. When this is known, Eq. (1) can be fit for γe and β. In summary, we find
 (5)
(5)
The data for the dust aggregates can clearly be well described by the equation found for glass beads. The validity of this equation is therefore extended to larger grains and lower pressures. The specific material constants are slightly different. Demirci et al. (2020a) reported higher values for β with increasing particle size, and our data seem to follow this trend as well. We recall, however, that we used dust aggregates in a dust-aggregate bed now, which might have slightly different aerodynamic properties (Schneider & Wurm 2021).
It might have been expected that dust would require higher shear stress to become entrained. That this is not the case depends on the somewhat lower density, but the effective surface energy also shows that the sticking is not higher. The history of their generation, terminated at the bouncing barrier, makes dust aggregate pebbles as little sticky as solid monolithic pebbles would be.
It might further be noted that these dust pebbles and their assemblies are also rather robust. Dust aggregates entrained in the gas flow and impacting on the granular bed sometimes later just produce splashes that are very similar to splashes of glass beads or other solids. While some fragmentation can take place at high-velocity impacts, it does not seem to change the morphology of the granular bed. At least erosion can proceed normally afterward. This is important to note as in protoplanetary disks, eroded pebbles can become projectiles for other planetesimals. Our experiments suggest that this might not influence gas-drag-based erosion, but rather adds to erosion, although this would be a different topic.
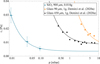 |
Fig. 4 Threshold shear stress τt over ambient pressure for the dust aggregates at 0.018 g and for glass spheres at 1 g from earlier experiments. The solid lines are fits of Eq. (1) to the data. The free parameters for dust aggregates, received from the fit, can be found in Eq. (5), and the free parameters for the larger glass spheres can be found at the end of Sect. 2. For more details on the glass sphere measurements, we refer to Demirci et al. (2020a). |
5 Forbidden orbits for planetesimals
As mentioned above, recent works concluded that pebble-pile planetesimals might not persist on every orbit. Depending on the eccentricity and disk model, the inner regions are excluded as these bodies are readily eroded. With our new values for the erosion of dust aggregate pebbles, we update these erosion zones here.
To do this, we have to compare the threshold shear stress τt above which a planetesimal is eroded with a maximum wall shear stress τw that acts on it at a certain distance from the star. Equation (1), together with the experimentally determined material-specific values (Eq. (5)), provides us with a way to calculate τt. It can be translated into a dependence on the semi-major axis of the planetesimal orbit Ro. Even though Ro does not appear directly in Eq. (1), it is implicitly included via the spatial dependence of the gas density ρ(Ro), (see Eq. (13)). The planetesimal radius r and the pebble size d can be set as parameters.
A few equations are currently discussed in the literature for the maximum wall shear stress τw that a body with radius r experiences in a gas flow. They might all be applicable here. For an orbit with semi-major axis Ro and eccentricity e, we therefore consider three different estimates in the following. For the first two, we can simply use Eq. (2), but with the relative velocity v between planetesimal and the surrounding gas and the thickness of the laminar boundary layer around the flowed body hB
 (6)
(6)
At this point, we use the values for hydrogen instead of air for all gas-specific constants, that is, Rg,h = 4124.2 J kg−1 K−1 and dm,h = 2.76 × 10⁻¹⁰ m. The dynamic viscosity of hydrogen ηh depends on the square root of the temperature
 (7)
(7)
with η0 = 8.9 μPa s being the dynamic viscosity at T = 280 K (May et al. 2007). The temperature in the protoplanetary disk is
 (8)
(8)
with T0 = 280 K (Hayashi 1981). As relative gas velocity υ, we assumed
 (9)
(9)
where we took υg = 54 ms−1 as the minimum gas velocity on a circular orbit around the star due to the pressure gradient (Weidenschilling 1977). The constants G and M are the gravitational constant and solar mass, respectively. If the orbit is not circular but eccentric, the headwind can increase significantly. We took the periastron as the position of erosion because the velocity is highest at this point. ∆υ in Eq. (9) takes this into account by describing the difference between the orbital velocity at periastron for a given eccentricity and for zero eccentricity.
The thickness of the laminar boundary layer around a plan-etesimal is not well defined, and different approaches were used to estimate it (Demirci & Wurm 2020; Cedenblad et al. 2021; Schlichting & Gersten 2006). We used the following two boundary-layer-approximations for the calculation of τw:
 (10)
(10)
In a third approach, the wall shear stress is calculated by an expression using the threshold friction velocity u*, similar to what was done by Demirci et al. (2020a):
![Mathematical equation: ${\tau _{\rm{w}}} = {\rho _g}{u^{*2}} = {\rho _{\rm{g}}}{\left[ {0.702\upsilon {{\left( {{\rm{Lo}}{{\rm{g}}_{10}}{{2r{\rho _g}\upsilon } \over {{\eta _{\rm{h}}}}}} \right)}^{ - 1.59}}} \right]^2}.$](/articles/aa/full_html/2023/04/aa45499-22/aa45499-22-eq11.png) (11)
(11)
The empirical equation for u* was developed by Greeley et al. (1980) on the basis of wind-tunnel experiments. For the final calculation of τw as well as τt, an expression for the gas density ρg and the gravitational acceleration g on the planetesimal is still needed. For gravity, we took
 (12)
(12)
with ρpla = 538 kg m−3 (Pätzold et al. 2018). As gas density, we took a power law according to the minimum-mass solar nebula (Hayashi 1981),
 (13)
(13)
with ρ0 = 1.4 × 10⁻⁶ kg m−3. When we take all this together, we have the tools for calculating τw and τt as a function of the orbit parameter Ro with the planetesimal radius r, the pebble size d, and the eccentricity of the orbit e as selectable parameters. With this, we can set up the following requirement for the stability of a planetesimal:
 (14)
(14)
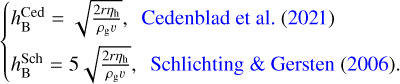
which allows us to make predictions on stable and unstable orbits. For a 2 km body with 1 mm pebbles, Fig. 5 shows the minimum safe orbits for different eccentricities e, that is, the value of the semi-major axis Ro for which the ratio of τt and τw equals one. For lower values of Ro, the shear stress on the planetesimal is greater than the threshold shear stress. It therefore becomes dismantled by the headwind. Figure 5 therefore illustrates a forbidden zone for planetesimals that extends up to 1 au even at low eccentricities of 0.1. If the eccentricities are higher, the threshold between forbidden and safe zone is displaced outward up to 3 au. In a forbidden zone, every pebble pile smaller than the respective planetesimal size is also instable down to a size at which particles decouple from the gas. Furthermore, these zones are somewhat larger than in earlier work now because the dust aggregate pebbles are not bound as strongly.
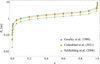 |
Fig. 5 Minimum orbits (semi-major axis Ro) for given eccentricities e at which a 2 km sized planetesimal composed of 1 mm pebbles is stable, i.e., τt/τw = 1 for three different options for calculating τw. At smaller orbits, the planetesimal is dismantled. |
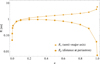 |
Fig. 6 Comparison of minimum stable orbits with the corresponding distances from the star at which most material is eroded. Upper line (circles): semi-major axis Ro of an eccentric planetesimal prone to erosion. Lower line (squares): periastron distance Rp at which pebbles are released (2 km planetesimal and 1 mm pebbles; boundary layer from Cedenblad et al. 2021). |
 |
Fig. 7 Schematic illustration of different planetesimal orbits. Planetesimals are stable in the outer disk (blue) and on circular orbits within 1 au (green). Eccentric planetesimals (red) will be lost for any accreting planet outside of 1 au, but provide pebbles for accretion onto a planet inside 1 au. If the snowline is around 1 au, water might also be efficiently transferred inward. |
6 Planetesimals in later evolutionary phases
In early phases of planet formation, the first forming planetesimals are likely on circular orbits and are only instable in a region close to the star. In later phases of planet formation, planetesimals are still present, but now planets can stir them up into eccentric orbits. These planets are thought to grow by accreting pebbles or planetesimals (Bitsch et al. 2019; Brügger et al. 2020). The fate of eccentric planetesimals is therefore relevant. If a planetesimal that encounters a planet is neither destroyed nor accreted, but scattered into an eccentric orbit, it might be dissolved into pebbles farther inward. To get an idea of the absolute scales, Fig. 6 shows an example of the periastron distance where pebbles are dumped by a planetesimal on an instable orbit.
For a planet outside of 1 au, these scattered planetesimals are lost as a source to accrete from. For a planet inside of 1 au, the generated pebbles are a new source of material.
If the snowline were in between, and if icy planetesimals could be disassembled in the same way, then water could also be transported more readily from beyond the snowline to a place farther inside of the snowline. Figure 7 shows a schematic of these ideas.
7 Conclusions
In laboratory experiments on parabolic flights, we extended earlier findings on the erosion of pebble-pile bodies in proto-planetary disks. We used ~ 1 mm dust aggregates as pebbles now and were able to decrease the ambient pressure for which we find erosion by another order of magnitude to 1 Pa. While the gravity level is still higher than on planetesimals, the extrapolation to protoplanetary disks becomes more reliable. In general, dust aggregate pebbles were found to be more susceptible to erosion than the glass beads used before, that is, they are less dense and as little sticky as glass beads.
In the scenario in which planetesimals form through a gentle gravitational collapse of a pebble cloud, some zones are ruled out for their existence. High-eccentricity planetesimals can only survive erosion by the head wind of a protoplanetary disk outside of about 1–3 au, but even planetesimals on circular orbits are not stable inside of 0.01–0.1 au.
Therefore, in one way or another, erosion sorts out different populations of planetesimals at different locations and provides matter for generating the next generation planetesimals or for accretion onto planets farther inward. This might also be a way of transporting water inward. The architecture of planetary systems will be shaped by the destruction of pebble-pile planetesimals and their reassembly. To what end this shaping is used remains to be seen, but as erosion can decide whether a planetesimal with certain orbital parameters exists or not, it should make a significant difference.
Acknowledgements
This project is funded by DLR space administration with funds provided by the BMWK under grant 50 WM 2140. K.J., F.C.O., and T.B. are funded by grants 50 WM 1943, 50 WM 2142, and 50 WM 2049, respectively. M.F. is funded by DFG TE 890/7-1.
References
- Bitsch, B., Izidoro, A., Johanse, A., et al. 2019, A&A, 623, A88 [NASA ADS] [CrossRef] [EDP Sciences] [Google Scholar]
- Blum, J., & Wurm, G. 2000, Icarus, 143, 138 [NASA ADS] [CrossRef] [Google Scholar]
- Blum, J., & Wurm, G. 2008, ARA&A, 46, 21 [Google Scholar]
- Blum, J., Wurm, G., Kempf, S., et al. 2000, Phys. Rev. Lett., 85, 2426 [Google Scholar]
- Blum, J., Gundlach, B., Krause, M., et al. 2017, MNRAS, 469, S755 [Google Scholar]
- Brügger, N., Burn, R., Coleman, G. A. L., Alibert, Y., & Benz, W. 2020, A&A, 640, A21 [NASA ADS] [CrossRef] [EDP Sciences] [Google Scholar]
- Carrera, D., & Simon, J. B. 2022, ApJ, 933, L10 [NASA ADS] [CrossRef] [Google Scholar]
- Cedenblad, L., Schaffer, N., Johansen, A., Mehlig, B., & Mitra, D. 2021, ApJ, 921, 123 [NASA ADS] [CrossRef] [Google Scholar]
- Chiang, E., & Youdin, A. N. 2010, Annu. Rev. Earth Planet. Sci., 38, 493 [CrossRef] [Google Scholar]
- Demirci, T., & Wurm, G. 2020, A&A, 641, A99 [NASA ADS] [CrossRef] [EDP Sciences] [Google Scholar]
- Demirci, T., Teiser, J., Steinpilz, T., et al. 2017, ApJ, 846, 48 [Google Scholar]
- Demirci, T., Kruss, M., Teiser, J., et al. 2019, MNRAS, 484, 2779 [NASA ADS] [CrossRef] [Google Scholar]
- Demirci, T., Schneider, N., Steinpilz, T., et al. 2020a, MNRAS, 493, 5456 [NASA ADS] [CrossRef] [Google Scholar]
- Demirci, T., Schneider, N., Teiser, J., & Wurm, G. 2020b, A&A, 644, A20 [NASA ADS] [CrossRef] [EDP Sciences] [Google Scholar]
- Dittrich, K., Klahr, H., & Johansen, A. 2013, ApJ, 763, 117 [NASA ADS] [CrossRef] [Google Scholar]
- Greeley, R., Leach, R., White, B., Iversen, J., & Pollack, J. 1980, Geophys. Res. Lett., 7, 121 [NASA ADS] [CrossRef] [Google Scholar]
- Hayashi, C. 1981, Prog. Theor. Phys. Suppl., 70, 35 [Google Scholar]
- Higuchi, A., Kokubo, E., & Mukai, T. 2006, AJ, 131, 1119 [NASA ADS] [CrossRef] [Google Scholar]
- Ida, S. 1990, Icarus, 88, 129 [CrossRef] [MathSciNet] [Google Scholar]
- Johansen, A., Klahr, H., & Henning, T. 2006, ApJ, 636, 1121 [NASA ADS] [CrossRef] [Google Scholar]
- Johansen, A., Blum, J., Tanaka, H., et al. 2014, Protostars and Planets VI, 547 [Google Scholar]
- Jungmann, F., & Wurm, G. 2021, A&A, 650, A77 [NASA ADS] [CrossRef] [EDP Sciences] [Google Scholar]
- Jungmann, F., Steinpilz, T., Teiser, J., & Wurm, G. 2018, J. Phys. Commun., 2, 095009 [Google Scholar]
- Kelling, T., Wurm, G., & Köster, M. 2014, ApJ, 783, 111 [Google Scholar]
- Keppler, M., Benisty, M., Müller, A., et al. 2018, A&A, 617, A44 [NASA ADS] [CrossRef] [EDP Sciences] [Google Scholar]
- Kruss, M., & Wurm, G. 2018, ApJ, 869, 45 [NASA ADS] [CrossRef] [Google Scholar]
- Kruss, M., Demirci, T., Koester, M., Kelling, T., & Wurm, G. 2016, ApJ, 827, 110 [Google Scholar]
- Kruss, M., Teiser, J., & Wurm, G. 2017, A&A, 600, A103 [NASA ADS] [CrossRef] [EDP Sciences] [Google Scholar]
- Kruss, M., Musiolik, G., Demirci, T., Wurm, G., & Teiser, J. 2019, Icarus, 113438 [Google Scholar]
- Lee, V., Waitukaitis, S. R., Miskin, M. Z., & Jaeger, H. M. 2015, Nat. Phys., 11, 733 [Google Scholar]
- May, E., Berg, R., & Moldover, M. 2007, Int. J. Thermophys., 28, 1085 [CrossRef] [Google Scholar]
- Musiolik, G., Kruss, M., Demirci, T., et al. 2018, Icarus, 306, 25 [NASA ADS] [CrossRef] [Google Scholar]
- Paraskov, G. B., Wurm, G., & Krauss, O. 2006, ApJ, 648, 1219 [NASA ADS] [CrossRef] [Google Scholar]
- Pätzold, M., Andert, T. P., Hahn, M., et al. 2018, MNRAS, 483, 2337 [Google Scholar]
- Rozner, M., Grishin, E., & Perets, H. B. 2020, MNRAS, 496, 4827 [NASA ADS] [CrossRef] [Google Scholar]
- Schaffer, N., Johansen, A., Cedenblad, L., Mehling, B., & Mitra, D. 2020, A&A, 639, A39 [NASA ADS] [CrossRef] [EDP Sciences] [Google Scholar]
- Schlichting, H., & Gersten, K. 2006, Grenzschicht-Theorie (Springer) [Google Scholar]
- Schneider, N., & Wurm, G. 2021, A&A, 655, A50 [NASA ADS] [CrossRef] [EDP Sciences] [Google Scholar]
- Shao, Y., & Lu, H. 2000, J. Geophys. Res.: Atmos., 105, 22437 [NASA ADS] [CrossRef] [Google Scholar]
- Steinpilz, T., Teiser, J., & Wurm, G. 2019, ApJ, 874, 60 [NASA ADS] [CrossRef] [Google Scholar]
- Teiser, J., Kruss, M., Jungmann, F., & Wurm, G. 2021, ApJ, 908, L22 [Google Scholar]
- Wahlberg Jansson, K., Johansen, A., Bukhari Syed, M., & Blum, J. 2017, ApJ, 835, 109 [NASA ADS] [CrossRef] [Google Scholar]
- Weidenschilling, S. J. 1977, MNRAS, 180, 57 [Google Scholar]
- White, B., Greeley, R., Leach, R., & Iversen, J. 1987, 25th AIAA Aerospace Sciences Meeting, 621 [Google Scholar]
- Windmark, F., Birnstiel, T., Güttler, C., et al. 2012, A&A, 540, A73 [NASA ADS] [CrossRef] [EDP Sciences] [Google Scholar]
- Wurm, G., & Blum, J. 1998, Icarus, 132, 125 [NASA ADS] [CrossRef] [Google Scholar]
- Wurm, G., & Teiser, J. 2021, Nat. Rev. Phys., 3, 405 [CrossRef] [Google Scholar]
- Zsom, A., Ormel, C. W., Güttler, C., Blum, J., & Dullemond, C. P. 2010, A&A, 513, A57 [NASA ADS] [CrossRef] [EDP Sciences] [Google Scholar]
All Figures
|
Fig. 1 Size distribution of dust aggregates. |
| In the text | |
|
Fig. 2 Image of the dust aggregates from an in-flight video. |
| In the text | |
|
Fig. 3 Sketch of the experimental setup adapted from Demirci et al. (2020a). Erosion of a particle bed (right side inside the cylindrical vacuum chamber) is generated by a shear flow. |
| In the text | |
|
Fig. 4 Threshold shear stress τt over ambient pressure for the dust aggregates at 0.018 g and for glass spheres at 1 g from earlier experiments. The solid lines are fits of Eq. (1) to the data. The free parameters for dust aggregates, received from the fit, can be found in Eq. (5), and the free parameters for the larger glass spheres can be found at the end of Sect. 2. For more details on the glass sphere measurements, we refer to Demirci et al. (2020a). |
| In the text | |
|
Fig. 5 Minimum orbits (semi-major axis Ro) for given eccentricities e at which a 2 km sized planetesimal composed of 1 mm pebbles is stable, i.e., τt/τw = 1 for three different options for calculating τw. At smaller orbits, the planetesimal is dismantled. |
| In the text | |
|
Fig. 6 Comparison of minimum stable orbits with the corresponding distances from the star at which most material is eroded. Upper line (circles): semi-major axis Ro of an eccentric planetesimal prone to erosion. Lower line (squares): periastron distance Rp at which pebbles are released (2 km planetesimal and 1 mm pebbles; boundary layer from Cedenblad et al. 2021). |
| In the text | |
|
Fig. 7 Schematic illustration of different planetesimal orbits. Planetesimals are stable in the outer disk (blue) and on circular orbits within 1 au (green). Eccentric planetesimals (red) will be lost for any accreting planet outside of 1 au, but provide pebbles for accretion onto a planet inside 1 au. If the snowline is around 1 au, water might also be efficiently transferred inward. |
| In the text | |
Current usage metrics show cumulative count of Article Views (full-text article views including HTML views, PDF and ePub downloads, according to the available data) and Abstracts Views on Vision4Press platform.
Data correspond to usage on the plateform after 2015. The current usage metrics is available 48-96 hours after online publication and is updated daily on week days.
Initial download of the metrics may take a while.