Fig. 6
Download original image
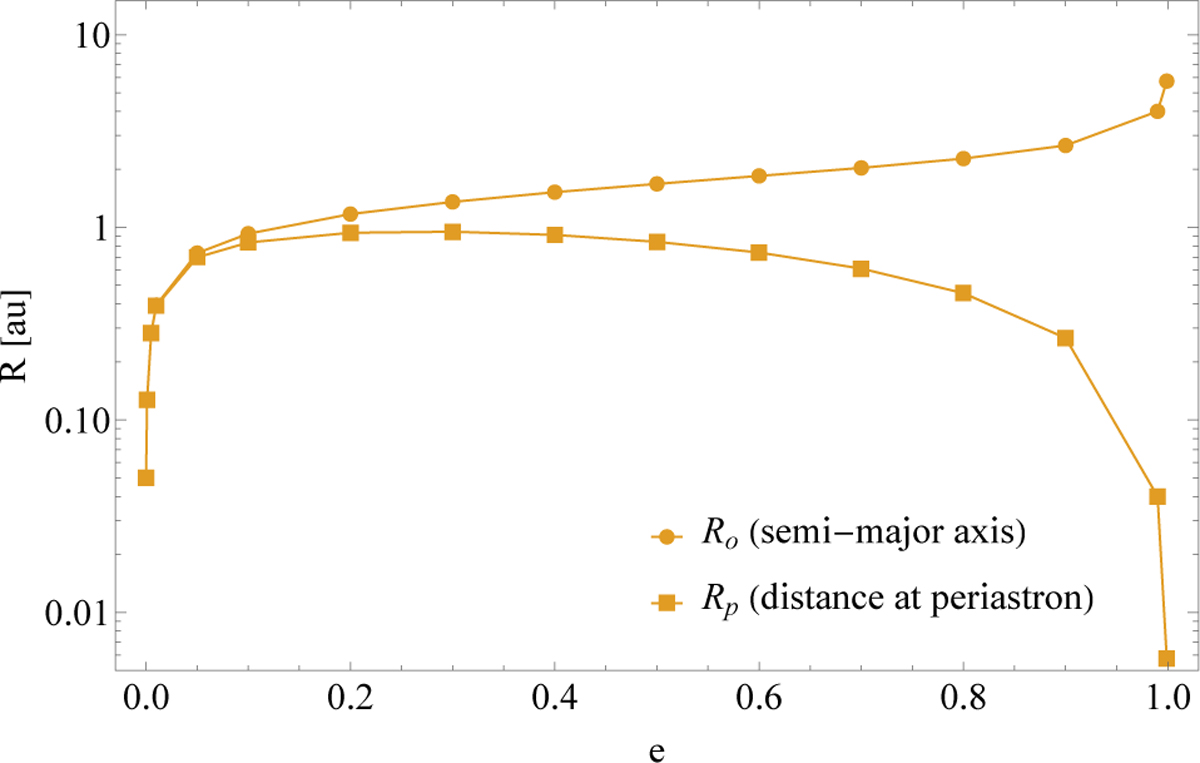
Comparison of minimum stable orbits with the corresponding distances from the star at which most material is eroded. Upper line (circles): semi-major axis Ro of an eccentric planetesimal prone to erosion. Lower line (squares): periastron distance Rp at which pebbles are released (2 km planetesimal and 1 mm pebbles; boundary layer from Cedenblad et al. 2021).
Current usage metrics show cumulative count of Article Views (full-text article views including HTML views, PDF and ePub downloads, according to the available data) and Abstracts Views on Vision4Press platform.
Data correspond to usage on the plateform after 2015. The current usage metrics is available 48-96 hours after online publication and is updated daily on week days.
Initial download of the metrics may take a while.