| Issue |
A&A
Volume 690, October 2024
|
|
|---|---|---|
| Article Number | A263 | |
| Number of page(s) | 19 | |
| Section | Planets and planetary systems | |
| DOI | https://doi.org/10.1051/0004-6361/202451120 | |
| Published online | 14 October 2024 | |
TESS discovery of two super-Earths orbiting the M-dwarf stars TOI-6002 and TOI-5713 near the radius valley
1
Astrobiology Research Unit, Université de Liège,
Allée du 6 Août 19C,
4000
Liège,
Belgium
2
Oukaimeden Observatory, High Energy Physics and Astrophysics Laboratory, Cadi Ayyad University,
Marrakech,
Morocco
3
Department of Earth, Atmospheric and Planetary Science, Massachusetts Institute of Technology,
77 Massachusetts Avenue,
Cambridge,
MA
02139,
USA
4
Kavli Institute for Astrophysics and Space Research, Massachusetts Institute of Technology,
Cambridge,
MA
02139,
USA
5
Dpto. Física Teórica y del Cosmos, Universidad de Granada,
18071
Granada,
Spain
6
Avature Machine Learning, Planta Sexta,
Madrid
28004,
Spain
7
Carl Sagan Institute at Cornell University,
Space Science Building,
Ithaca,
NY
14850,
USA
8
School of Physics & Astronomy, University of Birmingham,
Edgbaston,
Birmimgham
B15 2TT,
UK
9
Instituto de Astrofísica de Andalucía (IAA-CSIC),
Glorieta de la Astronomía s/n,
18008
Granada,
Spain
10
Center for Astrophysics | Harvard & Smithsonian,
60 Garden Street,
Cambridge,
MA
02138,
USA
11
Department of Astronomy & Astrophysics, University of California San Diego,
La Jolla,
CA
92093,
USA
12
Instituto de Astrofísica de Canarias (IAC),
Calle Vía Láctea s/n,
38200,
La Laguna,
Tenerife,
Spain
13
Departamento de Astrofísica, Universidad de La Laguna (ULL),
38206
La Laguna,
Tenerife,
Spain
14
Department of Physics and Astronomy, Vanderbilt University,
Nashville,
TN
37235,
USA
15
Space Sciences, Technologies and Astrophysics Research (STAR) Institute, Université de Liège,
Allée du 6 Août 19C,
4000
Liège,
Belgium
16
NASA Ames Research Center,
Moffett Field,
CA
94035,
USA
17
Komaba Institute for Science, The University of Tokyo,
3-8-1 Komaba, Meguro,
Tokyo
153-8902,
Japan
18
Astrobiology Center,
2-21-1 Osawa, Mitaka,
Tokyo
181-8588,
Japan
19
Department of Multi-Disciplinary Sciences, Graduate School of Arts and Sciences, The University of Tokyo,
3-8-1 Komaba, Meguro,
Tokyo
153-8902,
Japan
20
National Astronomical Observatory of Japan,
2-21-1 Osawa, Mitaka,
Tokyo
181-8588,
Japan
21
Department of Physics and Kavli Institute for Astrophysics and Space Research, Massachusetts Institute of Technology,
Cambridge,
MA
02139,
USA
22
Royal Astronomical Society,
Burlington House, Piccadilly,
London
W1J 0BQ,
UK
23
NASA Goddard Space Flight Center,
8800 Greenbelt Rd,
Greenbelt,
MD
20771,
USA
24
Crow Observatory,
Portalegre,
Portugal
25
Bryant Space Science Center, Department of Astronomy, University of Florida,
Gainesville,
FL
32611,
USA
26
Department of Physics, Massachusetts Institute of Technology,
Cambridge,
MA
02139,
USA
27
Jet Propulsion Laboratory, California Institute of Technology,
Pasadena,
CA
91109
USA
28
NASA Exoplanet Science Institute, IPAC, California Institute of Technology,
Pasadena,
CA
91125
USA
29
Department of Physics and Astronomy, University of Kansas,
Lawrence,
KS 66045,
USA
30
Department of Astronomy, University of California Berkeley,
Berkeley,
CA
94720,
USA
31
Department of Physics, Center for Astrophysics & Space Sciences, University of California San Diego,
La Jolla,
CA
92093,
USA
32
Department of Physics and Astronomy, University of Notre Dame,
South Bend,
IN
46556,
USA
★ Corresponding author; This email address is being protected from spambots. You need JavaScript enabled to view it.
Received:
14
June
2024
Accepted:
18
August
2024
Abstract
We present the validation of two TESS super-Earth candidates transiting the mid-M dwarfs TOI-6002 and TOI-5713 every 10.90 and 10.44 days, respectively. The first star (TOI-6002) is located 32.038 ± 0.019 pc away, with a radius of 0.2409−0.0065+0.0066 R⊙, a mass of 0.2105−0.0048+0.0049 M⊙, and an effective temperature of 3229−57+77 K. The second star (TOI-5713) is located 40.946 ± 0.032 pc away, with a radius of 0.2985−0.0072+0.0073 R⊙, a mass of 0.2653 ± 0.0061 M⊙, and an effective temperature of 3225−40+41 K. We validated the planets using TESS data, ground-based multi-wavelength photometry from many ground-based facilities, as well as high-resolution AO observations from Keck/NIRC2. TOI-6002 b has a radius of 1.65−0.19+0.22 R⊕ and receives 1.77−0.110.16S⊕. TOI-5713 b has a radius of 1.77−0.11+0.13 R⊕ and receives 2.42 ± 0.11S⊕. Both planets are located near the radius valley and near the inner edge of the habitable zone of their host stars, which makes them intriguing targets for future studies to understand the formation and evolution of small planets around M-dwarf stars.
Key words: methods: numerical / techniques: photometric / planets and satellites: detection
© The Authors 2024
 Open Access article, published by EDP Sciences, under the terms of the Creative Commons Attribution License (https://creativecommons.org/licenses/by/4.0), which permits unrestricted use, distribution, and reproduction in any medium, provided the original work is properly cited.
This article is published in open access under the Subscribe to Open model. This email address is being protected from spambots. You need JavaScript enabled to view it. to support open access publication.
1 Introduction
The Transiting Exoplanets Survey Satellite (TESS; Ricker et al. 2015) has significantly increased the sample of exoplanets smaller than Neptune and larger than Earth (broadly called “super-Earths” and “sub-Neptunes”) known to orbit nearby stars. The absence of planets in this size range in our own Solar System limits us to understand how these planets form and evolve, making them compelling targets to investigate. Although it is arguably important to focus on a wide range of stellar types to study exoplanets, M dwarfs provide appealing targets for our study of super-Earths due to their abundance in our galaxy (Henry et al. 2019; Reylé et al. 2021) and the significantly more favorable planet-to-star size ratio compared to Sun-analog stars. Especially planets at the inner edge of the Habitable Zone (HZ) provide compelling targets because of the transition from hot, potentially habitable rocky worlds to Venus-like worlds (Kaltenegger et al. 2023). Especially planets close to the inner edge of the HZ of M dwarfs, which could arguably show extended secondary atmospheres resulting from a runaway greenhouse effect, thus provide very interesting targets for observations (Kaltenegger et al. 2023; Delrez et al. 2022; Turbet et al. 2019).
The abundance and the distribution of planets with radii below 4 R⊕ for orbits shorter than 100 days allows the identification of specific features that can link their abundance to their formation and evolution like the radius valley (see e.g. Fulton et al. 2017; Cloutier & Menou 2020) and the density valley (Luque & Pallé 2022), based on their radii and densities distributions. The radius valley features a lack in planets ranging from 1.5 to 2 R⊕. In this regard, some studies argue that rocky super-Earths are a byproduct of atmospheric escape experienced by gaseous sub-Neptunes driven by the energy radiated by the host stars (see e.g. Lopez & Fortney 2013; Owen & Wu 2013; Jin et al. 2014; Chen & Rogers 2016) and (or) the energy released by their cooling planetary cores (see e.g. Owen & Wu 2013; Ginzburg et al. 2016, 2018). Other studies argue that some planets are formed as rocky super-Earths in a gas-depleted (see e.g. Lopez & Rice 2018; Cloutier & Menou 2020; Cherubim et al. 2023) or gas-poor environment with thin gaseous envelopes (see e.g. Lee & Connors 2021; Cherubim et al. 2023). Additional theoretical studies predict that the sub-population of sub-Neptunes consists typically of water-rich worlds formed beyond the water ice-line and migrate toward their host stars (see e.g. Venturini et al. 2020, 2024; Burn et al. 2024). The density valley features three peaks in the density distribution defining rocky super-Earths, water-rich worlds, and puffy sub-Neptunes. Luque & Pallé (2022) suggest that the pebble accretion is the main mechanism forming these planets with super-Earths formed within the ice line and water-rich world formed outside it (see e.g. Venturini et al. 2020, 2024; Burn et al. 2024). For now the mechanisms forming super-Earths remain unclear, making observations of planets in this mass-radius regime a critical part to understand it.
TESS is increasing the number of small exoplanets amenable to mass and atmospheric characterization (Ricker et al. 2015; Sullivan et al. 2015). Detailed studies of such exoplanets will allow insights into the origin of the radius and density valleys in the near future. Such analyses should shed further light on the mechanisms dominating the formation and evolution of super-Earths. In addition, the analyses of exoplanets with incident irradiation between Earth and Venus will allow key insights into the limits of the HZ (e.g. Kaltenegger et al. 2023).
This paper reports the validation of two super-Earths, TOI-6002 b  and TOI-5713 b
  orbiting two mid- type M-dwarf stars, TOI-6002 and TOI-5713 . They were first detected by TESS, and validated in this study using various ground-based observations (see Sect. 2). The masses of both planets are left unconstrained by our observations, but their radii suggest rocky or water-rich composition. Note that precise mass measurements should be possible with state-of-the art Doppler spectographs to derive their masses, as discussed in more detail in Sect. 4.
The paper is structured as follows. Sect. 2 introduces the data from TESS and all ground-based observations. Stellar characterization, validation of the planetary nature of the two TESS candidates, and global data analyses are covered in Sect. 3. Results, potential for mass measurements, and atmospheric characterization are discussed for both planets in Sect. 4. Sect. 5 summarizes our findings.
Ground-based facilities and their corresponding parameters used in the time-series photometric observations of TOI-6002 and TOI-5713.
2 Observations
This section presents all observations of TOI-6002 and TOI-5713 obtained from space and ground-based instruments. In Table 1, we summarize all the ground-based, photometric time-series observations, as well as the observation parameters. We note that the differential photometry was performed using uncontaminated circular apertures for all ground-based observations.
2.1 TESS photometry
TOI-6002 was observed by TESS in sectors 14 (18 July to 14 August 2019), 41 (24 July to 20 August 2021), and 54–55 (9 July to 1 September 2022). TOI-5713 was observed by TESS in sectors 16 (12 September to 06 October 2019), 22–23 (19 February to 15 April 2020), and 49 (26 February to 25 March 2022). Note that this target was also observed in sectors 74 and 75 from 03 January to 26 February 2024. These two sectors were not included in our analyses here (see Sect. 3.6), but the data appears consistent with our results and will be used as part of future research on these planets.
The TESS time-series observations were processed by the TESS Science Processing Operations Center (SPOC) pipeline (Jenkins et al. 2016, 2020). SPOC calibrates the image data, carries out quality control, labels bad data, and performs simple aperture photometry (SAP) for each star in the field of view. Then, it corrects for instrumental systematic offsets using a Presearch Data Conditioning module (PDC: Smith et al. 2012; Stumpe et al. 2012, 2014) and produces pre-search data conditioned light curves. Appendix A.1 shows the target pixel files (TPFs) and the SAP apertures used for photometry, along with the overlaid locations of nearby Gaia DR2 (Gaia Collaboration 2018) sources.
The SPOC pipeline executed a transit search of the combined light curve from sectors 14–55 on 11 September 2022 for TOI-6002 and from sectors 16–49 on 05 May 2020 for TOI-5713 (Jenkins 2002; Jenkins et al. 2020), yielding a threshold crossing event (TCE, a statistically significant periodic, transit-like signal on the target star) with a 10.9 day period for the first target and a TCE with a 10.44 day period for the second. Initial limb-darkened transit models were fitted (Li et al. 2019) and a suite of diagnostic tests were performed to prove or refute the planetary origin of the signals (Twicken et al. 2018) for both TCEs. The difference image centroiding tests conducted for the sectors 14–55 search of TOI-6002 and the sectors 16–49 search of TOI-5713 constrained the location of the target star to within 4.6±4.1″ and 3.4±3.2″ of the transit source, respectively. The two transit signatures passed all diagnostic tests presented in the SPOC data validation reports to discard different possible false positives, mainly eclipsing binaries and blended eclipsing binaries. The TESS Science Office (TSO) evaluated the vetting information and issued an alert for TOI-6002 b on 01 December 2022 and for TOI-5713 b on 8 August 2022.
For our analyses, we downloaded the 2-minute PDC-SAP light curves from the Mikulski Archive for Space Telescopes (MAST1). Using the “QUALITY” flag, we identified all the bad-quality data points that were removed from the data files. The year two data of TESS were subject to sky background overes-timation in the SPOC pipeline for dim and (or) crowded targets, affecting the transit depth and, thus, the planet radius. TOI-6002 is a crowded-field target and was subjected to this effect in sector 14. We corrected the PDC-SAP light curves of sector 14 using Eq. (2) described in Section 4.2 of the data release notes of sector 272 (see Section 4.2, Eq. (2)). This effect was negligible for TOI-5713 due to the low level of crowding. The light curve of TOI-5713 showed some clear flare-like signals, which we removed using an upper 3σ clipping. We used wotān (Hippke et al. 2019) to detrend the light curves for stellar variability, utilizing a bi-weight filter with a window 2.5 times longer than each planets’ transit duration. The obtained lightcurves are presented in Appendix A.2, with the locations of the transit signals highlighted with different colors.
2.2 Ground-based photometry
2.2.1 LCOGT-1 m0 photometry
We used the 4096×4096 SINISTRO CCD camera on the 1.0-m robotic telescope of the Las Cumbres Observatory Global Telescope (LCOGT; Brown et al. 2013) network node at Teide Observatory (Tenerife, Spain) to observe two full transits of TOI-6002 b on UT 2023 May 13 and 24. Table 1 provides the observation parameters. We used the standard LCOGT BANZAI pipeline (McCully et al. 2018) to calibrate the science images, and we used AstroImageJ (AIJ: Collins et al. 2017) for the photometric extraction.
2.2.2 LCOGT MuSCAT3 photometry
We used the MuSCAT3 multi-band imager (Narita et al. 2020) on the LCOGT 2m Faulkes Telescope North at Haleakala Observatory on Maui (Hawaii) to observe one full transit of TOI-6002b on UTC August 19, 2023 (see Table 1 for more details). The multi-band observation covered 𝑔, r, i, and zs bands simultaneously. The data reduction and aperture photometry were performed in a similar way as described in the previous section.
2.2.3 TRAPPIST-North photometry
We used the CCD camera on TRAPPIST-North, a 0.6-m robotic telescope at Oukaimeden Observatory in Morocco (Jehin et al. 2011; Gillon et al. 2013; Barkaoui et al. 2019; Ghachoui et al. 2023), to observe a full transit of TOI-5713 b on UTC June 17, 2023 (see Table 1). We observed with the non-standard I+z′ filter. The data reduction and photometry were performed using AstroImageJ.
2.2.4 MuSCAT2 photometry
For TOI-5713 b, we observed one full transit on UTC July 8, 2023 (see Table 1), using the multi-color imager (𝑔, r, i, and zS bands) MuSCAT2 (Narita et al. 2019), mounted on the 1.52-m Telescopio Carlos Sánchez (TCS) at Teide Observatory, Spain. We used the 𝑔 band images for guiding, as the star is faint in the blue optical (B ~ 17 mag). We calibrated and reduced the raw data using the code and procedure of Parviainen et al. (2019). Due to the short exposure time and the faintness of the target, the MuSCAT2 𝑔 band photometry presented a much larger scatter than in the other bands, and it was not used in the analysis presented below.
We also observed a full transit of TOI-6002 b with MuS-CAT2 on UTC October 01, 2023. However, this observation was affected by clouds around the mid-transit time, and thus was omitted in the global analyses.
2.3 Spectroscopic observations
2.3.1 IRTF/SpeX
We used the SpeX spectrograph (Rayner et al. 2003) on the 3.2-m NASA Infrared Telescope Facility (IRTF) to collect a near-infrared spectrum of TOI-5713 on 2023 May 16 (UT) and TOI-6002 on 2023 Oct 31 (UT). On both nights, conditions were clear with seeing of 0″.6–0″.7. We used the short-wavelength cross-dispersed (SXD) mode, and aligned the 0″.3 × 15″ slit to the parallactic angle. The resulting spectra span 0.80–2.42 µm and have a resolving power of R~2000. We collected six integrations of 139.9 s on TOI-5713 and 299.8 s on TOI-6002, using an ABBA nod pattern. Immediately after the science observations, we gathered a standard set of flat-field and arc-lamp calibrations and observed A0 V standard stars. We reduced the data with Spextool v4.1 (Cushing et al. 2004), following the standard instructions from the Spextool User’s Manual3. The final spectrum of TOI-5713 has a median per-pixel S/N of 92 with peak values in the J, H, and K bands of of 116, 131, and 121, respectively. For TOI-6002, the final spectrum has a median S/N per pixel of 156 with peak values of 195, 219, and 205 in the J, H, and K bands, respectively.
2.3.2 Shane telescope/kast double spectrograph observations
We observed TOI-5713 and TOI-6002 with the Kast Double Spectrograph (Miller & Stone 1994) on the 3-m Shane Telescope at Lick Observatory. TOI-5713 was observed on 2023 July 7 (UT) in clear conditions with 1.1″ seeing; TOI-6002 was observed on 2023 November 5 (UT) in partly cloudy conditions with 1″.2 seeing. We used both the red and blue channels of Kast split by the D57 dichroic at 5700 Å and the 1.5″-wide slit for both observations. In the red channel, we used the 600/7500 grating providing 5900-9000 Å wavelength coverage at an average resolution of λ/∆λ = 1450. In the blue channel, we used the 600/4310 grism providing 3600–5600 Å wavelength coverage at an average resolution of λ/∆λ = 1100. For TOI-5713, we obtained one blue exposure of 1200 s and two red exposures of 600 s each at an average airmass of 1.07; for TOI-6002, we obtained one blue exposure of 900 s and two red exposures of 450 s each at an average airmass of 1.03. We observed a nearby G2 V star immediately after each source for calibration of telluric absorption, and spectrophotomeric flux standards PG 1708+60 and BD +28 4211 (Hamuy et al. 1992, 1994) during each night for flux calibration. Flat-field lamps, HeNeAr arc lamps, and HgCd arc lamps were also observed at the start of each night for pixel response and wavelength calibration.
All data were reduced using the kastredux package4, which included image calibration (pixel response correction, conversion to electrons/second, bad pixel masking), boxcar extraction with median background subtraction, wavelength calibration, flux calibration, and correction of telluric absorption in the red channel. The final spectra have median signals-to-noise of 140 in both red channels (near 7450 Å) and 45 in the blue channel of TOI-6002 (near 5100 Å). Due to calibration issues, we discarded the blue observations of TOI-5713.
2.4 High-resolution imaging
To constrain possible contamination by bound or line-of-sight companions (Ciardi et al. 2015), We observed TOI-5713 and TOI-6002 with near-infrared adaptive optics (AO) imaging at the Keck (2023-Jun.-10 UT) and at the Palomar (2023-Jun.-08 UT) Observatory.
TOI-5713 was observed with the NIRC2 instrument on Keck-II (10 m) using the natural guide star AO system (Wizinowich et al. 2000) utilizing a standard 3-point dither pattern. Each position in the dither pattern is offset from the previous position by 3″. The 3-point dither pattern was performed 3 times, each pattern offset from the previous pattern by 0.5″, resulting in a total of 9 on-target exposures. NIRC2 was used in the narrow-angle mode with the full field of view (~10″) and a pixel scale of roughly 0.0099442″ per pixel. Observations were made in the Kcont filter (λ0 = 2.2706; ∆λ = 0.0296 µm) with an integration time of 15 seconds per dither position, yielding a total of 135 seconds on-source time.
We observed TOI-6002 with the PHARO instrument (Hayward et al. 2001) on the Palomar Hale (5m) using the P3K natural guide star AO system (Dekany et al. 2013) in the narrowband Br-γ filter (λo = 2.1686; ∆λ = 0.0326 µm). The PHARO pixel scale is 0.025” per pixel. We twice repeated a standard 5-point quincunx dither pattern with steps of 5″, separating each repeat by 0.5″. We used a single frame integration time of 15 s, yielding a total integration of 225 seconds.
Flat fields were taken on-sky, dark-subtracted, and median averaged. We generated sky frames using the median average of the dithered science frames. We then sky-subtracted and flat-fielded each science frame and combined the calibrated science frames into a single mosaiced image. The final resolutions of the combined dithers, determined from the full-width half-maximum (FWHM) of the point spread functions, were 0.057″ and 0.108″ for TOI-5713 and TOI-6002, respectively.
We assessed the sensitivities of the final combined AO image by injecting simulated sources azimuthally around the primary target, following the approach of Furlan et al. (2017). Fig. 1 shows the resulting sensitivity curves. We do not detect close-in (≲1″) stellar companions for either star. The Keck and Palomar data have sensitivities of δma𝑔 ≈ 7.5 mag and 6.9 mag at 0.5″, respectively. This corresponds to a spatial limit <32 au for TOI-6002 and <40.94 au for TOI-5713.
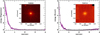 |
Fig. 1 NIR AO imaging and sensitivity curve for TOI 5713 (Keck) and TOI 6002 (Palomar). Inset: images of the central portion of the data. |
2.5 Gaia assessment
In addition to high-resolution imaging, we used Gaia to pinpoint any widely separated, bound stellar companions. The Gaia catalog does not identify any nearby sources that have the same distance and proper motion as TOI-5713 or TOI-6002 (see also Mugrauer & Michel 2020, 2021). There is a 4″ neighbor source to TOI-6002, but it is a line-of-sight source at >2000 pc and unrelated to TOI-6002.
We also used the Gaia renormalized unit weight error (RUWE) to assess the possibility of any close-in companions. RUWE values ≳1.4 indicate excess astrometric noise, which can potentially be caused by a bound companion (Ziegler et al. 2020). The Gaia DR3 RUWE values for TOI-5713 and TOI-6002 are 1.3 and 1.1, respectively, indicating astrometric solutions that are consistent with single-star models.
3 Analyses
3.1 Stellar characterization
3.1.1 Spectroscopic analysis
Figure 2 shows the SpeX SXD spectra of TOI-5713 and TOI-6002. To assign spectral types, we compared the spectra to single-star spectral standards in the IRTF Spectral Library (Cushing et al. 2005; Rayner et al. 2009) using the SpeX Prism Library Analysis Toolkit (SPLAT, Burgasser & Splat Development Team 2017). For both stars, we find the single best match to the M3.5 dwarf GJ 273, with M3 and M4 dwarf standards providing the next closest matches. Accordingly, we adopt an infrared spectral type of M3.5 ± 0.5 for both targets. Following Delrez et al. (2022), we used the Mann et al. (2013) relation between the equivalent widths of the K-band Na I and Ca I doublets, the H2O-K2 index (Rojas-Ayala et al. 2012), and stellar metallicity to estimate an iron abundance of [Fe/H] = −0.03 ± 0.13 for TOI-5713 and [Fe/H] = −0.18 ± 0.12 for TOI-6002.
The Shane/Kast optical spectra of TOI-5713 and TOI-6002 are shown in Fig. 3. Comparison to SDSS M dwarf templates from Bochanski et al. (2007) shows a best-match to the M4 template in both cases, with index-based classifications from Reid et al. (1995); Gizis (1997); and Lépine et al. (2003) indicating equivalent classifications of M3.5-M4, also consistent with the near-infrared classifications. We detect Hα emission in TOI-5713 with an equivalent width of 1.94±0.06 Å, corresponding to  based on the χ factor relation of Douglas et al. (2014). For TOI-6002, we see no evidence of H I emission, with an Hα equivalent width limit of 0.6 Å. These emission signatures indicate ages less than and greater than ~4.5 Gyr, respectively (West et al. 2008). We measured metallicity-sensitive ζ indices (Lépine et al. 2007; Mann et al. 2013) of 1.07±0.01 and 1.02±0.01 for TOI-5713 and TOI-6002, respectively, consistent with near-solar metallicities of [Fe/H] = +0.08±0.20 and [Fe/H] = +0.04±0.20 (Mann et al. 2013), again formally consistent with the metallicities inferred from the near-infrared spectra.
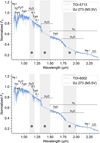 |
Fig. 2 SpeX SXD spectra of TOI-5713 (top) and TOI-6002 (bottom). Spectra of the targets (blue) and the M3.5V spectral standard GJ 273 (grey) are shown. Annotations indicate strong spectral features of M dwarfs, and shaded regions cover wavelengths with strong telluric absorption. |
3.1.2 SED and empirical relations within the global modeling
We performed a Spectral Energy Distribution (SED) fit jointly with transit modeling (see Sect. 3.6) using the latest version of EXOFASTv25 (Eastman et al. 2019) software package. The latest version of EXOFASTv2 comes with the possibility of simultaneously utilizing the empirical relations of Mann et al. (2015) to determine the stellar radius R*, and of Mann et al. (2019) to determine the stellar mass M*. We activated this feature using the two corresponding flags, MANRAD and MANMASS. The R* and M* values obtained by EXOFASTv2 are optimized and self-consistent compromises between the constraints from the SED, empirical relations, and transits (via stellar density). The stellar parameters obtained in this case are more precise than when using the MIST stellar evolution models (Dotter 2016), which was disabled by setting the NOMIST flag as recommended in Eastman et al. (2019). For the SED fit, we used the JHKS magnitudes from 2MASS, the W1–W4 magnitudes from WISE (Cutri et al. 2013), the GBPGRP magnitudes from Gaia DR3 (Gaia Collaboration 2020), and the Pan-STARRS (Chambers et al. 2016) yz magnitudes (see Table 2). We applied a Gaussian prior on the Gaia EDR3 parallax, which we corrected for systematics by subtracting -0.044991895 mas from the nominal value according to Lindegren et al. (2021). We used an upper limit of AV = 8.1537 for TOI-6002 and AV = 0.0477 for TOI-5713 on the extinctions from the dust maps of Schlafly & Finkbeiner (2011) and a Gaussian prior on the stellar metallicity from IRTF/SpeX (see Table 3). Also, a Gaussian prior was applied on the 2MASS mK band to be used by Mann et al. (2015) and Mann et al. (2019) relations. We run the fit with R*, M*, and the effective temperature Teff as free parameters. The SED fit is presented in Fig. 4, and the results are reported in Table 3.
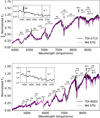 |
Fig. 3 Shane/Kast blue and red optical spectra (black lines) of TOI-5713 (top) and TOI-6002 (bottom) compared to their best-fit M4 SDSS standard templates (magenta line; Bochanski et al. 2007). Data are normalized at 7400 Å, and the gap between 5600 Å and 5900 Å in the spectrum of TOI-6002 corresponds to the dichroic split between the Kast blue and red channels. Key spectral features across the 4200–8900 Å region are labeled. Inset boxes highlight the regions around the 6563 Å Hα and 6708 Å Li I lines. |
3.1.3 Galactic kinematics
We used the Gaia DR3 data for each target, including coordinates, proper motions, parallaxes, and radial velocities (Gaia Collaboration 2020), to infer their UVW galactic velocities in the local standard of rest (LSR) frame. We used astropy.coordinates (Astropy Collaboration 2013, 2018, 2022) to convert the Gaia data to UVW velocities, utilizing the correction of Schönrich et al. (2010) for the barycentric velocity relative to the LSR. The resulting velocities are summarized in Table 2. Following Eqs. (6) and (7) of Li & Zhao (2017), we find these UVW velocities correspond to thin-disk, thick-disk, and halo membership probabilities of {63.9 ± 1.3%, 36.1 ± 1.3%, <0.1%} and {97.2 ± 0.1%, 2.9 ± 0.1%, <0.1%} for TOI-6002 and TOI-5713, respectively. The likely thin-disk membership of both stars implies ages of ≲8.2 Gyr (Kilic et al. 2017).
Stellar astrometric and photometric properties of TOI-6002 and TOI-5713.
3.2 Discarding possible false-positive scenarios
Two primary cases of astrophysical false positives can masquerade as exoplanet transits in TESS data. The first case is background/foreground eclipsing binaries (EBs), especially those in grazing configurations. For both targets, we searched for archival imaging, retrieving images from POSS I/DSS (Minkowski & Abell 1963) and POSS II/DSS Lasker et al. (1996). These images, in addition to those taken from our recent observations from MusCAT3 (for TOI-6002) and MusCAT2 (for TOI-5713) in 2023, span more than 70 years, as shown in Fig. 5. TOI-6002 has a high proper motion of ~344.42 mas/yr and has moved by ~24.4″ from 1955 to 2023. This allowed us to confirm that there was no bright star in the current position of TOI-6002. On the other hand, TOI-5713 has a relatively low proper motion (~ 110.24 mas/yr) and has moved by ~7.7″ from 1953 to 2023, making it challenging to confirm the absence of any unresolved companion in its current position. However, high-resolution adaptive optics imaging from Keck-II (for TOI-5713) and Palomar (for TOI-6002) confirm that no stellar companions were detected close to (≲1″) the targets as discussed in Sect. 2.4. Additionally, the renormalized unit weight error (RUWE) from Gaia DR3 is below 1.4 for both stars, indicating that the stars are singles (see Sect. 2.5).
The second astrophysical false positive case is that of bound eclipsing binaries. Many findings argue against this scenario for both stars: (1) the spectral energy distribution is fit well by single-star models (see Fig. 4); (2) the spectra collected by SpeX SXD and Shane/Kast, for both stars, show no secondary spectrum (see Sect. 2), and Figs. 2 and 3; (3) the achromatic nature of the transits, where their depths in all bands agree within 1σ for each planet (see Table 4); (4) the stellar densities determined from the transits alone are in good agreement with the those determined from the basic parameters of each star (see Table 3). Considering these arguments, we discard these false-positive scenarios.
3.3 Statistical validation
In addition to ruling out false-positives via the arguments in the previous section, we used the Tool for Rating Interesting Candidate Exoplanets and Reliability Analysis of Transits Originating from Proximate Stars (TRICERATOPS: Giacalone et al. 2021) to statistically validate TOI-6002 b and TOI-5713 b. TRICERATOPS simulates potential astrophysical false positives due to bound stellar companions, nearby stars, and line-of-sight stars. To assess the planetary nature of the transit signal, it calculates two quantities: the false positive probability (FPP), which quantifies the probability that the signal originates from other astrophysical sources; and the nearby false positive probability (NFPP), which quantifies the probability that the transit signal originates from a resolved nearby star rather than the target star. The thresholds for statistically validating a planet candidate are FPP < 0.01 and NFPP < 0.001.
We ran TRICERATOPS on TESS data supplied with contrast curves from NIRC2 speckle imaging for TOI-5713 and from Palomar for TOI-6002. As our ground-based photometry confirmed the transit events were on target, removing the possibility of a nearby false positive, we set the NFPP to 0. The inferred FPP is 0.0024±0.001 for TOI-5713 b and 0.00783±0.00016 for TOI-6002 b. Independently, we also ran TRICERATOPS on the data obtained with MuSCAT3 (for TOI-6002 b) and MuSCAT2 (for TOI-5713 b) because they present a higher photometric precision. Also supplied with contrast curves, this led to FPP and NFPP lower than 6 × 10⁻⁴ for both candidates. Given these results using both TESS and ground-based data independently, we consider the two candidates as statistically validated planets.
Stellar parameters. Parameters in bold are the adopted stellar values in the analyses.
 |
Fig. 4 Spectral energy distribution (SED) of TOI-5713 (left) and TOI-6002 (right). Black lines represent the SED best-fit models. Blue circles represent the average broadband flux measurements based on the SED model. Horizontal error bars show the filters bandwidth, and the vertical error bars show the uncertainty on the flux measurements. |
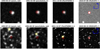 |
Fig. 5 Archival images cropped with a field of view of 1′ ×1′ around TOI-5713 (top row) and TOI-6002 (bottom row). Circles in red show the current position of the stars, and the circles in yellow, in the bottom row, show the positions of TOI-6002 at the dates of exposures. |
3.4 Planet search and detection limits
As mentioned in Sect. 2.1, TOI-5713 and TOI-6002 have both been observed in multiple sectors of TESS – respectively, sectors 16, 22, 23, 46, and sectors 14, 41, 54, 55. Since both planets were detected by the TESS pipelines with a low signal-to-noise ratio, it is possible additional planets remained unnoticed below the threshold set to trigger an alert (Multiple Event Statistic = 7.1σ) (Tenenbaum et al. 2012). In this context, we performed a search for additional planet candidates in the TESS data with the SHERLOCK6 pipeline (Pozuelos et al. 2020; Demory et al. 2020; Dévora-Pajares et al. 2024) and assessed the detection limits with injection and recovery tests with the MATRIX7 ToolKit (Pozuelos et al. 2020; Dévora-Pajares & Pozuelos 2022).
The SHERLOCK pipeline is an open-source package that provides six different modules to find and validate transit signals in photometric time-series observations: (1) acquiring automatically the data from an online database, such as MAST in the case of TESS data; (2) searching for planetary transit signals; (3) performing a vetting of the detected signals; (4) conducting a statistical validation of the vetted signals; (5) modeling them to retrieve their ephemerides; and (6) finding the upcoming transit windows observable from ground-based observatories. See Delrez et al. (2022) and Pozuelos et al. (2023) for recent applications and further details.
SHERLOCK obtains the PDC-SAP fluxes from the MAST archive, and applies a bi-weight filter using the Wōtan package (Hippke et al. 2019) to detrend the light curve with various window sizes. The transit search is then performed over the nominal light curve as well as the detrended ones using the Transit Least Square (TLS) package (Hippke & Heller 2019). This strategy maximizes the signal-to-noise ratio (S/N) and the signal detection efficiency (SDE) of the transit signals found. In the case of TOI-6002 and TOI-5713, we downloaded the short-cadence data from TESS and applied seven different window sizes between 0.2 and 1.0 days to detrend the data. As the transit search is performed in an iterative way, if a signal is detected with a S/N⩾5, it is masked, and a new search is implemented.
The operation is repeated until the algorithm no longer finds signals above the threshold or reaches the number of loops (so-called “runs”) set by the user. For all our analyses, we kept the number of detrends to 7, set the maximum number of runs to 5, and also kept the S/N threshold to 5.
We performed a first test to see if the first planet is recovered well by SHERLOCK for both systems with a period grid between 1 and 15 days. For TOI-6002, the signal was not recovered in the first instance. We then applied a Savitzky-Golay digital filter (Savitzky & Golay 1964) and repeated the test, where we indeed recovered the planet. TOI-6002 b was recovered in the second run and in seven of the detrended light curves with a maximum S/N of 12.8 and an SDE of 13.0. Similarly, TOI-5713 b was recovered in the first run and in six of the detrended light curves and, at best, with an S/N of 11.8 and an SDE of 23.1. In order to assess the presence of additional candidates, we performed a search for the period grid between 0.5 and 25 days on 7 light curves detrended by a bi-weight filter with window sizes from 0.2 and 1.2 days, allowing a maximum of 5 runs. Neither of these analyses yielded positive planetary-like signals; all signals could be attributed to noise, variability, or systematics.
The lack of additional transiting planet candidates in the TESS data for both systems does not necessarily exclude the existence of extra planets. Several scenarios could explain the lack of interesting signals in our transit search with SHERLOCK: (1) the systems only host one planet; (2) if other planets exist, they are not transiting; (3) the data we examined do not have the photometric precision required to detect the additional transiting planets, or they have a longer period than the period grid searched in our analyses (Wells et al. 2021). In the case of scenario (2), radial velocity measurements may be able to detect them, as discussed in Sect. 4.2. In the case of scenario (3), a ground-based high-precision photometric follow-up could possibly detect more planets, such as was the case for LP 890-9 c (Delrez et al. 2022). However, to test scenario (3) against the TESS data, we performed injection and recovery tests over the available short-cadence data for both systems.
MATRIX is an injection and recovery software specifically built to establish the retrieval thresholds of hypothetical transiting exoplanet signals in space-based data for a given star. It is built on top of the same core features as SHERLOCK so that it can reproduce the same algorithms and techniques implemented in the pipeline, and their results can be compared. That is, MATRIX sets detection limits to SHERLOCK, and by extension, to any similar pipeline using preliminary detrending and phase-folded least squares search techniques. To do so, three-dimensional grids (orbital period, planet size, orbital phase) are built to create synthetic scenarios. For each of these scenarios, MATRIX runs the pre-processing of the curve (smooth, noise-masks, detrending) and searches for the injected planet either using TLS or Box Least Squares (BLS; Kovács et al. 2002).
As both systems’ planets are very similar in orbital periods and sizes, we planned the same scenarios for both of them. We wanted to explore the recoverability of planets with sizes between 0.5 and 3 R⊕ and orbital periods from 1 up to 25 days. Therefore, the final injection and recovery test cases included a grid of 25 periods (from 1 to 25 days), 15 planet radii (from 0.5 to 3 R⊕), and 3 orbital phases, summing a total of 1125 independent injected synthetic transiting planets for each target.
Our tests show that TOI-5713 b and TOI-6002 b lie at the detectability limits found for each of their systems (see Fig. 6). This is consistent with the low S/N obtained for both planets, either in SHERLOCK (S/NTOl–5713b = 11.8, S/NTOl–6002b = 12.8) or SPOC (S/NTOI–5713b = 7.7, S/NTOI–6002b = 8.1), and the low number of SHERLOCK detrends where they were found. It is essential to recognize that the S/N reported by the SHERLOCK algorithm is derived from the TLS package, which employs a straightforward estimation approach that is not directly comparable to the metrics produced by alternative pipelines, such as SPOC. Instead, SHERLOCK utilizes these values internally to evaluate the detected signals and identify the most significant ones among them.
From these results, we rule out the existence of transiting planets larger than 2.3 R⊕ with orbital periods up to 25 days around TOI-6002, whilst the same statement applies for planets larger than 3 R⊕ in TOI-5713. If additional transiting exoplanets were present in the analyzed period range, they would probably be within the limits or below the super-Earth radius regime in TOI-6002. On the other side, there could also be undetected sub-Neptune transiting exoplanets in TOI-5713, especially for outermost orbits above 14 days, where planets with a radius between 2 R⊕ to 2.75 R⊕ could remain undetected with detection rates between 33–66%.
Median values and 68% confidence intervals for the parameters of TOI-6002 b and TOI-5713 b obtained using EXOFASTv2 for circular and eccentric orbits.
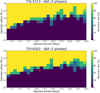 |
Fig. 6 Top panel: TOI-5713 injection and recovery test, where TOI-5713 b is rendered with a red marker. Bottom panel: TOI-6002 injection and recovery test, where TOI-6002 b is rendered with a red marker. |
3.5 Stellar activity and rotation period
If the host star is magnetically active and has an inhomogeneous photosphere, its rotation can pose a challenge for accurately measuring an exoplanet’s mass via radial velocity (RV) observations, especially if the rotation time scale is similar to the orbital period of the planet. Therefore, we examined the effect of stellar activity on RV observations.
We first visually inspected the PDC-SAP data light curves of the two targets. We observed no rotational modulations nor flares for TOI-6002, while we found clear flares in the four observed sectors of TOI-5713 in addition to hints of rotational modulation.
We then used the Systematics-Insensitive Periodogram (TESS-SIP8) (Hedges et al. 2020) to build a periodogram using the whole TESS photometry (4 sectors) for each of the two targets. This tool simultaneously creates a Lomb-Scargle periodogram and detrends TESS systematics as described in Angus et al. (2016). The SPOC pipeline is known to attenuate rotational periods, thus TESS-SIP reproduces simple aperture photometry (SAP) light curves from the TPFs and the SPOC apertures. We applied this procedure on all four sectors observed by TESS. Searching for periods between 2 and 15 days, we applied TESS-SIP on the target and on all the background pixels around the SPOC apertures. We found no significant rotational signal for TOI-6002; however, we found a significant rotational period at 9.32±0.20 days for TOI-5713. Thus, we report the SIP power spectrum for only TOI-5713 in Fig. 7. We also found that this signal remains on the PDC-SAP light curves of each individual sector, which underscores the robustness of the signal. Beyond 15 days, we did not find any rotational signal.
Given these rotation-period constraints, we can estimate the ages of the stars using the mass-dependent spindown relation from Pass et al. (2024). The “jump” times at which fully convective M dwarfs transition from rapidly to slowly rotating are 2.19 ± 0.10 Gyr and 1.81 ± 0.10 Gyr for stars with the masses of TOI-6002 and TOI-5713, respectively (see Pass et al. 2024, Equation 2). Assuming that our non-detection of rotational modulations for TOI-6002 owes to a long rotational period (> 10 d), we can constrain its age to >2.19 ± 10 Gyr. By contrast, the relatively rapid rotation of TOI-5713 implies an age of < 1.813 ± 0.10 Gyr. These estimates are consistent with the age estimates we derive from their Hα emission (for TOI-5713) or lack of it (for TOI-6002) as well as the likely thin-disk membership of both stars.
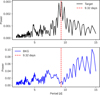 |
Fig. 7 TESS-SIP power spectrum of TOI-5713 based on the four TESS sectors. We calculate the periodogram for both the corrected light curve (top panel) and the background (BKG) pixels (bottom panel). The star’s periodogram shows some power excess compared to the BKG. |
3.6 Global modeling
For each planet, we used the latest version of EXOFASTv2 (Eastman et al. 2019) software package to globally analyze the TESS and ground-based data described in Sect. 2, jointly with the star’s SED fit and the empirical relations Mann et al. (2015, 2019) to characterize the host stars (see description in Sect. 3.1.2).
In the priors file, we set starting values of M*, R* and Teff. We set lower and upper limits priors on the orbital period (P ± 0.1 P d) and the transit epoch (Tc ± 0.33P) from the values determined by SPOC and reported in ExoFOP. For the LD parameters, we disabled the priors based on the Claret tables (Claret 2017; Claret & Bloemen 2011) by setting the NOCLARET flag given the low mass of our stars where these tables are not reliable (see Eastman et al. 2019, and references therin). Instead, we fitted for quadratic LD parameters assuming Gaussian priors of variance 0.1, computed with the PyLDTk code (Parviainen 2015) for each passband (see Table 5). Regarding the TESS data, we used the detrended PDC-SAP light curves (see Sect. 2.1) which are corrected for the contribution of neighboring stars and subsequently corrected for sky background bias for TOI-6002 in sector 14 (see Sect. 2.1), but we still fit for a possible dilution by applying a Gaussian prior of 0± 10% of the contamination ratio reported in ExoFOP. This is to propagate any uncertainty in the correction. Also, Gaussian priors were applied on the metallicities from IRTF/SpeX (see Table 3). For each planet, we fitted for circular and eccentric orbits to check for orbital eccentricity evidences using only photometric data. The two fits were run until convergence. We found the difference in the loglikelihood is ∆ ln Z = ln Zeccentric – ln Zcircular ⩾ 2 for both TOI-6002 b and TOI-5713 b, which suggests that eccentric orbits are marginally favored for both planets. Table 4 presents the fits’ results for both the circular and eccentric cases. Fig. 8 shows the detrended and modeled gound-based light curves for both TOI-6002 b and TOI-5713 b, and Fig. 9 shows the TESS phase-folded light curves.
We also re-fitted the data for a circular orbit and with the same priors as explained above but without any Gaussian prior on the stellar mass. This is to check for consistency between the stellar densities determined from R* and M* (from SED + empirical relations) and those determined from the transits via the a/R* (the semi-major axis over the stellar radius) ratio. We found  g cm−3 for TOI-6002 b and
  g cm−3 for TOI-5713 b, which are consistent with the previously determined stellar densities (see Table 3). This provides additional assurance that the transit signals for both candidates originate from transiting planets and not astrophysical false positives.
Priors assumed for the quadratic limb-darkening coefficients for each passband for both stars TOI-6002 and TOI-5713.
4 Results and discussion
4.1 Radius valley
The radius valley, discovered by Fulton et al. (2017) from 1.5 to 2 R⊕ for solar-type stars and by Cloutier & Menou (2020) from 1.4 to 1.7 R⊕ for low-mass stars (i.e., M ≲ 0.65 M⊙), has attracted attention because it is important to understand planet formation and evolution. There are several theories to explain the origin of the radius valley: (1) thermally-driven mass loss, where planets lose their atmospheric envelopes because of stellar high energetic X-ray and ultra-violet (UV) radiation (Lopez & Fortney 2013; Owen & Wu 2013; Jin et al. 2014; Chen & Rogers 2016) and of the energy emerging from the cooling planetary cores (core-powered mass loss, Owen & Wu 2013; Ginzburg et al. 2016, 2018); (2) gas-poor formation, where some low-mass planetary cores accrete a thin gaseous envelope (see e.g. Lee & Connors 2021; Cherubim et al. 2023). These planets can still experience thermally-driven mass loss; and (3) gas-depleted formation, where the population of super-Earths is formed late in a gas-depleted environment (see e.g. Lopez & Rice 2018; Cloutier & Menou 2020; Cherubim et al. 2023); (4) Other studies based on coupled formation and evolution models predict that the sub-Neptunes are rich in water formed outside the ice-line and migrate toward the host stars (Venturini et al. 2020, 2024; Burn et al. 2024).
Observational and theoretical studies showed that the position of the radius valley is period-dependent (see Fig. 10). Its location has been found trending to smaller planet radii for long periods in both thermally-driven mass loss and gas-poor formation models for solar FGK stars (see e.g. Fulton et al. 2017; Van Eylen et al. 2018; Lopez & Rice 2018; Lee & Connors 2021). For M dwarfs, its location has been found trending to larger radii for long periods in the gas-depleted theory (see e.g Lopez & Rice 2018; Cloutier & Menou 2020). Conversely, other studies on small planets around M dwarfs found a negative slope (see e.g. Van Eylen et al. 2021; Bonfanti et al. 2024), something similar to that of FGK stars.
As shown in Fig. 10, a wedge of opposing predictions emerged because of the difference in the slopes of the radius valley. Planets in this region are known as “keystone planets”. They are predicted to be purely rocky by thermally-driven mass loss and gas-poor formation, and potentially rocky with small gaseous envelopes by the gas-depleted formation model (see e.g. Cherubim et al. 2023). Only a few planets with measured densities are in this wedge. Having a large sample of keystone planets is important to understand the models dominating the formation and evolution of small planets. TOI-5713 b ( and
and  d) is located within the wedge of keystone planets with the possibility of being at its upper edge, given the uncertainty on the planetary radius. TOI-6002 b (
 and
and  ) is located at the lower edge of this wedge with the possibility of being inside it, given the uncertainty on the planetary radius. When their masses are determined with RV observations (see Sect. 4.2), these planets will join the small sample of keystone planets with density measurements. This sample will, in the future, help disentangle which model is dominating the formation of small (i.e., Rp ≲ 4 R⊕) planets.
In addition, for M dwarfs, a later study of Luque & Pallé (2022) on small planets (with mass and radius precision better than 25 and 8%, respectively) identified instead a density valley separating rocky planets, with density peaked at ρ = 0.94 ± 0.13 ρ⊕, and water-rich worlds, with density peaked at ρ = 0.47 ± 0.05 ρ⊕. A third peak was identified at ρ = 0.24 ± 0.04 ρ⊕, attributed to gas-rich planets. This study favored the pebble accretion model as the main mechanism that forms these populations of planets. In this model, water-rich planets are formed outside the ice-line and migrate toward the host stars. This finding was theoretically predicted by Venturini et al. (2020), and newly supported by Burn et al. (2024) and Venturini et al. (2024) using coupled formation and evolution models. Conversely, Parviainen et al. (2024) stand against the existence of distinct population of water-rich planets around M dwarf stars. However, in all previous studies on radius and density valleys, strong conclusions require larger sample of precisely characterized exoplanets.
Given their predicted masses estimated from their radii using the relations of Chen & Kipping (2017), these planets are predicted to have densities of  for TOI-6002 b, and
  for TOI-5713 b. We also used the recent SPRIGHT9 python package of Parviainen et al. (2024), where we found median values of the masses (and then densities) consistent with those obtained using Chen & Kipping (2017) relations. To further guess their compositions, we referred to the radius space of the study of Luque & Pallé (2022) and the corresponding density regimes in the density space. Given their radii, TOI-5713 b falls slightly towards the range of water-rich planets, and TOI-6002 b falls in the region where we find both rocky and water-rich planets. Therefore, it is uncertain whether the two planets could be rocky or water-rich worlds. However, even if they are not of intermediate composition, they might then be either some of the largest rocky planets or some of the smallest water-rich worlds known today. As for the radius valley, both planets straddle near the opposing side of the region of “keystone planets”, where it is difficult to guess whether they lost their gaseous envelopes or not. When their masses are determined, these two planets can be added to the sample of “keystone planets”, which will be used to conduct in-depth statistical inferences on the radius and density valleys. Such studies will help to refine the relative dominance of the various mechanisms proposed to be responsible for the formation and evolution of super-Earths and sub-Neptunes around M-dwarf stars.
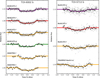 |
Fig. 8 Phase-folded detrended ground-based transit light curves with time in hours from mid-transit of TOI-6002 b (left) and TOI-5713 b (right). The unbinned light curves are shown with gray points. The binned points (bin size=6 min) are shown in black with the corresponding error bars. The solid-colored lines corresponds to the best-fit transit model from the final joint fit. |
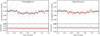 |
Fig. 9 TESS phase-folded detrended light curve with the time in hours from mid-transit of TOI-6002 b (left) and TOI-5713 b (right). The red solid lines represent the best-fit transit model from the global fit. The gray dots are the 2-min TESS data and the black dots with error bars show the data binned every 5 minutes. The residuals are plotted in the bottom panel. |
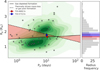 |
Fig. 10 Distribution of planet radii and orbital periods for all confirmed small planets hosted by low-mass stars (M* ≲ 0.65 M⊙). The solid line represents the predicted location of the radius valley based on the gas-depleted formation model (Cloutier & Menou 2020). The dashed line shows the predicted location of the valley for the thermally-driven photoevaporation and gas-poor formation models (Van Eylen et al. 2018). The red and blue dots represents the planets TOI-6002b and TOI-5713b, respectively. The 1D radius distribution, with the location of the two planets, is shown on the right panel. |
4.2 Prospects for a radial velocity follow-up
In Table 4, we show the predicted semi-amplitudes for TOI-6002b and TOI-5713 b for both circular and eccentric orbits. With both planets inducing reflex motions to their host-stars with semi-amplitudes on the order of 3 ms−1, high-resolution, well-stabilized spectrographs are needed for their measurement. Due to the relatively faint apparent magnitudes of both stars, reaching such precision will be challenging for instruments on 4-m class telescopes, such as HARPS-N (Cosentino et al. 2012) in the optical. This is also true for NIR instruments such as CARMENES (Quirrenbach et al. 2020) or SPIRou (Donati et al. 2018) which would allow to reach a RV precision in the order of 10 ms−1 or less. The MAROON-X instrument (Seifahrt et al. 2020) at the 8.1-m Gemini North telescope offers the necessary stability and throughput to successfully measure the reflex motions of both stars. Assuming exposure times of 900 s, the instrument’s red arm will achieve a maximum signal-to-noise-ratio larger than 95 and 65 for TOI-6002 and TOI-5713, respectively.
Following Engle & Guinan (2023), we can expect negligible line broadening and a low activity level for TOI-6002 due to the age of this star. Assuming an additional noise term of 1 ms−1 accounting for stellar activity, we expect that the reflex motion can be detected at a 5σ level with less than 11h telescope time using MAROON-X. This would not only allow us to measure the mass of TOI-6002 b, but also to derive the eccentricity of the planet’s orbit.
In Sect. 3.5, we determine the stellar rotation period of TOI-5713 from photometry. This translates to a maximum rotational line broadening (υ sin i*) on the order of 1.6 km s−1, which is below the resolution limit for most high-resolution spectro-graphs, and thus does not affect the radial-velocity precision. Nevertheless, we observe moderate activity and a photometric rotational variability close to the orbital period of TOI-5713 b, making activity mitigation challenging. Assuming an optimistic noise term of 3 ms−1 accounting for this stellar activity after successful mitigation, a 5σ detection of the radial velocity signal due to TOI-5713 b would need at least 16 hr telescope time with MAROON-X.
4.3 Potential for atmospheric characterization
TOI-6002b and TOI-5713b, with radii of 1.63 R⊕ and 1.75 R⊕ and incident stellar fluxes of 1.77 and 2.42 times that of Earth respectively, could be classified as ‘super-Venus’ planets if they have rocky compositions. Venus, in comparison, receives about 1.9 times the flux of Earth and is 95% the size of Earth. According to Kane et al. (2014), Venus analogs are defined as predominantly rocky planets within the “Venus-Zone (VZ)”, receiving insolation fluxes between approximately 0.95 and 25 times that of Earth. This classification suggests that both TOI-6002b and TOI-5713b fall within this category. With incident flux slightly lower (TOI-6002b) and slightly higher (TOI-5713b) than modern Venus, these two exoplanets are intriguing candidates to expand our understanding of the evolution of rocky planets in the state from a temperate Earth-like to a hot Venus-like planet. The incident flux levels indicate that both planets might experience or might have experienced strong runaway greenhouse effects, depending on factors like the initial water inventory, planetary evolution and atmospheric escape rates (Kaltenegger et al. 2023). Combined with the estimated ages of the stars, this could indicate atmospheric conditions similar to modern Venus. However, studying planets with incident irradiation higher than modern Earth to modern Venus levels and beyond, that may be experiencing strong greenhouse effects or may have evolved into a post-runaway greenhouse state is crucial, as it can provide insights into the factors that cause some rocky planets to resemble Venus-analogs while others may maintain Earth-analog characteristics (Ehrenreich et al. 2012; Chouqar et al. 2023; Jordan et al. 2021; Kaltenegger et al. 2023).
To investigate two cases of potential atmospheric characteristics of these planets, we constructed models simulating a) cloudless and 10 mbar cloudy, 92-bar Venus-like, and b) 1-bar Earth-like atmospheres. We link the one-dimensional VULCAN chemical kinetic code (Tsai et al. 2017) to the one-dimensional radiative transfer model PETITRADTRANS to predict the transmission spectra for these clear atmospheres (Mollière et al. 2019). The radiative–convective temperature-pressure profiles were computed with the HELIOS code (Malik et al. 2018). The species considered for our atmospheric models include N2, O2, O3 H2O, CO2, CO, HCN, CH4, NO, NH3, and C2H2 for the Earth-like atmosphere (rich in N2). Additionally, Rayleigh scattering for N2 and O2, as well as collision-induced absorption for the N2–N2 and O2–O2 pairs, are considered. For the Venus-like atmosphere (rich in CO2), we include H2S, SO2, OCS, H2O, CO2, CO, CH4, HCN, and C2H2 as well as CO2– CO2 collision-induced absorption, as opacity sources in the atmosphere. Rayleigh scattering is included for CO2.
Ehrenreich et al. (2012) showed that during Venus’s 2012 transit, its transmission spectra indicated that the cloud and haze layers obstruct probing below an altitude of 80 km. Pidhorodetska et al. (2021) modeled the transmission spectra of the L 98-59 planets, a benchmark system for studying the VZ planets (Ostberg et al. 2023). They showed that if the L 98-59 planets possess a clear Venus-like atmosphere, NIRSpec could detect CO2 within 26 transits for each planet. However, the presence of H2SO4 clouds would significantly suppress CO2 absorption. A new study by Kaltenegger et al. (2023) shows that there is a wide range of possible atmospheres for a rocky planet experiencing a runaway greenhouse effect, which changes the atmosphere and observable features significantly. Model transmission spectra of the planet LP 890-9c (Delrez et al. 2022), another benchmark system for studying the VZ planets (Kaltenegger et al. 2023) show that depending on the state of the planet, James Webb Space Telescope (JWST) observations could infer evidence of H2O with 3 transit (at 3σ confidence) for a full runaway greenhouse scenario for LP 890-9c, and CO2-dominated atmospheres resembling Venus without high-altitude terminator clouds with 8 transits (Gomez Barrientos et al. 2023). A 3D Venus model for the same planet with higher, thick cloud coverage increases the amount of transits needed to be able to explore the atmospheric composition. Note that all predictions could be complicated by the impact of clouds and (or) unocculted starspots, especially for cool host stars.
These results show that observing these exoplanets is of critical importance to understanding their evolutionary stage and the effect of increasing solar irradiation on rocky worlds. Additionally, planetary systems like the TRAPPIST-1 system could also allow insight into the effect of the increase of irradiation on the environment on a planet (e.g. Payne & Kaltenegger 2024). However, even for a specific orbital distance and stellar irradiation, the observable spectral features in transit for an exoplanet depend on their specific atmospheric evolution and cloud coverage (e.g., Kaltenegger 2017; Kaltenegger et al. 2020), requiring a wider range of observations to explore the characteristic changes of rocky worlds with stellar irradiation. TOI-6002b and TOI-5713b provide two important datapoints in that exploration.
For TOI-6002b and TOI-5713b, the synthetic transmission spectra generated from our models (Earth-like surface temperatures are 524 and 580 K, respectively; Venus-like surface temperatures are 1053 and 1110 K, respectively) show key differences between Earth-like and Venus-like atmospheres (see Fig. 11).
Models of TOI-6002b and TOI-5713b for clear hot Earthlike atmospheric compositions are dominated by water vapor. Water vapor is a strong absorber across the infrared for Earth-like atmospheric compositions, with amplitudes of about 300 ppm in the mid-infrared (see Fig. 11, top panel). Note that Fig. 11 (top panel) also shows a notable CO2 feature at 4–5 µ with a depth of 400 ppm. However, we would assume the atmospheric CO2 concentration to decrease during a runaway greenhouse stage, reducing that feature strength. Because we are not modeling the possible evolution of the planet’s atmosphere, we have not changed the CO2 concentration here, but note that the features could be much smaller than shown.
Models of TOI-6002b and TOI-5713b using clear Venus-like atmospheric composition are primarily characterized by CO2 opacity, with a depth of about 250 ppm in the mid-infrared, and a prominent SO2 feature at 4 µ and between 7 and 10 µ, with depths above ≈ 100 ppm. With a cloud deck at 10 mbar, the CO2 feature at approximately 4.2 µm remains discernible, exhibiting a depth greater than 200 ppm.
These models show that TOI-6002b and TOI-5713b represent promising targets for atmospheric characterization with JWST, as they may provide valuable insights into the diverse evolutionary pathways and climate states of hot rocky or water-rich exoplanets. Mass measurements could help provide better constraints on the viability of atmospheric studies and would be possible with the MAROON-X instrument at the 8.1-m Gemini North telescope.
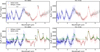 |
Fig. 11 Simulated JWST transmission spectra for TOI-6002b and TOI-5713b. The top panel shows spectra for a cloudless, 1-bar Earth-like atmosphere. The bottom panel displays spectra for a 92-bar Venus-like atmosphere, both cloudless (black) and with a cloud deck at 10 mbar (green). Error bars are shown for a transit observation simulated at R = 30. |
5 Conclusion
In this paper, we reported the TESS discovery and initial characterization of TOI-6002 b and TOI-5713 b, two super-Earth planets orbiting the mid-M-dwarf stars TOI-6002 (V = 14.6) and TOI-5713 (V = 15.355). We used the 2-min-cadence TESS observations from four sectors for each target, ground-based photometry, high-angular resolution imaging, and spectroscopic observations to validate the planetary nature of the detected transit events. We jointly analyzed the transit light curves observed by TESS and ground-based facilities to characterize the planets.
TOI-6002 b has a radius of  R⊕, an orbital period of
  days, and receives
  . TOI-5713 b has a radius of
  , an orbital period of
  days, and receives 2.42 ± 0.11 S⊕. Both planets are located just outside but near the inner edge of the habitable zone around their host stars, making them interesting targets for future studies to explore the evolution of exoplanets from hot, potentially habitable to Venus-like worlds. These two planets provide compelling additions to the sample of planets critical for understanding the formation and evolution of small worlds on the basis of the radius and density valleys.
Data availability
Data are available at TOI-6002b: https://exofop.ipac.caltech.edu/tess/target.php?id=102734241 and TOI-5713b: https://exofop.ipac.caltech.edu/tess/target.php?id=219041246
Acknowledgements
This research was carried out in part at the Jet Propulsion Laboratory, California Institute of Technology, under a contract with the National Aeronautics and Space Administration (80NM0018D0004). This article is based on observations made with the MuSCAT2 instrument, developed by ABC, at Telescopio Carlos Sánchez operated on the island of Tenerife by the IAC in the Spanish Observatorio del Teide. TRAPPIST-North is a project funded by the University of Liege (Belgium), in collaboration with Cadi Ayyad University of Marrakesh (Morocco). We acknowledge the use of public TESS data from pipelines at the TESS Science Office and at the TESS Science Processing Operations Center. This work makes use of observations from the LCOGT network. Part of the LCOGT telescope time was granted by NOIRLab through the Mid-Scale Innovations Program (MSIP). MSIP is funded by NSF. This research has made use of the Exoplanet Follow-up Observation Program (ExoFOP; DOI: 10.26134/ExoFOP5) website, which is operated by the California Institute of Technology, under contract with the National Aeronautics and Space Administration under the Exoplanet Exploration Program. We acknowledge the use of public TESS data from pipelines at the TESS Science Office and at the TESS Science Processing Operations Center. This paper includes data collected by the TESS mission that are publicly available from the Mikul-ski Archive for Space Telescopes (MAST). Funding for the TESS mission is provided by NASA’s Science Mission Directorate. KAC acknowledges support from the TESS mission via subaward s3449 from MIT. Resources supporting this work were provided by the NASA High-End Computing (HEC) Program through the NASA Advanced Supercomputing (NAS) Division at Ames Research Center for the production of the SPOC data products. This paper is based on observations made with the MuSCAT3 instrument, developed by the Astrobiology Center and under financial supports by JSPS KAKENHI (JP18H05439) and JST PRESTO (JPMJPR1775), at Faulkes Telescope North on Maui, HI, operated by the Las Cumbres Observatory. This work was partially supported by a grant from the Erasmus+ International Credit Mobility program (M. Gha-choui). This publication benefits from the support of the French Community of Belgium in the context of the FRIA Doctoral Grant awarded to MT. MG is F.R.S-FNRS Research Director. The postdoctoral fellowship of KB is funded by F.R.S.-FNRS grant T.0109.20 and by the Francqui Foundation. Author F.J.P acknowledges financial support from the Severo Ochoa grant CEX2021-001131-S funded by MCIN/AEI/10.13039/501100011033 and Ministerio de Ciencia e Innovación through the project PID2022-137241NB-C43. H.P. acknowledges support by the Spanish Ministry of Science and Innovation with the Ramon y Cajal fellowship number RYC2021-031798-I. This work is partly supported by JSPS KAKENHI Grant Number JP18H05439 and JST CREST Grant Number JPMJCR1761. E.E-B. acknowledges financial support from the European Union and the State Agency of Investigation of the Spanish Ministry of Science and Innovation (MICINN) under the grant PRE2020-093107 of the Pre-Doc Program for the Training of Doctors (FPI-SO) through FSE funds We acknowledge financial support from the Agencia Estatal de Investigación of the Ministerio de Ciencia e Innovación MCIN/AEI/10.13039/501100011033 and the ERDF “A way of making Europe” through project PID2021-125627OB-C32, and from the Centre of Excellence “Severo Ochoa” award to the Instituto de Astrofisica de Canarias. This material is based upon work supported by the National Aeronautics and Space Administration under Agreement No. 80NSSC21K0593 for the program “Alien Earths”. The results reported herein benefited from collaborations and (or) information exchange within NASA’s Nexus for Exoplanet System Science (NExSS) research coordination network sponsored by NASA’s Science Mission Directorate. This research was supported by Wallonia-Brussels International.
Appendix A Additional figures
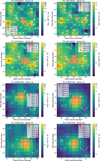 |
Fig. A.1 Target pixel files (TPFs) of TOI-6002 (TIC 102734241) in TESS sectors 14, 41, 54, 55, and TOI-5713 (TIC 219041246) in sectors 16, 22, 23, and 49 created with tpfplotter (Aller et al. 2020). Regions in orange highlight the aperture used to extract the SPOC photometry. Red circles represent the Gaia DR2 sources, with sizes representing the magnitude contrasts with respect to the targets. |
 |
Fig. A.2 Detrended TESS photometry of TOI-6002 b and TOI-5713 b. The flares in the TOI-573 light curves were removed using an upper 3σ clipping. Gray points show the detrended PDC-SAP fluxes from the SPOC pipeline. Orange and red points highlight the transits of TOI-6002 b and TOI-5713 b, respectively |
References
- Aller, A., Lillo-Box, J., Jones, D., Miranda, L. F., & Barceló Forteza, S. 2020, A&A, 635, A128 [NASA ADS] [CrossRef] [EDP Sciences] [Google Scholar]
- Angus, R., Foreman-Mackey, D., & Johnson, J. A. 2016, ApJ, 818, 109 [NASA ADS] [CrossRef] [Google Scholar]
- Astropy Collaboration (Robitaille, T. P., et al.) 2013, A&A, 558, A33 [NASA ADS] [CrossRef] [EDP Sciences] [Google Scholar]
- Astropy Collaboration (Price-Whelan, A. M., et al.) 2018, AJ, 156, 123 [Google Scholar]
- Astropy Collaboration (Price-Whelan, A. M., et al.) 2022, ApJ, 935, 167 [NASA ADS] [CrossRef] [Google Scholar]
- Barkaoui, K., Burdanov, A., Hellier, C., et al. 2019, AJ, 157, 43 [NASA ADS] [CrossRef] [Google Scholar]
- Bochanski, J. J., West, A. A., Hawley, S. L., & Covey, K. R. 2007, AJ, 133, 531 [NASA ADS] [CrossRef] [Google Scholar]
- Bonfanti, A., Brady, M., Wilson, T. G., et al. 2024, A&A, 682, A66 [NASA ADS] [CrossRef] [EDP Sciences] [Google Scholar]
- Brown, T. M., Baliber, N., Bianco, F. B., et al. 2013, PASP, 125, 1031 [Google Scholar]
- Burgasser, A. J. & Splat Development Team. 2017, ASI Conf. Ser., 14, 7 [NASA ADS] [Google Scholar]
- Burn, R., Mordasini, C., Mishra, L., et al. 2024, Nat. Astron., 8, 463 [Google Scholar]
- Chambers, K. C., Magnier, E. A., Metcalfe, N., et al. 2016, arXiv e-prints [arXiv:1612.05560] [Google Scholar]
- Chen, J., & Kipping, D. 2017, ApJ, 834, 174 [NASA ADS] [CrossRef] [Google Scholar]
- Chen, H., & Rogers, L. A. 2016, ApJ, 831, 180 [Google Scholar]
- Cherubim, C., Cloutier, R., Charbonneau, D., et al. 2023, AJ, 165, 167 [NASA ADS] [CrossRef] [Google Scholar]
- Chouqar, J., Lustig-Yaeger, J., Benkhaldoun, Z., et al. 2023, MNRAS, 522, 648 [CrossRef] [Google Scholar]
- Ciardi, D. R., Beichman, C. A., Horch, E. P., & Howell, S. B. 2015, ApJ, 805, 16 [NASA ADS] [CrossRef] [Google Scholar]
- Claret, A. 2017, A&A, 600, A30 [NASA ADS] [CrossRef] [EDP Sciences] [Google Scholar]
- Claret, A., & Bloemen, S. 2011, A&A, 529, A75 [NASA ADS] [CrossRef] [EDP Sciences] [Google Scholar]
- Cloutier, R., & Menou, K. 2020, AJ, 159, 211 [NASA ADS] [CrossRef] [Google Scholar]
- Collins, K. A., Kielkopf, J. F., Stassun, K. G., & Hessman, F. V. 2017, AJ, 153, 77 [Google Scholar]
- Cosentino, R., Lovis, C., Pepe, F., et al. 2012, SPIE Conf. Ser., 8446, 84461V [Google Scholar]
- Cushing, M. C., Vacca, W. D., & Rayner, J. T. 2004, PASP, 116, 362 [NASA ADS] [CrossRef] [Google Scholar]
- Cushing, M. C., Rayner, J. T., & Vacca, W. D. 2005, ApJ, 623, 1115 [Google Scholar]
- Cutri, R. M., Skrutskie, M. F., van Dyk, S., et al. 2003, VizieR Online Data Catalog: II/246 [Google Scholar]
- Cutri, R. M., Wright, E. L., Conrow, T., et al. 2013, Explanatory Supplement to the AllWISE Data Release Products, Explanatory Supplement to the AllWISE Data Release Products [Google Scholar]
- Dekany, R., Roberts, J., Burruss, R., et al. 2013, ApJ, 776, 130 [CrossRef] [Google Scholar]
- Delrez, L., Murray, C. A., Pozuelos, F. J., et al. 2022, A&A, 667, A59 [NASA ADS] [CrossRef] [EDP Sciences] [Google Scholar]
- Demory, B. O., Pozuelos, F. J., Gómez Maqueo Chew, Y., et al. 2020, A&A, 642, A49 [NASA ADS] [CrossRef] [EDP Sciences] [Google Scholar]
- Dévora-Pajares, M., & Pozuelos, F. J. 2022, https://doi.org/10.5281/zenodo.6570831 [Google Scholar]
- Dévora-Pajares, M., Pozuelos, F. J., Thuillier, A., et al. 2024, MNRAS, 532, 4752 [CrossRef] [Google Scholar]
- Donati, J.-F., Kouach, D., Lacombe, M., et al. 2018, in Handbook of Exoplanets, eds. H. J. Deeg, & J. A. Belmonte (Berlin: Springer), 107 [Google Scholar]
- Dotter, A. 2016, ApJS, 222, 8 [Google Scholar]
- Douglas, S. T., Agüeros, M. A., Covey, K. R., et al. 2014, ApJ, 795, 161 [NASA ADS] [CrossRef] [Google Scholar]
- Eastman, J. D., Rodriguez, J. E., Agol, E., et al. 2019, arXiv e-prints [arXiv:1907.09480] [Google Scholar]
- Ehrenreich, D., Vidal-Madjar, A., Widemann, T., et al. 2012, A&A, 537, L2 [NASA ADS] [CrossRef] [EDP Sciences] [Google Scholar]
- Engle, S. G., & Guinan, E. F. 2023, ApJ, 954, L50 [NASA ADS] [CrossRef] [Google Scholar]
- Fulton, B. J., Petigura, E. A., Howard, A. W., et al. 2017, AJ, 154, 109 [Google Scholar]
- Furlan, E., Ciardi, D. R., Everett, M. E., et al. 2017, AJ, 153, 71 [NASA ADS] [CrossRef] [Google Scholar]
- Gaia Collaboration 2020, VizieR Online Data Catalog: I/350 [Google Scholar]
- Gaia Collaboration (Brown, A. G. A., et al.) 2018, A&A, 616, A1 [NASA ADS] [CrossRef] [EDP Sciences] [Google Scholar]
- Ghachoui, M., Soubkiou, A., Wells, R. D., et al. 2023, A&A, 677, A31 [NASA ADS] [CrossRef] [EDP Sciences] [Google Scholar]
- Giacalone, S., Dressing, C. D., Jensen, E. L. N., et al. 2021, AJ, 161, 24 [Google Scholar]
- Gillon, M., Anderson, D. R., Collier-Cameron, A., et al. 2013, A&A, 552, A82 [NASA ADS] [CrossRef] [EDP Sciences] [Google Scholar]
- Ginzburg, S., Schlichting, H. E., & Sari, R. 2016, ApJ, 825, 29 [Google Scholar]
- Ginzburg, S., Schlichting, H. E., & Sari, R. 2018, MNRAS, 476, 759 [Google Scholar]
- Gizis, J. E. 1997, AJ, 113, 806 [NASA ADS] [CrossRef] [Google Scholar]
- Gomez Barrientos, J., Kaltenegger, L., & MacDonald, R. J. 2023, MNRAS, 524, L5 [CrossRef] [Google Scholar]
- Hamuy, M., Walker, A. R., Suntzeff, N. B., et al. 1992, PASP, 104, 533 [NASA ADS] [CrossRef] [Google Scholar]
- Hamuy, M., Suntzeff, N. B., Heathcote, S. R., et al. 1994, PASP, 106, 566 [NASA ADS] [CrossRef] [Google Scholar]
- Hayward, T. L., Brandl, B., Pirger, B., et al. 2001, PASP, 113, 105 [NASA ADS] [CrossRef] [Google Scholar]
- Hedges, C., Angus, R., Barentsen, G., et al. 2020, Res. Notes Am. Astron. Soc., 4, 220 [Google Scholar]
- Henry, T. J., Jao, W. C., Winters, J. G., et al. 2019, VizieR Online Data Catalog: J/AJ/155/265 [Google Scholar]
- Hippke, M., & Heller, R. 2019, A&A, 623, A39 [NASA ADS] [CrossRef] [EDP Sciences] [Google Scholar]
- Hippke, M., David, T. J., Mulders, G. D., & Heller, R. 2019, AJ, 158, 143 [Google Scholar]
- Jehin, E., Gillon, M., Queloz, D., et al. 2011, The Messenger, 145, 2 [NASA ADS] [Google Scholar]
- Jenkins, J. M. 2002, ApJ, 575, 493 [Google Scholar]
- Jenkins, J. M., Twicken, J. D., McCauliff, S., et al. 2016, SPIE Conf. Ser., 9913, 99133E [Google Scholar]
- Jenkins, J. M., Tenenbaum, P., Seader, S., et al. 2020, Kepler Data Processing Handbook: Transiting Planet Search, (USA: Kepler Science Document KSCI- 19081-003) [Google Scholar]
- Jin, S., Mordasini, C., Parmentier, V., et al. 2014, ApJ, 795, 65 [Google Scholar]
- Jordan, S., Rimmer, P. B., Shorttle, O., & Constantinou, T. 2021, ApJ, 922, 44 [NASA ADS] [CrossRef] [Google Scholar]
- Kaltenegger, L. 2017, ARA&A, 55, 433 [NASA ADS] [CrossRef] [Google Scholar]
- Kaltenegger, L., Lin, Z., & Rugheimer, S. 2020, ApJ, 904, 10 [NASA ADS] [CrossRef] [Google Scholar]
- Kaltenegger, L., Payne, R., Lin, Z., Kasting, J., & Delrez, L. 2023, MNRAS, 524, L10 [NASA ADS] [CrossRef] [Google Scholar]
- Kane, S. R., Kopparapu, R. K., & Domagal-Goldman, S. D. 2014, ApJ, 794, L5 [NASA ADS] [CrossRef] [Google Scholar]
- Kilic, M., Munn, J. A., Harris, H. C., et al. 2017, ApJ, 837, 162 [Google Scholar]
- Kovács, G., Zucker, S., & Mazeh, T. 2002, A&A, 391, 369 [Google Scholar]
- Lasker, B. M., Doggett, J., McLean, B., et al. 1996, ASP Conf. Ser., 101, 88 [NASA ADS] [Google Scholar]
- Lee, E. J., & Connors, N. J. 2021, ApJ, 908, 32 [NASA ADS] [CrossRef] [Google Scholar]
- Lépine, S., Rich, R. M., & Shara, M. M. 2003, AJ, 125, 1598 [CrossRef] [Google Scholar]
- Lépine, S., Rich, R. M., & Shara, M. M. 2007, ApJ, 669, 1235 [CrossRef] [Google Scholar]
- Li, C., & Zhao, G. 2017, ApJ, 850, 25 [NASA ADS] [CrossRef] [Google Scholar]
- Li, J., Tenenbaum, P., Twicken, J. D., et al. 2019, PASP, 131, 024506 [NASA ADS] [CrossRef] [Google Scholar]
- Lindegren, L., Bastian, U., Biermann, M., et al. 2021, A&A, 649, A4 [EDP Sciences] [Google Scholar]
- Lopez, E. D., & Fortney, J. J. 2013, ApJ, 776, 2 [Google Scholar]
- Lopez, E. D., & Rice, K. 2018, MNRAS, 479, 5303 [NASA ADS] [CrossRef] [Google Scholar]
- Luque, R., & Pallé, E. 2022, Science, 377, 1211 [NASA ADS] [CrossRef] [Google Scholar]
- Malik, M., Grosheintz, L., Mendonça, J. M., et al. 2018, Astrophysics Source Code Library, [record ascl:1807.009] [Google Scholar]
- Mann, A. W., Brewer, J. M., Gaidos, E., Lépine, S., & Hilton, E. J. 2013, AJ, 145, 52 [Google Scholar]
- Mann, A. W., Deacon, N. R., Gaidos, E., et al. 2014, AJ, 147, 160 [CrossRef] [Google Scholar]
- Mann, A. W., Feiden, G. A., Gaidos, E., Boyajian, T., & von Braun, K. 2015, ApJ, 804, 64 [Google Scholar]
- Mann, A. W., Dupuy, T., Kraus, A. L., et al. 2019, ApJ, 871, 63 [Google Scholar]
- Martín, E. L., Delfosse, X., Basri, G., et al. 1999, AJ, 118, 2466 [Google Scholar]
- McCully, C., Volgenau, N. H., Harbeck, D.-R., et al. 2018, SPIE Conf. Ser., 10707, 107070K [Google Scholar]
- Miller, J. S., & Stone, R. P. S. 1994, The Kast Double Spectrograph, Technical Report 66, University of California Lick Observatory Technical Reports [Google Scholar]
- Minkowski, R. L., & Abell, G. O. 1963, in Basic Astronomical Data: Stars and Stellar Systems, ed. K. A. Strand (Chicago: The University of Chicago Press), 481 [Google Scholar]
- Mollière, P., Wardenier, J. P., van Boekel, R., et al. 2019, A&A, 627, A67 [Google Scholar]
- Mugrauer, M., & Michel, K.-U. 2020, Astron. Nachr., 341, 996 [NASA ADS] [CrossRef] [Google Scholar]
- Mugrauer, M., & Michel, K.-U. 2021, Astron. Nachr., 342, 840 [NASA ADS] [CrossRef] [Google Scholar]
- Narita, N., Fukui, A., Kusakabe, N., et al. 2019, J. Astron. Telesc. Instrum. Syst., 5, 015001 [NASA ADS] [Google Scholar]
- Narita, N., Fukui, A., Yamamuro, T., et al. 2020, SPIE Conf. Ser., 11447, 114475K [NASA ADS] [Google Scholar]
- Ostberg, C., Kane, S. R., Li, Z., et al. 2023, AJ, 165, 168 [NASA ADS] [CrossRef] [Google Scholar]
- Owen, J. E., & Wu, Y. 2013, ApJ, 775, 105 [Google Scholar]
- Parviainen, H. 2015, MNRAS, 450, 3233 [Google Scholar]
- Parviainen, H., Tingley, B., Deeg, H. J., et al. 2019, A&A, 630, A89 [NASA ADS] [CrossRef] [EDP Sciences] [Google Scholar]
- Parviainen, H., Luque, R., & Palle, E. 2024, MNRAS, 527, 5693 [Google Scholar]
- Pass, E. K., Charbonneau, D., Latham, D. W., et al. 2024, ApJ, 966, 231 [NASA ADS] [CrossRef] [Google Scholar]
- Payne, R. C., & Kaltenegger, L. 2024, MNRAS, 530, L13 [NASA ADS] [CrossRef] [Google Scholar]
- Pidhorodetska, D., Moran, S. E., Schwieterman, E. W., et al. 2021, AJ, 162, 169 [NASA ADS] [CrossRef] [Google Scholar]
- Pozuelos, F. J., Suárez, J. C., de Elía, G. C., et al. 2020, A&A, 641, A23 [NASA ADS] [CrossRef] [EDP Sciences] [Google Scholar]
- Pozuelos, F. J., Timmermans, M., Rackham, B. V., et al. 2023, A&A, 672, A70 [NASA ADS] [CrossRef] [EDP Sciences] [Google Scholar]
- Quirrenbach, A., CARMENES Consortium, Amado, P. J., et al. 2020, SPIE Conf. Ser., 11447, 114473C [Google Scholar]
- Rayner, J. T., Toomey, D. W., Onaka, P. M., et al. 2003, PASP, 115, 362 [NASA ADS] [CrossRef] [Google Scholar]
- Rayner, J. T., Cushing, M. C., & Vacca, W. D. 2009, ApJS, 185, 289 [Google Scholar]
- Reid, I. N., Hawley, S. L., & Gizis, J. E. 1995, AJ, 110, 1838 [Google Scholar]
- Reylé, C., Jardine, K., Fouqué, P., et al. 2021, A&A, 650, A201 [Google Scholar]
- Ricker, G. R., Winn, J. N., Vanderspek, R., et al. 2015, J. Astron. Telesc. Instrum. Syst., 1, 014003 [Google Scholar]
- Riddick, F. C., Roche, P. F., & Lucas, P. W. 2007, MNRAS, 381, 1067 [Google Scholar]
- Rojas-Ayala, B., Covey, K. R., Muirhead, P. S., & Lloyd, J. P. 2012, ApJ, 748, 93 [Google Scholar]
- Savitzky, A., & Golay, M. J. E. 1964, Anal. Chem., 36, 1627 [Google Scholar]
- Schlafly, E. F., & Finkbeiner, D. P. 2011, ApJ, 737, 103 [Google Scholar]
- Schönrich, R., Binney, J., & Dehnen, W. 2010, MNRAS, 403, 1829 [NASA ADS] [CrossRef] [Google Scholar]
- Seifahrt, A., Bean, J. L., Stürmer, J., et al. 2020, SPIE Conf. Ser., 11447, 114471F [NASA ADS] [Google Scholar]
- Smith, J. C., Stumpe, M. C., Van Cleve, J. E., et al. 2012, PASP, 124, 1000 [Google Scholar]
- Stassun, K. G., Oelkers, R. J., Pepper, J., et al. 2018, AJ, 156, 183 [NASA ADS] [CrossRef] [Google Scholar]
- Stumpe, M. C., Smith, J. C., Van Cleve, J. E., et al. 2012, PASP, 124, 985 [Google Scholar]
- Stumpe, M. C., Smith, J. C., Catanzarite, J. H., et al. 2014, PASP, 126, 100 [Google Scholar]
- Sullivan, P. W., Winn, J. N., Berta-Thompson, Z. K., et al. 2015, ApJ, 809, 77 [Google Scholar]
- Tenenbaum, P., Christiansen, J. L., Jenkins, J. M., et al. 2012, ApJS, 199, 24 [NASA ADS] [CrossRef] [Google Scholar]
- Tsai, S.-M., Lyons, J. R., Grosheintz, L., et al. 2017, ApJS, 228, 20 [NASA ADS] [CrossRef] [Google Scholar]
- Turbet, M., Ehrenreich, D., Lovis, C., Bolmont, E., & Fauchez, T. 2019, A&A, 628, A12 [NASA ADS] [CrossRef] [EDP Sciences] [Google Scholar]
- Twicken, J. D., Catanzarite, J. H., Clarke, B. D., et al. 2018, PASP, 130, 064502 [Google Scholar]
- Van Eylen, V., Agentoft, C., Lundkvist, M. S., et al. 2018, MNRAS, 479, 4786 [Google Scholar]
- Van Eylen, V., Astudillo-Defru, N., Bonfils, X., et al. 2021, MNRAS, 507, 2154 [NASA ADS] [Google Scholar]
- Venturini, J., Guilera, O. M., Haldemann, J., Ronco, M. P., & Mordasini, C. 2020, A&A, 643, L1 [NASA ADS] [CrossRef] [EDP Sciences] [Google Scholar]
- Venturini, J., Ronco, M. P., Guilera, O. M., et al. 2024, A&A, 686, L9 [NASA ADS] [CrossRef] [EDP Sciences] [Google Scholar]
- Wells, R. D., Rackham, B. V., Schanche, N., et al. 2021, A&A, 653, A97 [NASA ADS] [CrossRef] [EDP Sciences] [Google Scholar]
- West, A. A., Hawley, S. L., Bochanski, J. J., et al. 2008, AJ, 135, 785 [Google Scholar]
- Wizinowich, P., Acton, D. S., Shelton, C., et al. 2000, PASP, 112, 315 [NASA ADS] [CrossRef] [Google Scholar]
- Zacharias, N., Finch, C. T., Girard, T. M., et al. 2012, VizieR Online Data Catalog: I/322A [Google Scholar]
- Ziegler, C., Tokovinin, A., Briceño, C., et al. 2020, AJ, 159, 19 [Google Scholar]
Available at http://irtfweb.ifa.hawaii.edu/~spex/observer/
kastredux: https://github.com/aburgasser/kastredux
All Tables
Ground-based facilities and their corresponding parameters used in the time-series photometric observations of TOI-6002 and TOI-5713.
Stellar parameters. Parameters in bold are the adopted stellar values in the analyses.
Median values and 68% confidence intervals for the parameters of TOI-6002 b and TOI-5713 b obtained using EXOFASTv2 for circular and eccentric orbits.
Priors assumed for the quadratic limb-darkening coefficients for each passband for both stars TOI-6002 and TOI-5713.
All Figures
|
Fig. 1 NIR AO imaging and sensitivity curve for TOI 5713 (Keck) and TOI 6002 (Palomar). Inset: images of the central portion of the data. |
| In the text | |
|
Fig. 2 SpeX SXD spectra of TOI-5713 (top) and TOI-6002 (bottom). Spectra of the targets (blue) and the M3.5V spectral standard GJ 273 (grey) are shown. Annotations indicate strong spectral features of M dwarfs, and shaded regions cover wavelengths with strong telluric absorption. |
| In the text | |
|
Fig. 3 Shane/Kast blue and red optical spectra (black lines) of TOI-5713 (top) and TOI-6002 (bottom) compared to their best-fit M4 SDSS standard templates (magenta line; Bochanski et al. 2007). Data are normalized at 7400 Å, and the gap between 5600 Å and 5900 Å in the spectrum of TOI-6002 corresponds to the dichroic split between the Kast blue and red channels. Key spectral features across the 4200–8900 Å region are labeled. Inset boxes highlight the regions around the 6563 Å Hα and 6708 Å Li I lines. |
| In the text | |
|
Fig. 4 Spectral energy distribution (SED) of TOI-5713 (left) and TOI-6002 (right). Black lines represent the SED best-fit models. Blue circles represent the average broadband flux measurements based on the SED model. Horizontal error bars show the filters bandwidth, and the vertical error bars show the uncertainty on the flux measurements. |
| In the text | |
|
Fig. 5 Archival images cropped with a field of view of 1′ ×1′ around TOI-5713 (top row) and TOI-6002 (bottom row). Circles in red show the current position of the stars, and the circles in yellow, in the bottom row, show the positions of TOI-6002 at the dates of exposures. |
| In the text | |
|
Fig. 6 Top panel: TOI-5713 injection and recovery test, where TOI-5713 b is rendered with a red marker. Bottom panel: TOI-6002 injection and recovery test, where TOI-6002 b is rendered with a red marker. |
| In the text | |
|
Fig. 7 TESS-SIP power spectrum of TOI-5713 based on the four TESS sectors. We calculate the periodogram for both the corrected light curve (top panel) and the background (BKG) pixels (bottom panel). The star’s periodogram shows some power excess compared to the BKG. |
| In the text | |
|
Fig. 8 Phase-folded detrended ground-based transit light curves with time in hours from mid-transit of TOI-6002 b (left) and TOI-5713 b (right). The unbinned light curves are shown with gray points. The binned points (bin size=6 min) are shown in black with the corresponding error bars. The solid-colored lines corresponds to the best-fit transit model from the final joint fit. |
| In the text | |
|
Fig. 9 TESS phase-folded detrended light curve with the time in hours from mid-transit of TOI-6002 b (left) and TOI-5713 b (right). The red solid lines represent the best-fit transit model from the global fit. The gray dots are the 2-min TESS data and the black dots with error bars show the data binned every 5 minutes. The residuals are plotted in the bottom panel. |
| In the text | |
|
Fig. 10 Distribution of planet radii and orbital periods for all confirmed small planets hosted by low-mass stars (M* ≲ 0.65 M⊙). The solid line represents the predicted location of the radius valley based on the gas-depleted formation model (Cloutier & Menou 2020). The dashed line shows the predicted location of the valley for the thermally-driven photoevaporation and gas-poor formation models (Van Eylen et al. 2018). The red and blue dots represents the planets TOI-6002b and TOI-5713b, respectively. The 1D radius distribution, with the location of the two planets, is shown on the right panel. |
| In the text | |
|
Fig. 11 Simulated JWST transmission spectra for TOI-6002b and TOI-5713b. The top panel shows spectra for a cloudless, 1-bar Earth-like atmosphere. The bottom panel displays spectra for a 92-bar Venus-like atmosphere, both cloudless (black) and with a cloud deck at 10 mbar (green). Error bars are shown for a transit observation simulated at R = 30. |
| In the text | |
|
Fig. A.1 Target pixel files (TPFs) of TOI-6002 (TIC 102734241) in TESS sectors 14, 41, 54, 55, and TOI-5713 (TIC 219041246) in sectors 16, 22, 23, and 49 created with tpfplotter (Aller et al. 2020). Regions in orange highlight the aperture used to extract the SPOC photometry. Red circles represent the Gaia DR2 sources, with sizes representing the magnitude contrasts with respect to the targets. |
| In the text | |
|
Fig. A.2 Detrended TESS photometry of TOI-6002 b and TOI-5713 b. The flares in the TOI-573 light curves were removed using an upper 3σ clipping. Gray points show the detrended PDC-SAP fluxes from the SPOC pipeline. Orange and red points highlight the transits of TOI-6002 b and TOI-5713 b, respectively |
| In the text | |
Current usage metrics show cumulative count of Article Views (full-text article views including HTML views, PDF and ePub downloads, according to the available data) and Abstracts Views on Vision4Press platform.
Data correspond to usage on the plateform after 2015. The current usage metrics is available 48-96 hours after online publication and is updated daily on week days.
Initial download of the metrics may take a while.