Fig. 10
Download original image
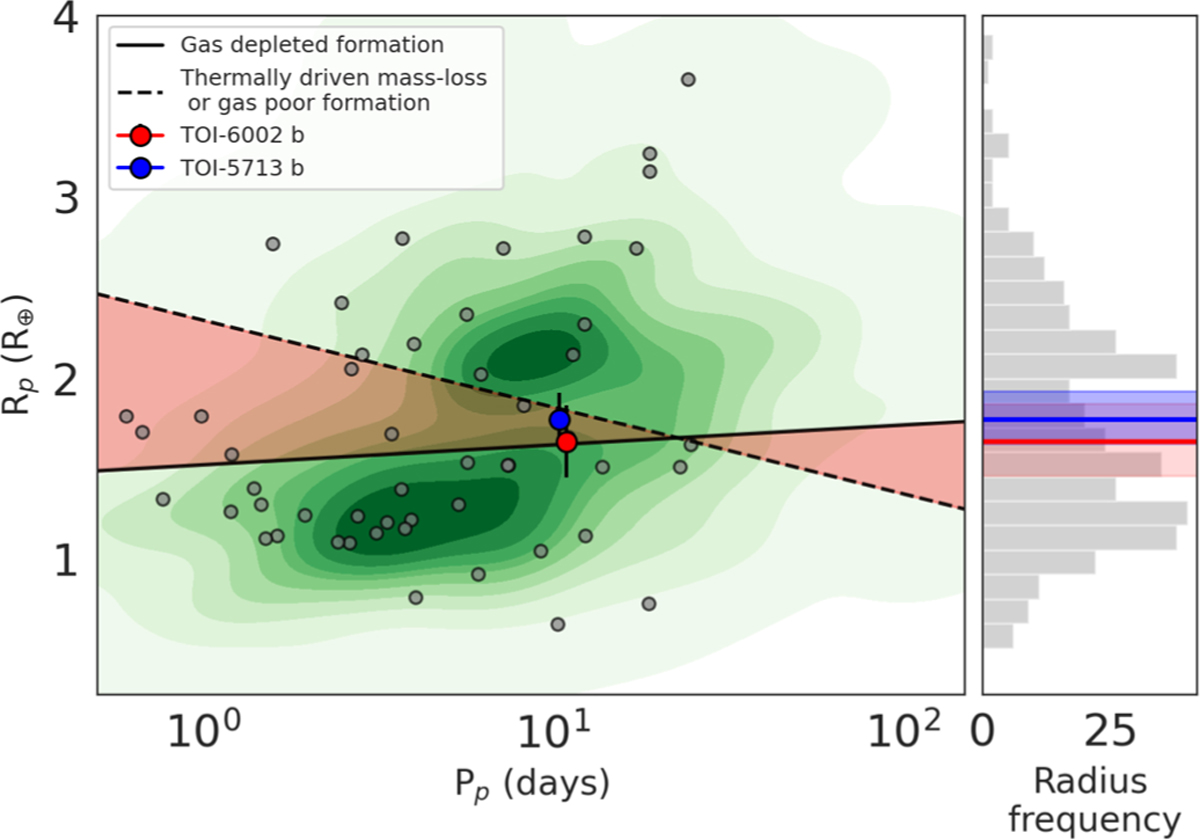
Distribution of planet radii and orbital periods for all confirmed small planets hosted by low-mass stars (M* ≲ 0.65 M⊙). The solid line represents the predicted location of the radius valley based on the gas-depleted formation model (Cloutier & Menou 2020). The dashed line shows the predicted location of the valley for the thermally-driven photoevaporation and gas-poor formation models (Van Eylen et al. 2018). The red and blue dots represents the planets TOI-6002b and TOI-5713b, respectively. The 1D radius distribution, with the location of the two planets, is shown on the right panel.
Current usage metrics show cumulative count of Article Views (full-text article views including HTML views, PDF and ePub downloads, according to the available data) and Abstracts Views on Vision4Press platform.
Data correspond to usage on the plateform after 2015. The current usage metrics is available 48-96 hours after online publication and is updated daily on week days.
Initial download of the metrics may take a while.