Fig. 4
Download original image
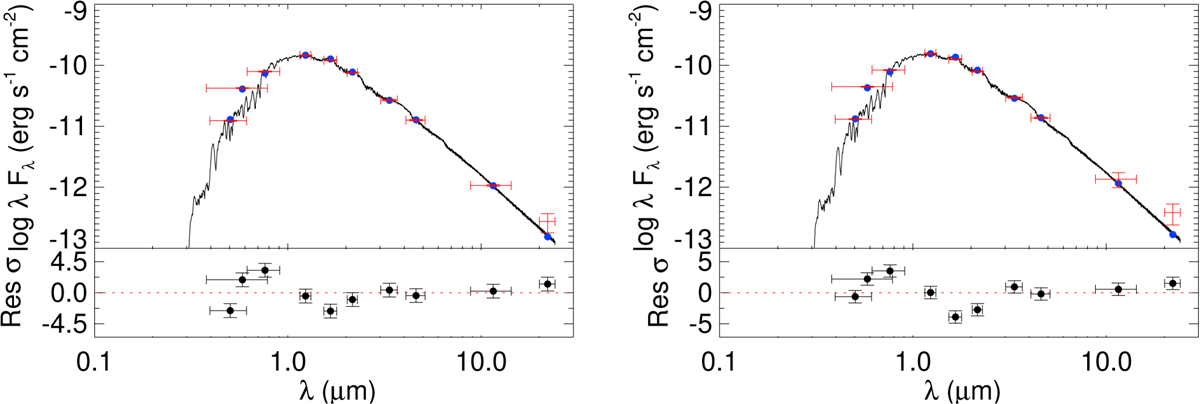
Spectral energy distribution (SED) of TOI-5713 (left) and TOI-6002 (right). Black lines represent the SED best-fit models. Blue circles represent the average broadband flux measurements based on the SED model. Horizontal error bars show the filters bandwidth, and the vertical error bars show the uncertainty on the flux measurements.
Current usage metrics show cumulative count of Article Views (full-text article views including HTML views, PDF and ePub downloads, according to the available data) and Abstracts Views on Vision4Press platform.
Data correspond to usage on the plateform after 2015. The current usage metrics is available 48-96 hours after online publication and is updated daily on week days.
Initial download of the metrics may take a while.