| Issue |
A&A
Volume 688, August 2024
|
|
|---|---|---|
| Article Number | A196 | |
| Number of page(s) | 16 | |
| Section | Planets and planetary systems | |
| DOI | https://doi.org/10.1051/0004-6361/202450466 | |
| Published online | 22 August 2024 | |
Characterising planetary systems with SPIRou: Temperate sub-Neptune exoplanet orbiting the nearby fully convective star GJ 1289 and a candidate around GJ 3378★,★★
1
Univ. de Toulouse, CNRS, IRAP,
14 avenue Belin,
31400
Toulouse,
France
e-mail: claire.moutou@irap.omp.eu
2
Institut Trottier de Recherche sur les Exoplanètes, Université de Montréal,
1375 Ave Thérèse-Lavoie-Roux,
Montréal,
QC
H2V 0B3,
Canada
3
Univ. Grenoble Alpes, CNRS, IPAG,
38000
Grenoble,
France
4
Canada-France-Hawaii Telescope, CNRS,
96743
Kamuela,
Hawaii,
USA
5
Aix-Marseille Université, CNRS, CNES, LAM (Laboratoire d'Astrophysique de Marseille),
Marseille,
France
6
Institut d'Astrophysique de Paris, UMR7095 CNRS, Université Pierre & Marie Curie,
98 bis boulevard Arago,
75014
Paris,
France
Received:
22
April
2024
Accepted:
10
June
2024
We report the discovery of two new exoplanet systems around fully convective stars, found from the radial-velocity (RV) variations of their host stars measured with the nIR spectropolarimeter CFHT/SPIRou over multiple years. GJ 3378 b is a planet with minimum mass of 5.26−0.97+0.94 M⊕ on an eccentric 24.73-day orbit around an M4V star of 0.26 M⊙. GJ 1289 b has a minimum mass of 6.27 ± 1.25 M⊙ in a 111.74-day orbit, on a circular orbit around an M4.5V star of mass 0.21 M⊙. Both stars are in the solar neighbourhood, at 7.73 and 8.86 pc, respectively. The low-amplitude RV signals are detected after line-by-line post-processing treatment. These potential sub-Neptune class planets around cool stars may have temperate atmospheres and be interesting nearby systems for further studies. We also recovered the large-scale magnetic field of both stars, found to be mostly axisymmetric and dipolar, with polar strengths of 20–30 G and 200–240 G for GJ 3378 (in 2019–2021) and GJ 1289 (in 2022–2023), respectively. The rotation periods measured with the magnetic field differ from the orbital periods and, in general, stellar activity is not seen in the studied nIR RV time series of both stars. GJ 3378 b detections have not been confirmed by optical RVs and, therefore, they are solely considered a candidate for the present purposes.
Key words: instrumentation: spectrographs / techniques: radial velocities / stars: magnetic field / planetary systems / stars: individual: GJ 1289 / stars: individual: GJ 3378
Radial velocity tables are available at the CDS via anonymous ftp to cdsarc.cds.unistra.fr (130.79.128.5) or via https://cdsarc.cds.unistra.fr/viz-bin/cat/J/A+A/688/A196
Based on observations obtained at the Canada-France-Hawaii Telescope (CFHT) which is operated by the National Research Council (NRC) of Canada, the Institut National des Sciences de l’Univers of the Centre National de la Recherche Scientifique (CNRS) of France, and the University of Hawaii. The observations at the CFHT were performed with care and respect from the summit of Maunakea which is a significant cultural and historic site.
© The Authors 2024
 Open Access article, published by EDP Sciences, under the terms of the Creative Commons Attribution License (https://creativecommons.org/licenses/by/4.0), which permits unrestricted use, distribution, and reproduction in any medium, provided the original work is properly cited.
This article is published in open access under the Subscribe to Open model. Subscribe to A&A to support open access publication.
1 Introduction
Although M dwarfs are the most common stars in the Galaxy (Reylé et al. 2021), the exoplanet populations accompanying these low-luminosity parent stars can only be closely studied within the solar neighbourhood. Over the last decade, a trend has been seen for low-mass stars having low-mass planetary companions, apart from a few exemplary systems containing a massive planet (Bonfils et al. 2013; Dressing & Charbonneau 2015; Sabotta et al. 2021). This configuration has also been confirmed via exoplanet population synthesis, as recently developed in Burn et al. (2021).
The population of planets around the latest type stars is, however, less constrained with observations than the earlier types. Such stars are faint and sometimes rapidly rotating and active, which complicates their observation. However, a few famous planetary systems in this category have been discovered in the last decade, such those of Proxima Cen (Anglada-Escudé et al. 2013), Trappist-1 (Gillon et al. 2016), or GJ 1002 (Suárez Mascareño et al. 2023).
Precision radial-velocity (RV) measurements of M dwarfs were first obtained in the optical domain then, more recently, the spectral range of such observations has been extended towards the far-red and near-infrared (nIR) domains. A first advantage is to have instruments more sensitive to cool, red stars (Artigau et al. 2018). In addition, getting RV observations in a wide spectral range helps distinguish between chromatic stellar effects and achromatic planetary signatures (Huélamo et al. 2008; Reiners et al. 2013; Carmona et al. 2023). When optical and nIR spectra are obtained at the same time, it also expands the number and diversity of observed spectral lines, as with HARPS+NIRPS (Wildi et al. 2022), CARMENES (Quirrenbach et al. 2014), or GIARPS (Claudi et al. 2016).
However, with respect to RV measurements in the nIR domain, they may be plagued by systematic noise at a higher level than optical RVs. This is mostly due to the presence of telluric lines and the varying relative position of the telluric and stellar spectra in the instrumental focal plane. More stringent corrections of the extracted spectra are needed (compared to optical data) to get rid of this telluric contamination. Then, specific corrections at the level of stellar lines are required to remove any residual signature of telluric signals affecting the RV time series. Advanced techniques have been developed in the last years based on line-by-line analyses (Cretignier et al. 2021; Artigau et al. 2022; Ould-Elhkim et al. 2023).
Low-mass stars tend to be more active due to the properties of their magnetic field (Morin et al. 2010; Kochukhov 2021; Mignon et al. 2023). Recent studies have even suggested that some of them are able to trigger unusually strong large-scale magnetic fields despite their long rotation periods (Lehmann et al. 2024) and that their flaring rate remains high (Medina et al. 2022). While requiring caution for the interpretation of RV signals whose period is close to the rotation period (and first harmonics), this does not prevent us from searching for planetary companions around such stars.
In this paper, we investigate the RV time series of two fully convective stars observed in the nIR domain with SPIRou (Donati et al. 2020). Two new exoplanets are found around the nearby stars GJ 3378 and GJ 1289 after an intensive RV campaign. In Sect. 2, the target stars and the SPIRou observations are described as well as the data analysis method, as well as the magnetic properties of the parent stars. In Sect. 3, the new detected RV signals are presented. In Sect. 4, we discuss these new planets in the context of M-star exoplanet populations and present our conclusions.
2 Observations
2.1 SPIRou data
High-resolution spectroscopy and RV measurements were performed at the Canada-France-Hawaii observatory with the SPIRou (SpectroPolarimetre InfraROUge) instrument (Donati et al. 2020). SPIRou covers the 985–2450 nm wavelength range with a 70 000 resolving power and is highly stabilised for precise RV measurements. The data were collected in the framework of the SPIRou Legacy Survey Planet Search (SLS-PS) programme described in Moutou et al. (2023)1. For GJ 1289, additional data were collected within the SPICE large programme2, with homogeneous quality throughout.
SPIRou performs velocimetric and spectropolarimetric measurements simultaneously. Each visit consists of four consecutive exposures with different positions of the quarter-wave plates, in order to achieve a circular polarisation (Stokes V) analysis of the stellar light. Spectropolarimetric measurements of the target stars (up to BJD 2459800) have been described and analysed in previous works (Fouqué et al. 2023; Donati et al. 2023; Lehmann et al. 2024). The RV measurement, in turn, was done on individual exposures first (details below) and then combined in a single per-night RV value.
GJ 3378 was observed with SPIRou 181 times between 18 September 2019 and 31 January 2022, over a time span of 876 days. The airmass values range from 1.301 to 2.037. The spectrum moves within a barycentric Earth RV (BERV) range of ±24.5 km s−1 due to the Earth motion around the Sun, a configuration that is favourable to getting a clean stellar template and good performance in telluric correction (Ould-Elhkim et al, in prep.). The average exposure time is 544s per visit and the mean obtained signal-to-noise ratio (S/N) is 212 per pixel in the H band. GJ 1289 was observed with SPIRou 300 times between 15 May 2019 and 25 January 2024 with a time span of 1686 days. The airmass vales range from 1.05 to 2.54 and observations have a maximum BERV range of ±25.2 km s−1. Average exposure times and S/N per nightly visit are, respectively, 800s and 200 per pixel in the H band. Tables of observational data and derived values are given at CDS.
Stellar parameters of GJ 3378 and GJ 1289.
2.2 Stars
GJ 3378 and GJ 1289 are both fully convective M stars located at 8.86 and 7.73 pc, respectively (Gaia Collaboration 2020), with fully convective stars being defined by a mass lower than 0.35 M⊙ (Chabrier & Baraffe 1997). Their metallicity is close to solar and their estimated mass was obtained from the spectro-scopic analysis of SPIRou spectra by Cristofari et al. (2022) and Cristofari et al. (2023), as summarised in Table 1. The rotation periods have been measured using the quasi-periodic modelling of their longitudinal magnetic-field modulation. GJ 1289 has a rotation period of 73.66±0.92 days, while GJ 3378 has a rotation period of 95.1 ±2.3 days (Donati et al. 2023). We note that Sabotta et al. (2021) reports a shorter rotation period for GJ 3378, of 83.4 days from the variation of the average stellar line width, possibly suggesting differential rotation at the surface of the star. Despite a slow rotation, GJ 1289 hosts a strong large-scale magnetic field that rapidly evolves over time, with, for instance, a dipole strength increasing from 80 to 200 G from 2019 to 2021 (Lehmann et al. 2024). More recent data included in this paper are described and analysed in Sect. 2.3. The magnetic field of GJ 3378 is clearly detected as shown in Donati et al. (2023) and its topology is described in Sect. 2.3.
The small-scale magnetic fields of GJ 3378 and GJ 1289 were also estimated from their mean intensity spectra, which were calculated from the same collection of SPIRou spectra by Cristofari et al. (2023) using Zeeturbo. A mean field of 150±50 G was found at the surface of GJ 3378, depicting a very quiet star with 94% of its surface at undetected levels of magnetic field, and active regions totalling only 6% of the surface at 2kG. GJ 1289 has a stronger field, with a mean value of 1010±80 G and 45% of its surface at more than 2kG. The time dependence of the small-scale magnetic field of GJ 1289 will be studied in a forthcoming paper (Charpentier et al, in prep.).
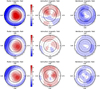 |
Fig. 1 Reconstructed maps of the large-scale field of GJ 3378 in seasons 2019, 2020, and 2021 (from top to bottom). The left, middle, and right columns represent the radial, azimuthal, and meridional field components in spherical coordinates. The colour bar is expressed in Gauss. The maps are shown in a flattened polar projection down to latitude −60° with the pole at the centre and the equator depicted as a bold line. Outer ticks indicate phases of observations, assuming a rotation period of 95.1 days and counting from an arbitrary BJD of 2458745.0. |
2.3 Magnetic topology of parent stars
We first applied a least-squares deconvolution (LSD; Donati et al. 1997) to all recorded Stokes V spectra of GJ 3378 and GJ 1289, using a M3V mask as described in Donati et al. (2023). We then analysed the time series of Stokes V LSD profiles within each observing season, translating the observed rotational modulation into a map of the large-scale field using Zeeman-Doppler Imaging (ZDI; Donati et al. 2006). We proceeded as outlined in (Lehmann et al. 2024), assuming that the large-scale magnetic topology is constant over each observing season, setting the inclination angle of the stellar rotation axis to the line of sight to i = 60° and using the rotation period derived from the quasi periodic variations of the longitudinal field (Donati et al. 2023, see Table 1).
The large-scale magnetic maps we obtained are shown in Figs. 1 and 2 for GJ 3378 (in seasons 2019/20, 2020/21 and 2021/22) and GJ 1289 (2022/23 and 2023/24), respectively, with the main characteristics of the recovered fields being listed in Tables 2 and 3. For all seasons and for both stars, the reconstructed topologies are mainly poloidal, as expected from the low sensitivity of Stokes V profiles to toroidal fields in stars as slowly rotating as our targets (Lehmann et al. 2024), whereas the poloidal fields are mostly dipolar (with the dipole enclosing 85–95% of the magnetic energy). Moreover, the reconstructed fields are largely axisymmetric, with the magnetic dipoles being tilted at 20–38° to the rotation axis. We find that the large-scale field of GJ 3378 (in the range 20–30 G, see Table 2) has been weakening with time over our three observing seasons, whereas the much stronger field of GJ 1289 (in the range 200–250 G, see Table 3) continues to exhibit the strengthening trend already pointed out in Lehmann et al. (2024). No major change in the overall polarity of the large-scale fields (such as those reported for similar M dwarfs in Lehmann et al. 2024), nor of their main characteristics, is observed for these two targets over our long-term observing campaign. In Table 2, we list for each observing season: the average reconstructed large-scale field strength (〈BV〉), polar strength of the dipole component (Bdip), amount of magnetic energy reconstructed in the poloidal (ƒpol) and axisymmetric (ƒaxi) components of the field, tilt of the dipole field to the rotation axis, and the rotation phase towards which the dipole points (in the ephemeris mentioned on Fig. 1). Error bars are typically equal to 5–10% for field strengths and percentages, and 5–10° for field inclinations.
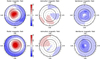 |
Fig. 2 Same as Fig. 1 but for GJ 1289 in seasons 2022 (top) and 2023 (bottom). Phases are computed assuming a rotation period of 73.66 days and counting from an arbitrary BJD of 2458649.0. |
Properties of the large-scale magnetic field of GJ 3378.
Properties of the large-scale magnetic field of GJ 1289.
2.4 Radial velocity measurements and post-processing treatment
The precision RV measurements were obtained from an extraction of the spectra with the SPIRou pipeline APERO (Cook et al. 2022), followed up with a line-by-line (LBL) analysis developed for SPIRou by Artigau et al. (2022). The PCA-based line selection method called wapiti3 (Ould-Elhkim et al. 2023) was then used on LBL time series to correct for telluric residuals as is relevant with nIR RVs and small signals. The correction is only applied to the lines that are more affected by residual noise. There are three steps in the post-treatment, as described by Ould-Elhkim et al. (2023). First, we selected all spectra with S/N larger than 70% of the requested S/N is done, including all lines present in at least 50% of the epochs. The reason behind this first cut-off is that PCA is highly sensitive to outlier measurements strongly increasing variance, which thus affect the first components. Rejecting lines that are affected by tellurics most of the time is also an important cleaning step, which is regularly done in precision RV measurements using masks. Secondly, we removed of the time-dependent zero-point RVs common to the 19 most RV-quiet stars of the SLS sample (Moutou et al. 2023). Finally, we did the reconstruction and correction of the systematic noise using weighted PCA modelling.
For GJ 3378 and GJ 1289, the number of ordered noisy components that were removed are 4 and 12, respectively. These noisy components clearly show a correlated behaviour with the BERV, symptomatic of telluric residuals. However, the exact number of corrected components in these two cases has no critical impact on the result, since the signal detection is already significant without the wapiti treatment (Figs. 3 and 4). This additional correction, however, allows for the one-year signal due to telluric residuals and its harmonics to be reduced. It may also boost any other signal not related to systematic noise. This has shown to be efficient in the case of known planet signals (Ould-Elhkim et al. 2023). The role of the zero-point correction could also be important – although it has been minor for SPIRou observations so far: other instrumental noises, such as tiny spectral shifts of the wavelength solution at the m s−1 level and common to all measurements may need to be corrected for, as is common practice for other spectrographs (Courcol et al. 2015; Tal-Or et al. 2019; Ribas et al. 2023). It also allows us to use data acquired over several thermal cycles without the need to fit an offset; in addition, such offsets are extremely small in the case of SPIRou. More information about the SPIRou RV zero-point is given in appendix.
The stacked periodograms shown in Figs. 3 and 4 (bottom plots) illustrate how the planetary signal builds up with time, while the stellar activity signal usually seems insignificant, or fluctuating, near the expected rotation periods. This absence of RV jitter for these two M stars may be specific to nIR RV data of such slowly rotating stars, and accentuated by the use of the wPCA post-treatment.
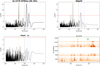 |
Fig. 3 Periodograms of GJ 3378, from top to bottom: SPIRou RVs after pre-cleaning (drift, outlier, and most affected lines removed), wapiti corrected RVs (wPCA corrected), residuals after one planet model is removed, and stacked periodogram. The blue dotted lines show one-year and half-year periods. The green dot-dash line shows the rotation period as measured with the magnetic field proxy. The orange dashed line shows the orbital period, and the red horizontal line shows the detection threshold of logBƒ = 5. On the stacked periodogram, the Y axis corresponds to the time; the orange and green lines show the orbital (24.7 days) and rotational (83–95 days) periods, respectively. |
3 Results
3.1 GJ 3378
The post-treatment removes nine data points of low S/N, ultimately retaining 172 measurements. The SPIRou RV time series of GJ 3378 shows a peak at 24.7 days (Fig. 3, top). Before the wapiti correction, other peaks in the Bayesian periodogram (Mortier et al. 2015; Delisle et al. 2018) are also visible, mainly near 180 and 365 days. These are typical of telluric residuals in SPIRou data and efficiently damped by the wapiti algorithm (see middle panel of Fig. 3). The 24.7 day peak is untouched by this treatment and exhibits a logarithm of the Bayes factor (log BF) of 16.7 (a factor greater than 5 being an acceptable detection threshold). Using the ℓ1 periodogram (Hara et al. 2017) on the DACE platform (Delisle et al. 2016), the most prominent peak has a Laplace Bayes factor of 65 and a period of 24.6 days. After fitting a Keplerian at this period, no other peak is seen in the residuals (Fig. 3 bottom); in particular, there are none near the rotation period range of GJ 3378 (80–100 days) in this RV time series.
We then used RadVel (Fulton et al. 2018) to perform the MCMC analysis of the detected signal. The procedure uses 50 walkers, 200 000 burn steps, and 500 000 steps. We used the following priors: a Gaussian prior for the orbital period (µ = 24.7 days, σ = 5 days), a Gaussian prior for the conjunction time (µ = 2459 181, σ = 15 days), and uniform priors for eccentricity, semi-amplitude, and white-noise jitter with bounds to 1, 100 m s−1, and 10 m s−1, respectively. The preferred model encompasses an RV signal with a semi-amplitude of  , which we attribute to a planetary companion of minimum mass
  with an orbital period of
  days (Fig. 5). The significance of the planet signal is supported by the relative Aikike factor4 ΔAICc of 1676. There is a preference for an eccentric orbit with eccentricity
  . Table 4 shows the model comparison numbers and Table 5 lists all fitted and derived planetary parameters. A final RMS of 3.90 m s−1 was found, while the original RMS was 4.46 m s−1. Assuming a zero albedo and an atmosphere, the equilibrium temperature of the planet would be about 260 K. All parameters are listed in Table 5.
3.2 GJ 1289
The post-treatment removes eight data points of low S/N and the last three visits and thus keeps 289 measurements. As for GJ 3378, we used wide priors for the MCMC modelling: a Gaussian prior for the orbital period (µ = 111 days, σ = 5 days), a Gaussian prior for the conjunction time (µ = 2459 407, σ = 15 days), and uniform priors for eccentricity, semi-amplitude, and white-noise jitter with bounds, respectively, to 1, 100 m s−1, and 10 m s−1. Using chains of 540000 steps, RadVel finds a more favourable one-planet Keplerian model with a companion at an orbital period of  days and semi-amplitude of
  . The signal then corresponds to a planet of minimum mass
  with a preferred circular orbit. The RMS of the pre-filtered time series is 5.23 m s−1 while it decreases to 4.89 m s−1 after wapiti and the Keplerian fit. A white noise jitter value of
  results from the fit. The model comparison values are listed in Table 4 and the derived parameters in Table 5. The best-fit model is shown in Figure 6.
4 Discussion
CARMENES data are available for both stars in Ribas et al. (2023): 79 visits spanning 1400 days for GJ 3378 and 19 visits spanning 1600 days for GJ 1289. When using optical RVs corrected from nightly common zero-point variations of these publicly available time series, none of the reported signals are found. For GJ 1289, this is clearly explained by the small number of visits and poor sampling. There is a weak signal at 114 days in the Lomb-Scargle periodogram, although it is below the detection threshold. The RMS of the time series is 2.6 m s−1 and CARMENES data points are compatible with the signal found with SPIRou (adding CARMENES data does not change the SPIRou result). For GJ 3378, the number of visits allows for a more in-depth combined analysis. The periodogram of CARMENES RVs shows low-significance peaks at 21.6, 43.9, 56.9, and 82.6 days. The first two peaks are the main ones. When fitting together SPIRou and CARMENES data, we find that: 1) the period and amplitude of the 24.7 days signal are modified to  , i.e., a 74.5σ difference on the period and a 3σ difference on the semi-amplitude (1.2 instead of 3.08 m s−1); and 2) when fitted separately, the CARMENES RVs better fit with a pair of eccentric planets at 21.6 and 43.4 day orbital periods with semi-amplitudes of, respectively,
  . Thus, we did not find a good match between CARMENES optical RVs and SPIRou nIR RVs at this stage. It is not always relevant to combine non-simultaneous optical and nIR RVs, especially at these low levels of variations, due to the chromatic variability of stars; an example of this can be seen by studying more active stars such as AD Leo (Carmona et al. 2023). In further studies, we could combine CARMENES nIR RVs with SPIRou data or try more complex modelling by adding other free parameters as in a quasi-periodic Gaussian process modelling of optical and nIR RVs individually. However, this is beyond the scope of this paper, which is solely aimed at reporting the significant RV signal seen by SPIRou, corresponding to a minimum mass of
  in an eccentric orbit with an orbital period of 24.73 days.
While the RV time series of both stars do not exhibit a peak in the periodogram of their RVs at the rotation period (Figs. 3 and 4), the longitudinal magnetic field of our target stars shows a clear signature of rotational modulation with periods of 95.1±2.3 for GJ 3378 and 73.66±0.92 days for GJ 1289 (Fouqué et al. 2023; Donati et al. 2023). We also checked the behaviour of another proxy of activity, dET (differential effective temperature), obtained with the LBL analysis. Relative temperature differences translate into tiny modulations in thousands of lines of the nIR spectra, even when RV variations are unseen; the dET proxy appears to be one of the most robust activity indicator based on the line shape in the nIR domain (Artigau et al, in prep). The periodogram of those dET variations for GJ 3378 and GJ 1289 is shown in Fig. 7. The main peak for GJ 1289 is found at 71.1 days, close to the value exhibited by the magnetic field (2σ difference). For GJ 3378, in turn, the main peak is seen at 82.9 days (a 5σ difference from the magnetic period). This seems to confirm that the (low) signal in CARMENES may be dominated by the stellar activity at the main period of ~83 days with harmonics (~43 and 21 days being close to P/2 and P/4). A difference of rotation periods when using various proxies (flux and temperature contrast versus residual, large-scale magnetic field) may come from the latitudinal distribution and physical properties of active regions and the presence of differential rotation, expected to be at this level in fully convective stars (Morin et al. 2010). We attempted to model the dET modulation observed for GJ 3378 with a quasi-periodic Gaussian process. The RV time series was also included in the multi-dimensional fit, in order to see whether any modulation in the activity indicator would produce RV jitter. We used the Pyaneti package (Barragán et al. 2019), whereas for the RVs, we used the GP and its derivative, as prescribed in Rajpaul et al. (2015). We found that: i) the dET modulation can be fit with the 84 days period; ii) there is a significant amplitude in the GP of dET (0.21 K) with a rather unconstrained decay time of 20–200 days and a smoothing parameter of 0.4; iii) the amplitude of the RV modulation due to the combined GP is compatible with 0 ( ), in agreement with the observation that there is no peak at the rotation period or its harmonics in the RV peri-odogram. Both GP models are shown in Fig. C.1 and detailed data are given in Table C.1. In summary, although the activity indicator is slightly modulated by rotation, it does not produce an RV jitter at our level of precision, for GJ 3378.
We carried out the same analysis for GJ 1289 and found again that activity does not impact the characterisation of the planet signal with SPIRou data. The amplitude of dET is  , while the amplitude of RV GP is 0.26±0.76 m s−1. All parameters of the exoplanet orbit agree within error bars of 1σ. This absence of RV jitter is more surprising for a star as strongly magnetic as GJ 1289. Since we are using wapiti-corrected RVs, there is a possibility that the wPCA correction removes part of the long-term modulation that may be due to stellar activity. With rotation periods of 2–3 months, a smooth and low-amplitude modulation does indeed mimic the low-frequency systematic effects that wapiti handles. That may explain the low amplitude of stellar activity (Ould-Elhkim et al, in prep.); however, in other cases with much shorter rotation periods, such as AD Leo, the nIR RVs also did not show any variations (Carmona et al. 2023). By looking at the whole sample of SLS data of M dwarfs, we should be able to determine in which configurations the nIR RVs shows activity modulation (as it does in the SPIRou time series of Gl 205, Cortés-Zuleta et al. 2023).
We checked the TESS photometric data for both stars. For GJ 3378, TESS data were found in sectors 19, 59, 60, and 73. For GJ 1289, the data in sectors 17 and 57 were used. For both stars, we do not report any transit detection at the expected period and phase.
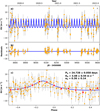 |
Fig. 5 SPIRou RV time series of GJ 3378 as a function of time (top) and folded at the 24.7-day period (bottom). The superimposed model is calculated with RadVel. |
Model comparison for GJ 3378 (top lines) and GJ 1289 (bottom lines).
Planet parameters of GJ 3378 b and GJ 1289 b.
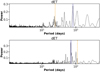 |
Fig. 7 Periodograms of the differential temperature variations for GJ 3378 (top) and GJ 1289 (bottom). Blue regions indicate the main detected periods (centered at 83 days for GJ 3378 and 72 days for GJ1289) while orange dashed lines show the orbital periods. |
5 Conclusion
In this paper, we report the detection and characterisation of a new planetary system orbiting the RV-quiet fully convective star GJ 1289 of 0.21 M⊙, along with a tentative detection of a similar planet candidate around the 0.26 M star GJ 3378. Their full properties are given in Table 5. These planets and the candidate are the first to be found in the sample of nearby M dwarfs monitored by SPIRou (Moutou et al. 2023). Other sub-programmes in the SPIRou Legacy Survey have already contributed to the discovery of TOI planets and planetary companions of young stellar objects in recent years (Artigau et al. 2021; Martioli et al. 2022; Cadieux et al. 2022; Donati et al. 2023; Almenara et al. 2024).
In Fig. 8, we compare the new planet candidates to other known exoplanets of stars less massive than 0.35 M⊙ as function of their orbital period. There are few planets known around such stars at periods exceeding 20 days: some of such planets are found when using multiple instruments, sometimes mixing nIR and optical RVs (like GJ 1151 c; Blanco-Pozo et al. 2023). The planet Kapteyn c (121 day orbital period and minimum mass of 7.0 M⊕; Anglada-Escudé et al. 2014) lies close to GJ 1289 b in this parameter space. It is, however, a debated planet signal (Robertson et al. 2015; Anglada-Escudé et al. 2016; Bortle et al. 2021) due to the possible contamination by stellar activity. As such, it is an excellent candidate for intensive nIR RV follow-up studies, as its activity may be less contaminating for mid-and late-M stars in the nIR domain, as seen in the present study and previously compared to simultaneous optical data (Carmona et al. 2023). The mild equilibrium temperature of sub-Neptunes in the habitable zone of their host stars make them interesting targets for future work, especially atmospheric studies; a cautious approach coupled with additional data is extremely welcome to better characterise the fundamental parameters of these new systems. It hold true especially for GJ 3378 for which non-simultaneous optical data from CARMENES do not confirm the 24.7 days signal claimed here and it seems rather contaminated by stellar activity.
The conservative HZ of both host stars ranges from 0.14 to 0.28 au, while the optimistic HZ ranges from 0.11–0.30 au (Kopparapu et al. 2013, 2014). This means that GJ 3378 b lies in the inner edge of the optimistic HZ while GJ 1289 b lies close to the outer edge of the conservative HZ. Both are closer to their star than the snow line, estimated to be at about 0.37 au (Ida & Lin 2004). As habitable planets require an atmosphere, their having the correct distance measurement is not sufficient. To go further, it would be interesting to further investigate the system’s evolution and architecture. The current RV data does not show evidence for giant planets further out in the system for GJ 3378, even when considering CARMENES data in addition to SPIRou data and a total time span of 6 years. Such an outer giant planet could help the survival and replenishment of an atmosphere for GJ 3378 b despite the stellar evolution and activity, as shown in (Clement et al. 2022). For GJ 1289 b, adding CARMENES data (Ribas et al. 2023) increases the time span to 7.4 years, although with scarce sampling for the first 3 years. Here again, there is no hint for a long-term companion or trend, the residual data when the 111.7 days signal is removed is compatible with the jitter noise of 4.69 m s−1. This level of jitter, however, seems on the high side and it is not excluded that longer monitoring may reveal other planets in the system. In the current state, both systems do not seem similar to a resonant chain of planets as TRAPPIST-1 (Gillon et al. 2016; Luger et al. 2017). The stellar masses (0.26 and 0.21 M⊙ for GJ 3378 and GJ 1289, respectively) are below the threshold of the sweet zone of 0.30.5 M⊙ identified by core-accretion and migration simulations performed by Burn et al. (2021). This does not conflict with the presence of planets, but may suggest that their real mass is not much larger than the measured minimum mass, as giant planets are extremely rare around low-mass stars - however, certain exceptions exist, such as GJ 876 b (Delfosse et al. 1998; Moutou et al. 2023) and GJ 3512 b (Morales et al. 2019).
When the Keplerian model alone is fitted to the data for GJ 3378, the best-fit eccentricity is  , a 2.2σ detection (see Table 5). When a multi-dimensional GP is used (Table C.1), however, the eccentricity is damped to
  ; although compatible with the previous value within the error bar, this represents a lower significance for an eccentric orbit, at 1.5σ. Rather, we adopted the first determination of the orbital parameters (without GPR modeling) since stellar activity is weak and unseen in the RV periodogram (see Fig. 3). However, we note it would be useful to get more RV data and more strongly constrain the eccentricity value. If confirmed, this eccentricity could originate from several scenarii: (i) gravitational interactions with a distant, more massive body in the system, (ii) dynamical mean-motion resonance with a yet unseen closer planet, or (iii) interactions between the planet and the disk, as described in (Debras et al. 2021) for more massive stars and planets. Complementary studies beyond that point would offer more RV data to better constrain other planetary companions in the system and specific simulations of disk-planet interactions for a 0.26 M⊙ star. For GJ 1289 b, the orbital eccentricity was not detected.
In addition to the interest of finding new temperate planetary systems in the solar neighbourhood, the parent stars also carry a lot of scientific motivation. Not only the level of magnetic interactions with the planets may have an impact on their habitability (Tilley et al. 2019), but the lack of a tachocline in fully convec-tive stars may present challenges and surprises to the dynamo theory (Gastine et al. 2013; Brown et al. 2020; Käpylä 2021). The planet-host stars GJ 3378 and GJ 1289 have a Rossby number of, respectively, ∼1 and 0.7, and mean large-scale magnetic fields of about 20 and 200 G during the time of observations, with a dominating dipole. They correspond to the intermediate cases in terms of rotation, where differential rotation could be solarlike (with equators rotating faster than poles), and either cyclic or stationary, following predictions from star-in-a-box simulations (Käpylä 2021). A long-term monitoring of these stars with SPIRou would allow for the cyclical behaviour to be checked, especially for the faster-evolving GJ 1289. Observed magnetic properties may as well serve as input to estimate the magne-tospheric size and shape, the stellar winds, the mass loss rate, and the magnetic energy carried over to the planet orbits. The impact on planetary atmospheric evaporation, at the relatively large orbital distance of GJ 3378 b and GJ 1289 b, is not extreme because of the slow rotation rate of the host stars (Vidotto et al. 2013). Specific simulations are needed for such cases, especially for the configuration of GJ 1289, which magnetic field is evolving within a few years (by a factor of ∼2 until now) (Lehmann et al. 2024). It could turn out that planets orbiting slowly rotating low-mass stars, even when they host a strong magnetic field, are better preserved from stellar winds than more moderately active, faster rotators.
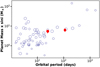 |
Fig. 8 For systems of fully convective stars, the planet minimum mass as a function of their orbital period. The red circles represent GJ 3378 b and GJ 1289 b. The symbol size is proportional to the stellar mass, in the range 0.09 M⊙ (Trappist-1) to 0.35 M⊙ (limit used for fully convective stars). |
Acknowledgements
This project received funding from the European Research Council under the H2020 research & innovation program (grant 740651 New-Worlds). E.M. acknowledges funding from FAPEMIG under project number APQ-02493-22 and research productivity grant number 309829/2022-4 awarded by the CNPq, Brazil. We acknowledge funding from Agence Nationale pour la Recherche (ANR, project ANR-18-CE31-0019 SPlaSH) and from the Investisse-ments d’Avenir program (ANR-15-IDEX-02), through the funding of the “Origin of Life” project of the Université Grenoble Alpes.
Appendix A Zero-point RV time series
The zero-point RV time series used in this analysis is shown in Fig. A.1 as a function of time as well as the variation of a few external parameters in the same time frame. The RV data were modelled with a Gaussian process using a Matern-3/2 kernel including a jitter term, using the celerite package (Foreman-Mackey et al. 2017):
 (A.1)
(A.1)
The applied solution is obtained by minimising the likelihood and has log(σ1) = 0.972, log(ρ) = 1.049, and log(σ2) = 1.128 and log-likelihood has changed from −31309 to −21809.
External parameters are: the temperature of the Cassegrain unit where the light is injected (mostly reflecting dome temperature), the mid-bench control temperature of the cryostat, the temperature and pressure of the Fabry-Pérot used for simultaneous drift measurement. None of those parameters, however, correlates with the RV variations with a Pearson coefficient greater than ∼30%. Statistics are shown in Table A.1. There are no jump observed during the 1245 day span of the observations. A slightly more unstable period has shortly occurred at the beginning of the survey, before Dec 2019 (corresponding to date 8849 in the plot). The set up point of the Fabry-Pérot temperature had to be changed a few times in the early days, before the coudé room got air conditioned. The GLS periodogram of the zero-point RV variations is only characterised by the sampling, with peaks at 1 day, 29.5 days (Moon synodic period), and 1000 days (time span).
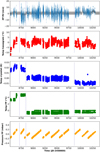 |
Fig. A.1 Zero-point RV variations of SPIRou Legacy Survey data obtained with 19 RV-quiet stars (top) as function of time, as well as the evolution of a few ancillary data, from top to bottom: temperature of injection at Cassegrain, temperature of the cryostat, temperature of the Fabry-Pérot set point, and pressure of the Fabry-Pérot cavity (with its pumping cycle). The vertical lines show the start point of new thermal cycles. On the top plot, a Gaussian Process modeling has been applied and is used to correct for any other epoch in a continuous way. |
RV dispersion of the zero-point during the SPIRou Legacy Survey.
Appendix B Corner plots
Figures B.1 and B.2 show the corner plots of the planet fits, using an eccentric model for GJ 3378 and a circular model for GJ 1289.
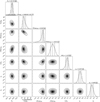 |
Fig. B.1 Corner plot corresponding to the planet fit of SPIRou data for GJ 3378 (eccentric orbit) |
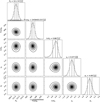 |
Fig. B.2 Corner plots corresponding to the planet fit of SPIRou data for GJ 1289 (circular orbit). |
Appendix C Full solution with Gaussian process regression analysis
In Table C.1, the parameters obtained by simultaneously fitting both the Keplerian and a quasi-periodic Gaussian process regression (GPR) activity signal, using a multivariate GPR with the differential temperature dET as an activity indicator and the RVs, are listed. The multivariate GPR model have been fitted using the pyaneti5 model (Barragán et al. 2019), briefly described by the equations C.1 to C.3. The equations are as follows:
 (C.1)
(C.1)
 (C.2)
(C.2)
 (C.3)
(C.3)
with RV(t) the radial velocities measurements; dET(t) the measured differential temperature; G the Gaussian Process defined with a quasi-periodic kernel with the covariance function described by equation C.3, with Prot the stellar rotation period in days; λe the evolution time scale in days and λp the smoothing factor, and G′ is the derivative of that QP-GPR. This framework is similar to the one established by Rajpaul et al. (2015). The fitted parameters in common with the model of the Keplerian alone (Table 5) agree within errors. The models are shown in Figs. C.1 and C.2.
Planet parameters of GJ 3378 b and GJ 1289 b including the joined dET and RV GPR analysis.
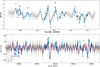 |
Fig. C.1 Quasi-periodic GPR model (black curves) obtained for dET (top) and for RVs (bottom) of GJ 3378, using Pyaneti. The Keplerian model is included in the RV modelling (red curve). SPIRou data are the blue points. |
References
- Almenara, J. M., Bonfils, X., Bryant, E. M., et al. 2024, A&A, 683, A166 [NASA ADS] [CrossRef] [EDP Sciences] [Google Scholar]
- Anglada-Escudé, G., Tuomi, M., Gerlach, E., et al. 2013, A&A, 556, A126 [NASA ADS] [CrossRef] [EDP Sciences] [Google Scholar]
- Anglada-Escude, G., Arriagada, P., Tuomi, M., et al. 2014, MNRAS, 443, L89 [NASA ADS] [CrossRef] [Google Scholar]
- Anglada-Escudé, G., Tuomi, M., Arriagada, P., et al. 2016, ApJ, 830, 74 [CrossRef] [Google Scholar]
- Artigau, É., Malo, L., Doyon, R., et al. 2018, AJ, 155, 198 [NASA ADS] [CrossRef] [Google Scholar]
- Artigau, É., Hébrard, G., Cadieux, C., et al. 2021, AJ, 162, 144 [NASA ADS] [CrossRef] [Google Scholar]
- Artigau, É., Cadieux, C., Cook, N. J., et al. 2022, AJ, 164, 84 [NASA ADS] [CrossRef] [Google Scholar]
- Barragán, O., Gandolfi, D., & Antoniciello, G. 2019, MNRAS, 482, 1017 [Google Scholar]
- Blanco-Pozo, J., Perger, M., Damasso, M., et al. 2023, A&A, 671, A50 [NASA ADS] [CrossRef] [EDP Sciences] [Google Scholar]
- Bonfils, X., Delfosse, X., Udry, S., et al. 2013, A&A, 549, A109 [NASA ADS] [CrossRef] [EDP Sciences] [Google Scholar]
- Bortle, A., Fausey, H., Ji, J., et al. 2021, AJ, 161, 230 [NASA ADS] [CrossRef] [Google Scholar]
- Brown, B. P., Oishi, J. S., Vasil, G. M., Lecoanet, D., & Burns, K. J. 2020, ApJ, 902, L3 [NASA ADS] [CrossRef] [Google Scholar]
- Burn, R., Schlecker, M., Mordasini, C., et al. 2021, A&A, 656, A72 [NASA ADS] [CrossRef] [EDP Sciences] [Google Scholar]
- Cadieux, C., Doyon, R., Plotnykov, M., et al. 2022, AJ, 164, 96 [NASA ADS] [CrossRef] [Google Scholar]
- Carmona, A., Delfosse, X., Bellotti, S., et al. 2023, A&A, 674, A110 [NASA ADS] [CrossRef] [EDP Sciences] [Google Scholar]
- Chabrier, G., & Baraffe, I. 1997, A&A, 327, 1039 [NASA ADS] [Google Scholar]
- Claudi, R., Benatti, S., Carleo, I., et al. 2016, SPIE Conf. Ser., 9908, 99081A [NASA ADS] [Google Scholar]
- Clement, M. S., Quintana, E. V., & Quarles, B. L. 2022, ApJ, 928, 91 [NASA ADS] [CrossRef] [Google Scholar]
- Cook, N. J., Artigau, É., Doyon, R., et al. 2022, PASP, 134, 114509 [NASA ADS] [CrossRef] [Google Scholar]
- Cortés-Zuleta, P., Boisse, I., Klein, B., et al. 2023, A&A, 673, A14 [CrossRef] [EDP Sciences] [Google Scholar]
- Courcol, B., Bouchy, F., Pepe, F., et al. 2015, A&A, 581, A38 [NASA ADS] [CrossRef] [EDP Sciences] [Google Scholar]
- Cretignier, M., Dumusque, X., Hara, N. C., & Pepe, F. 2021, A&A, 653, A43 [NASA ADS] [CrossRef] [EDP Sciences] [Google Scholar]
- Cristofari, P. I., Donati, J. F., Masseron, T., et al. 2022, MNRAS, 516, 3802 [NASA ADS] [CrossRef] [Google Scholar]
- Cristofari, P. I., Donati, J. F., Moutou, C., et al. 2023, MNRAS, 526, 5648 [NASA ADS] [CrossRef] [Google Scholar]
- Debras, F., Baruteau, C., & Donati, J.-F. 2021, MNRAS, 500, 1621 [Google Scholar]
- Delfosse, X., Forveille, T., Perrier, C., & Mayor, M. 1998, A&A, 331, 581 [NASA ADS] [Google Scholar]
- Delisle, J. B., Ségransan, D., Buchschacher, N., & Alesina, F. 2016, A&A, 590, A134 [NASA ADS] [CrossRef] [EDP Sciences] [Google Scholar]
- Delisle, J. B., Ségransan, D., Dumusque, X., et al. 2018, A&A, 614, A133 [NASA ADS] [CrossRef] [EDP Sciences] [Google Scholar]
- Donati, J. F., Semel, M., Carter, B. D., Rees, D. E., & Collier Cameron, A. 1997, MNRAS, 291, 658 [Google Scholar]
- Donati, J. F., Howarth, I. D., Jardine, M. M., et al. 2006, MNRAS, 370, 629 [NASA ADS] [CrossRef] [Google Scholar]
- Donati, J. F., Kouach, D., Moutou, C., et al. 2020, MNRAS, 498, 5684 [Google Scholar]
- Donati, J.-F., Cristofari, P., Finociety, B., et al. 2023, MNRAS, 525, 455 [NASA ADS] [CrossRef] [Google Scholar]
- Dressing, C. D., & Charbonneau, D. 2015, ApJ, 807, 45 [Google Scholar]
- Foreman-Mackey, D., Agol, E., Ambikasaran, S., & Angus, R. 2017, AJ, 154, 220 [Google Scholar]
- Fouqué, P., Martioli, E., Donati, J. F., et al. 2023, A&A, 672, A52 [NASA ADS] [CrossRef] [EDP Sciences] [Google Scholar]
- Fulton, B. J., Petigura, E. A., Blunt, S., & Sinukoff, E. 2018, PASP, 130, 044504 [Google Scholar]
- Gaia Collaboration 2020, VizieR Online Data Catalog: I/350 [Google Scholar]
- Gastine, T., Morin, J., Duarte, L., et al. 2013, A&A, 549, A5 [Google Scholar]
- Gillon, M., Jehin, E., Lederer, S. M., et al. 2016, Nature, 533, 221 [Google Scholar]
- Hara, N. C., Boué, G., Laskar, J., & Correia, A. C. M. 2017, MNRAS, 464, 1220 [Google Scholar]
- Huélamo, N., Figueira, P., Bonfils, X., et al. 2008, A&A, 489, L9 [NASA ADS] [CrossRef] [EDP Sciences] [Google Scholar]
- Ida, S., & Lin, D. N. C. 2004, ApJ, 604, 388 [Google Scholar]
- Käpylä, P. J. 2021, A&A, 651, A66 [Google Scholar]
- Kochukhov, O. 2021, A&A Rev., 29, 1 [NASA ADS] [CrossRef] [Google Scholar]
- Kopparapu, R. K., Ramirez, R., Kasting, J. F., et al. 2013, ApJ, 765, 131 [NASA ADS] [CrossRef] [Google Scholar]
- Kopparapu, R. K., Ramirez, R. M., SchottelKotte, J., et al. 2014, ApJ, 787, L29 [Google Scholar]
- Lehmann, L. T., Donati, J. F., Fouqué, P., et al. 2024, MNRAS, 527, 4330 [Google Scholar]
- Luger, R., Sestovic, M., Kruse, E., et al. 2017, Nat. Astron., 1, 0129 [Google Scholar]
- Martioli, E., Hébrard, G., Fouqué, P., et al. 2022, A&A, 660, A86 [NASA ADS] [CrossRef] [EDP Sciences] [Google Scholar]
- Medina, A. A., Winters, J. G., Irwin, J. M., & Charbonneau, D. 2022, ApJ, 935, 104 [NASA ADS] [CrossRef] [Google Scholar]
- Mignon, L., Meunier, N., Delfosse, X., et al. 2023, A&A, 675, A168 [NASA ADS] [CrossRef] [EDP Sciences] [Google Scholar]
- Morales, J. C., Mustill, A. J., Ribas, I., et al. 2019, Science, 365, 1441 [Google Scholar]
- Morin, J., Donati, J. F., Petit, P., et al. 2010, MNRAS, 407, 2269 [Google Scholar]
- Mortier, A., Faria, J. P., Correia, C. M., Santerne, A., & Santos, N. C. 2015, A&A, 573, A101 [NASA ADS] [CrossRef] [EDP Sciences] [Google Scholar]
- Moutou, C., Delfosse, X., Petit, A. C., et al. 2023, A&A, 678, A207 [NASA ADS] [CrossRef] [EDP Sciences] [Google Scholar]
- Ould-Elhkim, M., Moutou, C., Donati, J.-F., et al. 2023, A&A, 675, A187 [NASA ADS] [CrossRef] [EDP Sciences] [Google Scholar]
- Quirrenbach, A., Amado, P. J., Caballero, J. A., et al. 2014, SPIE Conf. Ser., 9147, 91471F [Google Scholar]
- Rajpaul, V., Aigrain, S., Osborne, M. A., Reece, S., & Roberts, S. 2015, MNRAS, 452, 2269 [Google Scholar]
- Reiners, A., Shulyak, D., Anglada-Escudé, G., et al. 2013, A&A, 552, A103 [NASA ADS] [CrossRef] [EDP Sciences] [Google Scholar]
- Reylé, C., Jardine, K., Fouqué, P., et al. 2021, A&A, 650, A201 [Google Scholar]
- Ribas, I., Reiners, A., Zechmeister, M., et al. 2023, A&A, 670, A139 [NASA ADS] [CrossRef] [EDP Sciences] [Google Scholar]
- Robertson, P., Roy, A., & Mahadevan, S. 2015, ApJ, 805, L22 [NASA ADS] [CrossRef] [Google Scholar]
- Sabotta, S., Schlecker, M., Chaturvedi, P., et al. 2021, A&A, 653, A114 [NASA ADS] [CrossRef] [EDP Sciences] [Google Scholar]
- Suárez Mascareño, A., González-Álvarez, E., Zapatero Osorio, M. R., et al. 2023, A&A, 670, A5 [NASA ADS] [CrossRef] [EDP Sciences] [Google Scholar]
- Tal-Or, L., Trifonov, T., Zucker, S., Mazeh, T., & Zechmeister, M. 2019, MNRAS, 484, L8 [Google Scholar]
- Tilley, M. A., Segura, A., Meadows, V., Hawley, S., & Davenport, J. 2019, Astrobiology, 19, 64 [Google Scholar]
- Vidotto, A. A., Jardine, M., Morin, J., et al. 2013, A&A, 557, A67 [NASA ADS] [CrossRef] [EDP Sciences] [Google Scholar]
- Wildi, F., Bouchy, F., Doyon, R., et al. 2022, SPIE Conf. Ser., 12184, 121841H [NASA ADS] [Google Scholar]
All Tables
Planet parameters of GJ 3378 b and GJ 1289 b including the joined dET and RV GPR analysis.
All Figures
|
Fig. 1 Reconstructed maps of the large-scale field of GJ 3378 in seasons 2019, 2020, and 2021 (from top to bottom). The left, middle, and right columns represent the radial, azimuthal, and meridional field components in spherical coordinates. The colour bar is expressed in Gauss. The maps are shown in a flattened polar projection down to latitude −60° with the pole at the centre and the equator depicted as a bold line. Outer ticks indicate phases of observations, assuming a rotation period of 95.1 days and counting from an arbitrary BJD of 2458745.0. |
| In the text | |
|
Fig. 2 Same as Fig. 1 but for GJ 1289 in seasons 2022 (top) and 2023 (bottom). Phases are computed assuming a rotation period of 73.66 days and counting from an arbitrary BJD of 2458649.0. |
| In the text | |
|
Fig. 3 Periodograms of GJ 3378, from top to bottom: SPIRou RVs after pre-cleaning (drift, outlier, and most affected lines removed), wapiti corrected RVs (wPCA corrected), residuals after one planet model is removed, and stacked periodogram. The blue dotted lines show one-year and half-year periods. The green dot-dash line shows the rotation period as measured with the magnetic field proxy. The orange dashed line shows the orbital period, and the red horizontal line shows the detection threshold of logBƒ = 5. On the stacked periodogram, the Y axis corresponds to the time; the orange and green lines show the orbital (24.7 days) and rotational (83–95 days) periods, respectively. |
| In the text | |
 |
Fig. 4 Same as Fig. 3 but for GJ 1289. |
| In the text | |
|
Fig. 5 SPIRou RV time series of GJ 3378 as a function of time (top) and folded at the 24.7-day period (bottom). The superimposed model is calculated with RadVel. |
| In the text | |
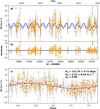 |
Fig. 6 Same as Fig. 5 but for GJ 1289. |
| In the text | |
|
Fig. 7 Periodograms of the differential temperature variations for GJ 3378 (top) and GJ 1289 (bottom). Blue regions indicate the main detected periods (centered at 83 days for GJ 3378 and 72 days for GJ1289) while orange dashed lines show the orbital periods. |
| In the text | |
|
Fig. 8 For systems of fully convective stars, the planet minimum mass as a function of their orbital period. The red circles represent GJ 3378 b and GJ 1289 b. The symbol size is proportional to the stellar mass, in the range 0.09 M⊙ (Trappist-1) to 0.35 M⊙ (limit used for fully convective stars). |
| In the text | |
|
Fig. A.1 Zero-point RV variations of SPIRou Legacy Survey data obtained with 19 RV-quiet stars (top) as function of time, as well as the evolution of a few ancillary data, from top to bottom: temperature of injection at Cassegrain, temperature of the cryostat, temperature of the Fabry-Pérot set point, and pressure of the Fabry-Pérot cavity (with its pumping cycle). The vertical lines show the start point of new thermal cycles. On the top plot, a Gaussian Process modeling has been applied and is used to correct for any other epoch in a continuous way. |
| In the text | |
|
Fig. B.1 Corner plot corresponding to the planet fit of SPIRou data for GJ 3378 (eccentric orbit) |
| In the text | |
|
Fig. B.2 Corner plots corresponding to the planet fit of SPIRou data for GJ 1289 (circular orbit). |
| In the text | |
|
Fig. C.1 Quasi-periodic GPR model (black curves) obtained for dET (top) and for RVs (bottom) of GJ 3378, using Pyaneti. The Keplerian model is included in the RV modelling (red curve). SPIRou data are the blue points. |
| In the text | |
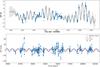 |
Fig. C.2 Same as Fig. C.1 but for GJ 1289. |
| In the text | |
Current usage metrics show cumulative count of Article Views (full-text article views including HTML views, PDF and ePub downloads, according to the available data) and Abstracts Views on Vision4Press platform.
Data correspond to usage on the plateform after 2015. The current usage metrics is available 48-96 hours after online publication and is updated daily on week days.
Initial download of the metrics may take a while.